Is World Liberty Financial (WLFI) Poised for a Breakout? This Key Pattern Formation Suggests So!
**Date: **Sat, Jan 03, 2026 | 04:25 PM GMT
As 2026 kicks off, the broader cryptocurrency market is showing renewed stability. Ethereum (ETH) has reclaimed the $3,100 level, and momentum is gradually rotating into select altcoins — including World Liberty Financial (WLFI).
WLFI has jumped nearly 9% on the day, extending its weekly gains to around 16%, but the more important development is unfolding on the chart. On lower timeframes, price action is forming a well-defined bullish structure, suggesting that the token may be gearing up for a meaningful breakout if key levels are reclaimed.
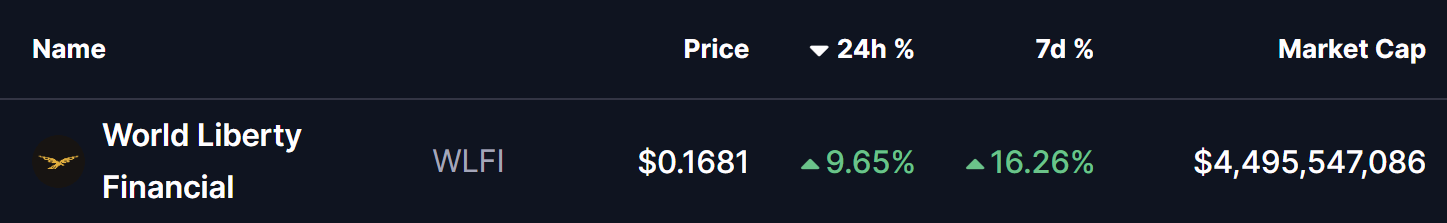
Source: Coinmarketcap
Ascending Triangle In Play
On the 4-hour chart, WLFI is forming a clear ascending triangle, characterized by a series of higher lows pushing steadily into a flat resistance zone. This pattern is widely viewed as a bullish continuation setup, especially when it develops during a prolonged consolidation phase accompanied by consistent dip-buying.
WLFI recently faced rejection near the $0.1741 resistance zone, which capped multiple upside attempts. That rejection pushed price back toward the rising support trendline, with buyers stepping in around the $0.1222 region. Importantly, each pullback has been shallower than the last, reinforcing the presence of strong underlying demand.
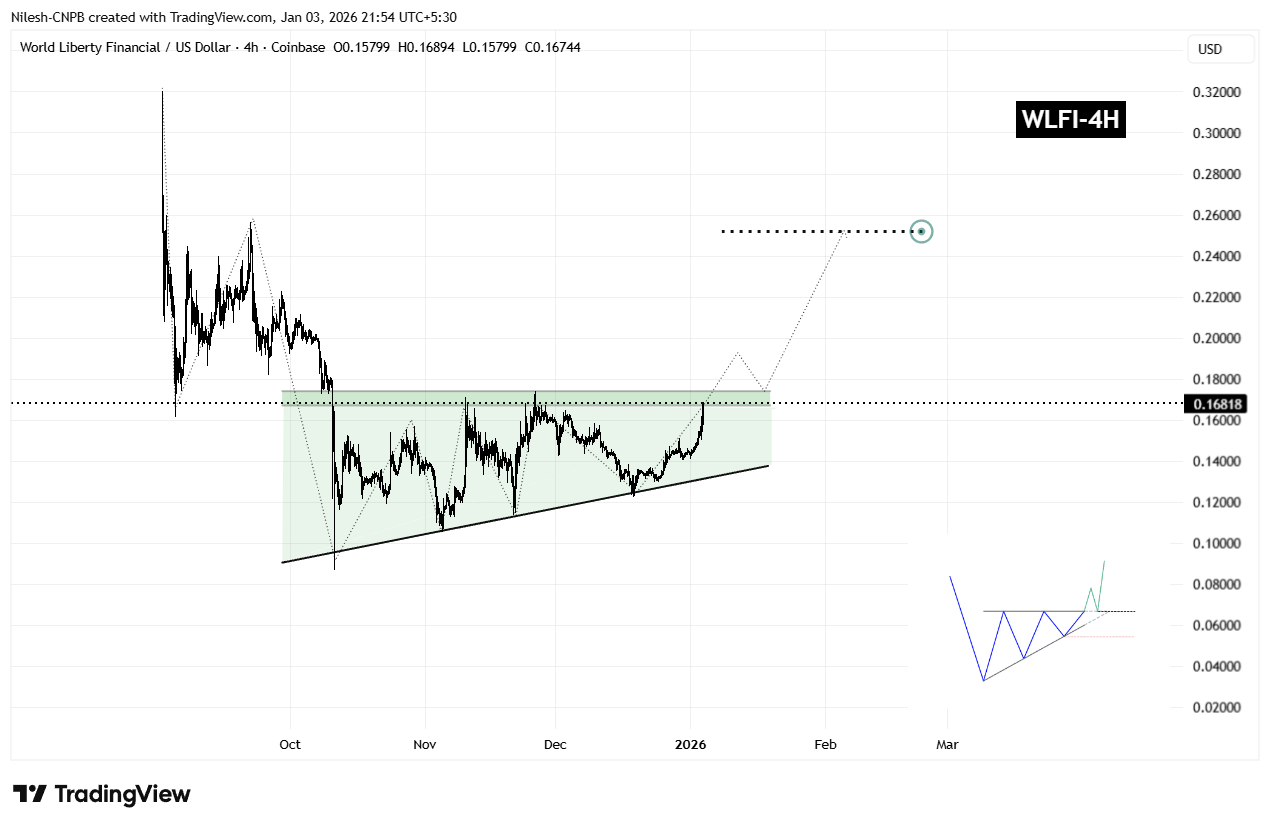
WLFI 4H Chart/Coinsprobe (Source: Tradingview)
The latest rebound has once again carried WLFI toward the upper boundary of the triangle, reinforcing the idea that demand remains firm. Rather than signaling weakness, this sideways-to-higher price action reflects healthy consolidation as volatility tightens ahead of a potential breakout.
What’s Next for WLFI?
From here, WLFI appears poised for another test of the $0.1741 resistance. A decisive breakout above this level, followed by a sustained close and a successful retest as support, would confirm the ascending triangle pattern and likely trigger a broader bullish expansion phase.
Based on the measured move of the formation, the technical upside projection points toward the $0.2522 region. This target represents a potential upside of roughly 48% from current levels and also aligns with prior price structure, strengthening the bullish case.
That said, caution remains warranted. If WLFI fails to break above resistance, price could once again rotate back toward the rising support trendline. As long as this trendline continues to hold, the broader bullish structure remains intact. A decisive breakdown below ascending support, however, would invalidate the pattern and delay any breakout scenario.
For now, the combination of improving market sentiment, steady accumulation, and a tightening ascending triangle suggests that WLFI is approaching a critical inflection point — one that could define its next major move as the new year unfolds.
Disclaimer: The views and analysis presented in this article are for informational purposes only and reflect the author’s perspective, not financial advice. Technical patterns and indicators discussed are subject to market volatility and may or may not yield the anticipated results. Investors are advised to exercise caution, conduct independent research, and make decisions aligned with their individual risk tolerance.
About Author: Nilesh Hembade is the Founder and Lead Author of Coinsprobe, with over 5 years of experience in the cryptocurrency and blockchain industry. Since launching Coinsprobe in 2023, he has been providing daily, research-driven insights through in-depth market analysis, on-chain data, and technical research.
Related Articles
Oil Goes Where Silver Goes: Long-Term Chart Signals Higher Prices Ahead
Crypto Treasury Stocks Slide Signals Solana Market Stress
PEPE Jumps 2.3% With $337M Volume Surge — Is $0.054135 the Next Breakout Trigger?
Dogecoin Price Compresses Near $0.10 as Open Interest Drops
NEAR Surges 14.5% — Will a Break Above $1.25 Ignite a Run Toward $3–$4?
SHIB Tests $0.0560 Resistance as Broader Altcoin Cycle Extends Toward 2026