
Date: Wed, Dec 31, 2025 | 09:30 AM GMT
As the final day of 2025 arrives, the broader cryptocurrency market is showing modest strength, with both Bitcoin (BTC) and Ethereum (ETH) trading slightly in the green. This steady performance among major assets has helped stabilize overall market sentiment, creating room for select altcoins — including Chiliz (CHZ) — to develop constructive technical setups.
CHZ is standing out with an impressive 18% daily gain. More importantly, price action has confirmed a technically significant breakout, strengthening the case for further upside in the near term.

Source: Coinmarketcap
Descending Channel Breakout
On the daily chart, Chiliz had been trapped inside a well-defined descending channel since its early December peak near the $0.051 region. This structure was marked by a series of lower highs and lower lows, reflecting persistent bearish pressure that gradually pushed CHZ down toward the $0.028 support area.
That bearish phase now appears to be ending. After reclaiming the 200-day moving average, CHZ decisively broke above the upper boundary of the descending channel near the $0.04451 level. This breakout signals a meaningful shift in market control, with buyers stepping back in after weeks of compression.
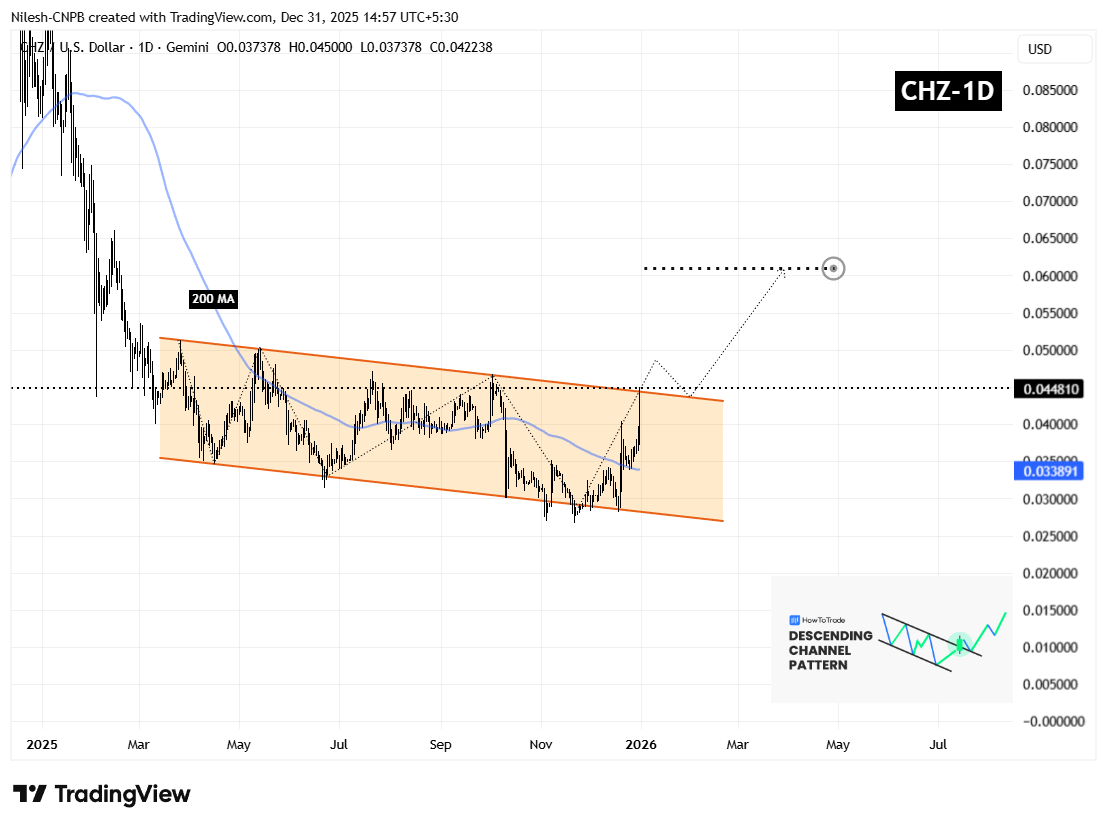
Chiliz (CHZ) Daily Chart/Coinsprobe (Source: Tradingview)
What’s Next for CHZ?
Following a breakout of this nature, short-term volatility is normal. A brief pullback toward the former resistance zone is often considered healthy. For CHZ, the $0.04451 area now stands as a critical support level. A successful retest of this zone, followed by renewed buying interest, would further validate the breakout and strengthen the bullish structure.
If buyers continue to defend reclaimed levels, the chart’s measured move points toward a potential upside target near the $0.06101 region. This would represent roughly a 35% advance from the breakout zone and aligns closely with the projected extension visible on the chart.
On the downside, a failure to hold above the breakout level could slow momentum and lead to consolidation. A sustained move back inside the descending channel would weaken the bullish outlook and delay any upside continuation. However, as long as CHZ remains above reclaimed resistance and the 200-day moving average, the broader technical structure favors higher prices in the sessions ahead.
For now, the breakout remains in its early stages, but CHZ appears well-positioned to extend its recovery move if overall market conditions remain supportive.
Disclaimer: The views and analysis presented in this article are for informational purposes only and reflect the author’s perspective, not financial advice. Technical patterns and indicators discussed are subject to market volatility and may or may not yield the anticipated results. Investors are advised to exercise caution, conduct independent research, and make decisions aligned with their individual risk tolerance.
About Author: Nilesh Hembade is the Founder and Lead Author of Coinsprobe, with over 5 years of experience in the cryptocurrency and blockchain industry. Since launching Coinsprobe in 2023, he has been providing daily, research-driven insights through in-depth market analysis, on-chain data, and technical research.

Disclaimer: The information on this page may come from third parties and does not represent the views or opinions of Gate. The content displayed on this page is for reference only and does not constitute any financial, investment, or legal advice. Gate does not guarantee the accuracy or completeness of the information and shall not be liable for any losses arising from the use of this information. Virtual asset investments carry high risks and are subject to significant price volatility. You may lose all of your invested principal. Please fully understand the relevant risks and make prudent decisions based on your own financial situation and risk tolerance. For details, please refer to
Disclaimer.
Related Articles
Polkadot’s AltRank Exploded to #1 While $DOT Price Stayed Down – The Signal Was There Weeks Ago
Something interesting has been happening with Polkadot, and most people probably missed it.
While the DOT price has been sitting relatively low compared to its all-time highs, another metric was quietly flashing a strong signal. AltRank, a metric from LunarCrush, jumped from 109 to 1 in just o
CaptainAltcoin14m ago
BTC Traditional Bottom Indicators Fail, Three New Indicators Gain Market Attention
Bitcoin's recent price volatility has been significant, falling from $76,000 to $69,200, with mixed signals from market bottom indicators. Newly focused indicators such as CVDD, NUPL, and stablecoin inflows may provide clearer insights into market dynamics, suggesting that the bottom has not yet been reached.
GateNews31m ago
BTC 15-minute surge of 0.53%: Dovish CPI signals trigger buying frenzy, whale accumulation intensifies supply compression
During the 2026-03-19 13:30-13:45 (UTC) time window, BTC recorded a 15-minute return of +0.53%, with the price moving slightly upward within the range of 69243.3 to 69826.0 USDT, with a volatility amplitude of 0.84%. The unexpected CPI data release combined with on-chain liquidity tightening sparked market attention, causing significant short-term price movements in BTC. Trading volume did not show extreme expansion, but spot buying pressure increased rapidly.
The main driver of this price movement was the official release of US March CPI data at 13:30 (UTC), which triggered a recovery in market risk appetite. C
GateNews32m ago
BTC Drops 0.50% in 15 Minutes: Whale Fund Outflows and Leveraged Short Positions Drive Downward Movement
During the period from 2026-03-19 12:45 to 2026-03-19 13:00 (UTC), BTC spot price fluctuated rapidly within the 69108.5 - 69664.4 USDT range, with a volatility amplitude of 0.80% and a return rate of -0.50%. Market attention increased, short-term volatility intensified significantly, and trading volume expanded accordingly, reflecting rising risk-aversion sentiment among investors during this window and increased active selling pressure.
The primary drivers of this volatility were whale address fund outflows on-chain and leverage position adjustments. Specifically, whale addresses experienced approximately 2,00
GateNews1h ago
XRP Price Could Resume Journey to New All-Time High if This Key Level Holds
XRP price pulled back after a recent move toward $1.60, yet the bigger structure still points to a larger trend that has not broken. Price now trades near $1.46, and that places it inside a zone that could decide whether the next leg higher begins or stalls again.
Crypto analysis platform
CaptainAltcoin1h ago
