Polkadot price rises 12% after Kusama upgrade: Will this rally last?
Today, the Polkadot (DOT) price recorded an impressive increase of about 12% in just one day, surprising many traders. The main driver comes from the major upgrade on Kusama – a network closely linked to Polkadot. This event has contributed to improving short-term sentiment across the entire Polkadot ecosystem.
However, overall, the long-term trend remains unclear. DOT has still decreased approximately 53.5% over the past three months. A strong rally cannot erase the prolonged downtrend that preceded it.
Investors are now asking a big question: Is this the start of a new trend, or just a technical rebound in a weak market?
Kusama Upgrade Brings New Momentum to Polkadot Market Sentiment
The price increase of DOT is driven by Kusama – Polkadot’s testnet, where improvements are tested before official implementation. This week, Kusama deployed a notable upgrade, reducing block processing time to under 2 seconds and enhancing smart contract support. Transactions are faster, and expanded development tools attract more community interest.
Although this upgrade occurred on Kusama, not directly on Polkadot, the two networks are closely connected. Therefore, improvements on Kusama often influence market sentiment and DOT’s price.
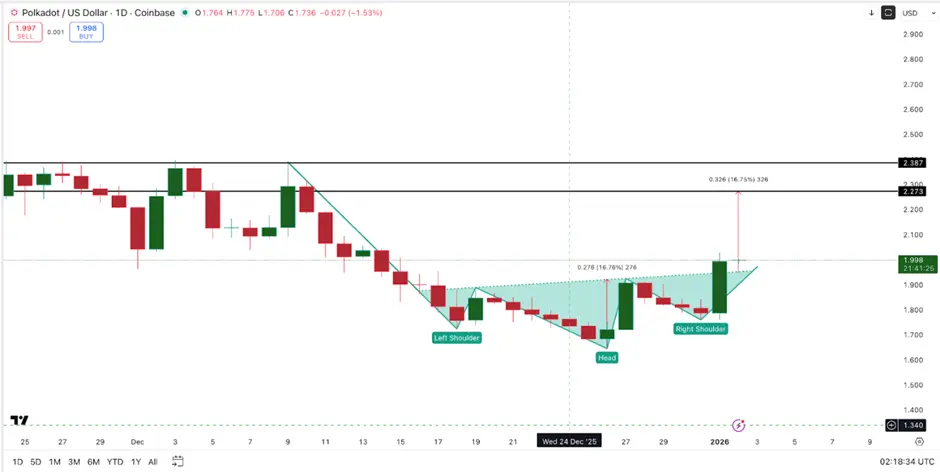 Polkadot DOT Price Surge | Source: TradingView Positive reactions from the cryptocurrency market to technical changes are common. An upgrade can create a “story” in the short term, attracting speculative capital and causing significant price volatility.
However, for a sustainable upward trend, real capital flow and demand must align. This remains a weak point in this rally.
DOT Chart Signals Breakout, but Buying Pressure Is Not Yet Strong Enough
From a technical analysis perspective, DOT recently broke the inverse head and shoulders pattern – often appearing at bottoms and signaling a potential trend reversal. If the rally continues, DOT could target the $2.27 level, representing an additional potential increase of about 13% from current levels. This is why DOT is back in the spotlight for many investors.
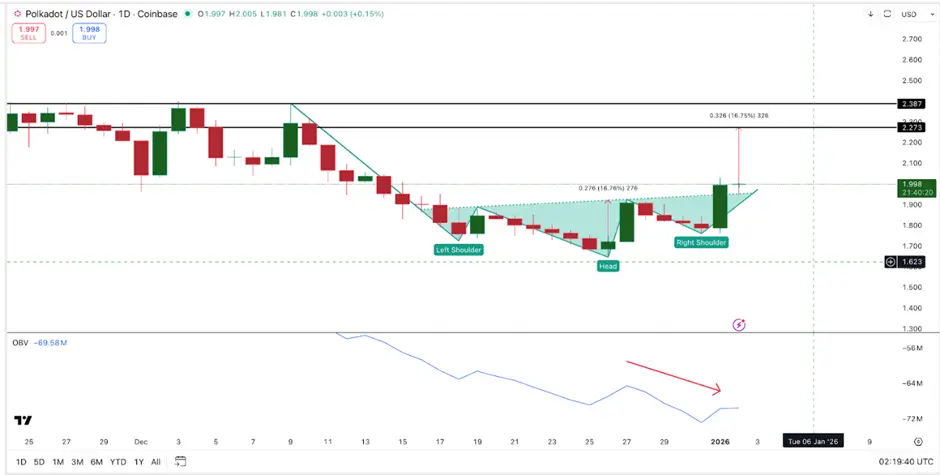 DOT Volume | Source: TradingView However, price patterns need to be confirmed by actual buying strength. The On-balance Volume (OBV) indicator – which tracks whether buyers or sellers control the trend – is still trending downward, indicating that trading volume has not fully aligned with the price. This often reflects uncertain market sentiment.
Similarly, the Chaikin Money Flow (CMF) indicator – measuring money flow into/out of the asset – remains below zero, suggesting large investors have not yet fully entered the market.
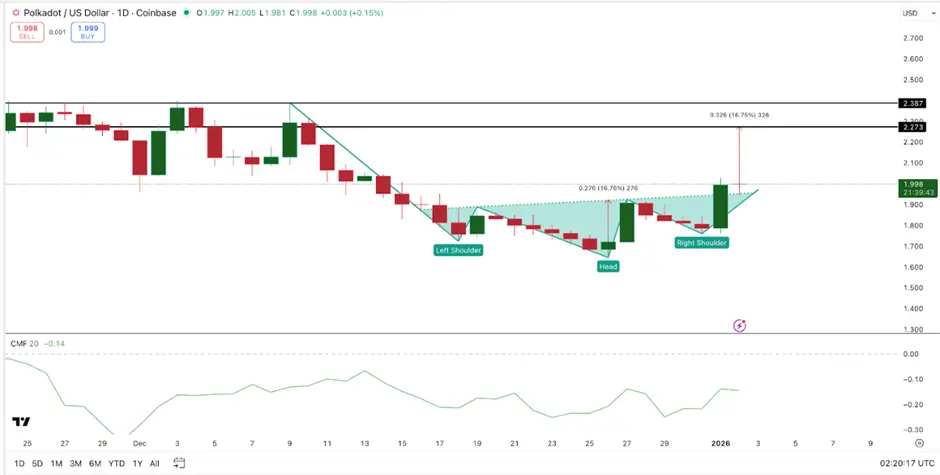 DOT CMF Indicator | Source: TradingView The DOT balance on exchanges has not changed significantly, reflecting that the recent price increase is mainly driven by short-term sentiment rather than strong capital inflows.
In summary, although technical charts show positive signals, the fundamental factors related to capital flow have not yet fully supported a sustained rally.
Important Price Levels of DOT to Watch
In the context of mixed indicators, identifying key price zones becomes more important than peripheral information.
If DOT stays above $2.02, the bullish outlook remains. This is a short-term support zone, maintaining the breakout structure.
Conversely, if DOT drops below $1.76, the technical pattern will weaken, buying pressure may retreat, and market confidence could decline rapidly.
If DOT breaks below $1.64, the recovery is likely to end, and the price could revert to a prolonged downtrend.
Currently, DOT’s movement remains uncertain. The Kusama upgrade provides upward momentum, and technical charts create trading opportunities, but what’s missing is confirmation from trading volume and capital flow. Without improvements in these factors, DOT’s rally may be only temporary.
Related Articles
Altcoin Dominance Hits Bullish MACD — Trade These 4 Coins Now for Potential 80% Profits
Will XRP Hold $1.33 or Extend Toward $1.30 Before Rebound?
Continuing to rise! Bitcoin briefly breaks above $74,000, Ethereum surpasses $2,200, and the entire network experiences $570 million in liquidations.
$15M Revenue in Two Months, 60% Market Share – Why Is ONDO Price Still Down 50%?
Dogecoin Drops 9.6% to $0.08885 as Adam and Eve Pattern Tests Key Neckline
HBAR at a Crossroads: Will $0.095 Support Trigger a Break Toward $0.106?