After losing the $80 support level, what is the future outlook for Litecoin?
On Friday, the strong volatility wave of Bitcoin triggered widespread selling pressure in the market, causing Litecoin (LTC) to plummet by 7.5% within just 5 hours. This downward momentum pushed LTC to a new low at $72.64 before the coin attempted to recover. At the time of recording, LTC is trading around $75.89.
In the past two weeks of trading, Litecoin bulls have completely lost control of the important long-term support zone between $80–$84. Previously, a report from Coin Photon emphasized that this area plays a key role in maintaining LTC’s long-term price structure.
Notably, the report also pointed out that the bulls are weakening significantly, almost exhausted of momentum, and are only maintaining a defensive stance. Even with Litecoin being included in the Bitwise 10 Crypto Index ETF (BITW), it was not enough to generate a significant boost to the price on the trading chart.
Assessing the strength of Litecoin’s next downward trend
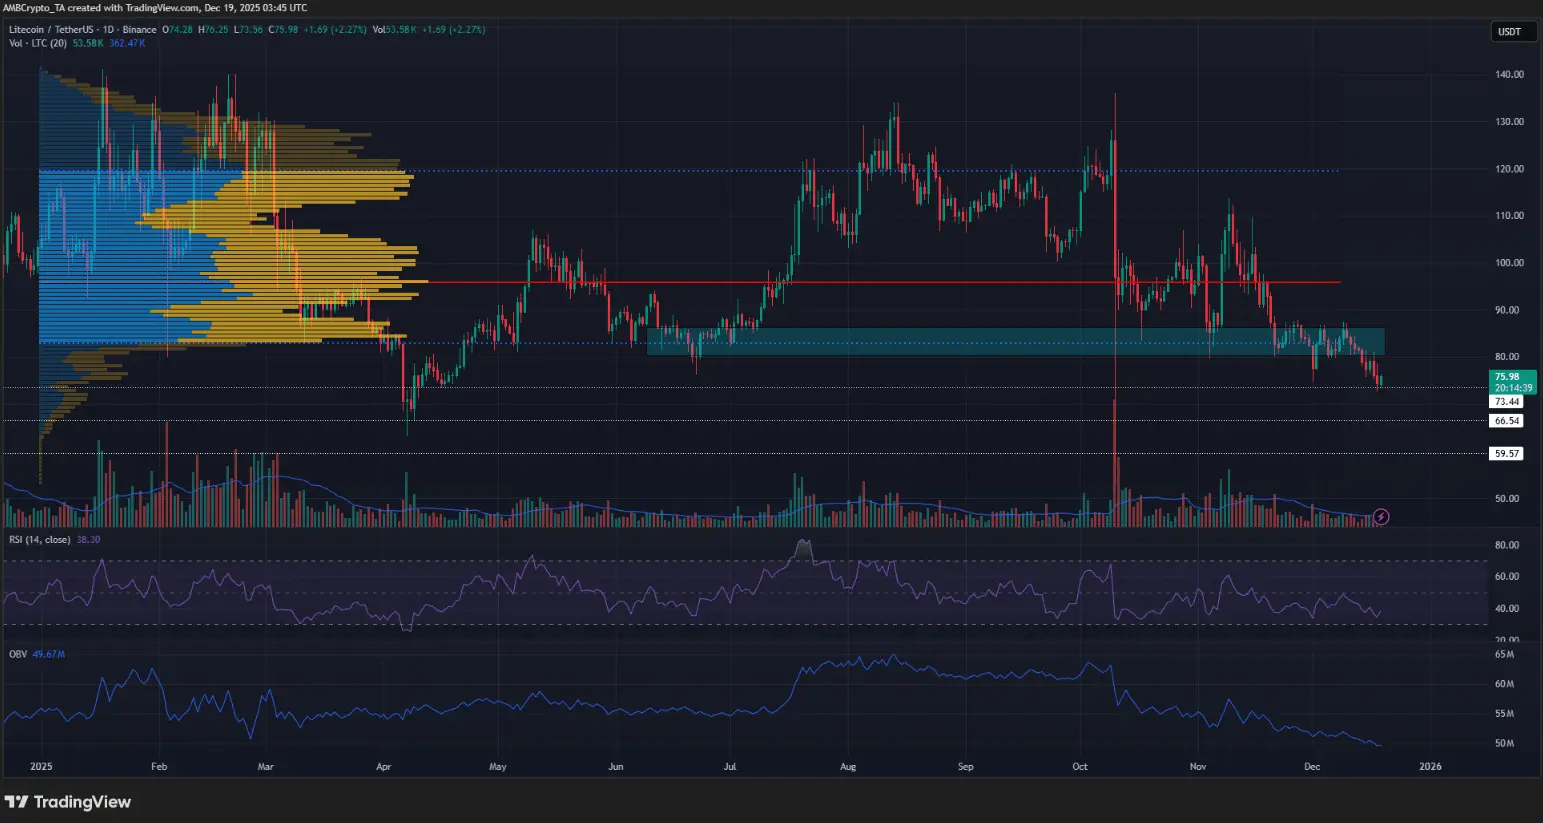 Daily LTC/USDT chart | Source: TradingView Using the Fixed Range Volume Profile tool for the entire 2025, the Value Area High (VAH) and Value Area Low (VAL) are identified at $120 and $83 respectively. After the first week of October, when Litecoin continued trading above the year’s VAH, the market experienced a sharp decline on October 10, marking an important turning point in the trend structure.
The OBV (On-Balance Volume) indicator shows that the supply-demand balance at that time had clearly tilted in favor of the bears, reflecting overwhelming selling pressure. In November, Litecoin entered a period of high volatility and attempted to defend the psychological support zone of $80, but weak demand was insufficient to reverse the downward trend forming.
When the $80 level was officially broken, the situation became more unfavorable for the bulls. The next long-term support zones that the bears might target are at $73.4, $66.5, and deeper at $59.6.
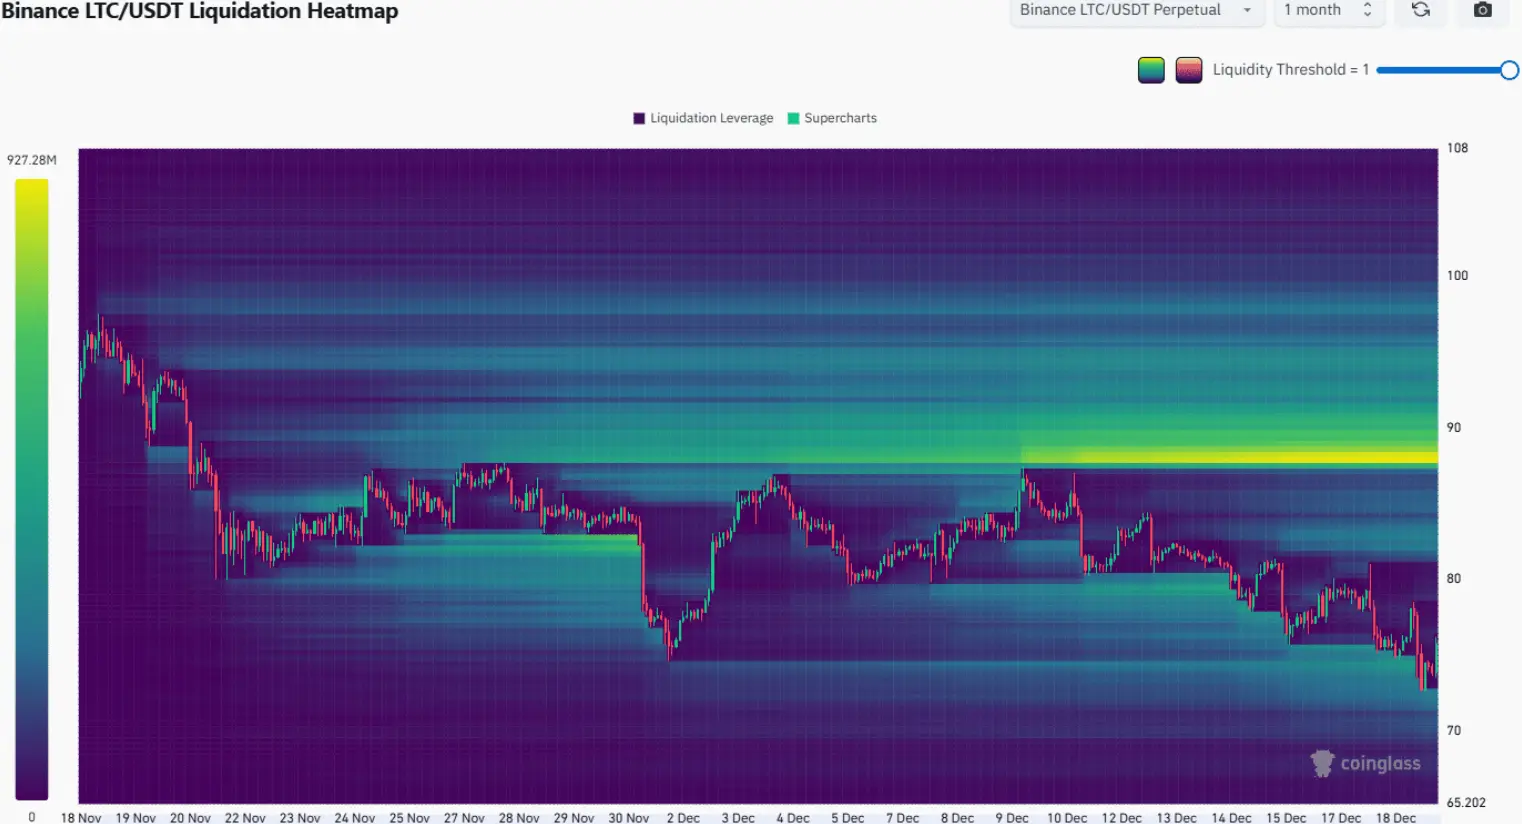 Source: CoinGlass Notably, the monthly liquidation heatmap shows that the liquidity around the $73 zone has been wiped out. In this context, a technical rebound could occur, and the price is likely to be pulled back toward the “magnet” zone of $82–$83, where supply and demand may continue to struggle in the short term.
Less likely scenarios for Litecoin
This is a notable bullish scenario. The $88 zone currently acts as a “liquidity magnet,” where a large concentration of short position liquidations (Short) is focused, potentially attracting the price gradually toward this area. If the overall market sentiment turns positive, triggering a chain reaction of short squeeze effects, LTC could break above $90, thereby reaffirming and strengthening the medium-term bullish trend.
Trader recommendations – Continue to maintain a bearish outlook
This altcoin has just lost a key support zone, signaling a clear market weakening. The main trend and price structure remain entirely bearish, while buying pressure on higher timeframes is almost absent, indicating that the bulls are not yet strong enough to regain control.
In a recovery scenario, the $80–$84 zone is likely to serve as a very strong resistance area that is difficult to conquer. Therefore, traders may consider short-selling on rebounds, with target prices around the support zones of $66 and deeper at $59.
Related Articles
Shiba Inu bulls are looking for an exit opportunity: Is this that opportunity?
NEAR and PHA Steal Spotlight by Defying the Fall Across the Crypto Market
BTC 15-minute increase of 1.06%: Macroeconomic liquidity expectations and institutional buying resonance driving the market
ETH short-term increase of 1.04%: Spot buying driven and deflation expectations resonate to amplify the rally
Bitmine scans another 50,000 ETH! Tom Lee Looks Forward to a Rebound in March