Bulls vs. Bears: Is SEI on Track to $0.20, or Will the Bears Hold the Fort?
- SEI is up 2%, trading at around $0.16.
- Its 24-hour trading volume has dropped by 13%.
With the crypto market flashing red signals more and green in a few, the assets are riding the rollercoaster. The bearish pressure is not fading away; instead, it is tricking the price movements across the board. The majority of the digital assets are trading on the downside, including Bitcoin (BTC) and Ethereum (ETH)
Meanwhile, SEI has reported a spike of over 2.22%. The asset’s high and low trading levels of the day are marked at around $0.1639 and $0.1489. The CMC data shows that SEI trades at the $0.1630 mark, with its market cap reaching $1.02 billion. The 24-hour trading volume has dropped by 13.67% to $160.63 million
The Ali chart exhibits that the TD Sequential indicator has flashed a buy signal, which usually appears after a series of candles indicating trend exhaustion. This suggests that the recent downtrend may be ending. Significantly, this may be a potential entry point for a reversal or short-term bounce.
Can SEI Break Out or Will It Stall?
SEI’s Moving Average Convergence Divergence (MACD) and signal lines are at the same value, settled below the zero line. It implies a strong bearish phase. The momentum is stable but bearish, with no immediate reversal signs. Additionally, the Chaikin Money Flow (CMF) indicator stationed at -0.04 points out the slight selling pressure in the market. As it is close to zero, it shows mild bearish sentiment, not extremely strong
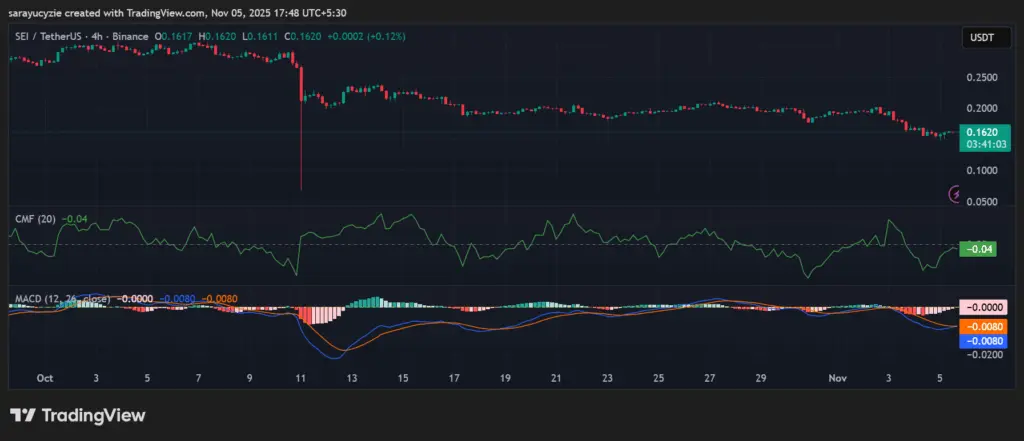 *SEI chart (Source: TradingView)*The Bull-Bear Power (BBP) value found at -0.0058 indicates that the bears are slightly stronger than the bulls. Notably, the selling pressure is mild, and the market is nearly balanced. SEI’s daily Relative Strength Index (RSI) is positioned at around 38.61, suggesting the trend is weak. Also, it might be leaning toward the oversold territory, below 30
SEI’s overall momentum is bearish, and the price might fall toward a support range at around $0.1624. A sustained correction on the downside could initiate the death cross and push the price below $0.1618. Assuming the bulls have taken control of the asset, the price could climb to find the nearby resistance level at $0.1636. An extended bullish pressure might trigger the golden cross, and likely send the price above $0.1642.
Top Updated Crypto News
Ethereum (ETH) in the Danger Zone: Is a Drop Below $3K Imminent?