This comprehensive guide explores eight essential candlestick patterns for cryptocurrency traders, providing actionable insights into market sentiment and price movements. Covering both bullish patterns (Hammer, Inverted Hammer, Bullish Engulfing, Morning Star, Piercing Line) and bearish patterns (Hanging Man, Shooting Star, Bearish Engulfing), the article equips traders with reliable technical analysis tools. Learn how to identify these formations, understand their implications, and combine them with other technical indicators like RSI and Moving Averages on Gate to reduce false signals. The guide emphasizes that successful trading requires confirmation from multiple indicators, proper risk management, and disciplined strategy execution. Perfect for cryptocurrency traders seeking to enhance their technical analysis skills and make more informed trading decisions in volatile markets.
What Is a Candlestick Chart?
A candlestick represents the price movement of an asset over a specific time period. Each candlestick displays four fundamental components that provide crucial information about market behavior:
- Open: The asset's price at the beginning of the time period
- Close: The asset's price at the end of the time period
- High: The highest price reached during the time period
- Low: The lowest price observed during the time period
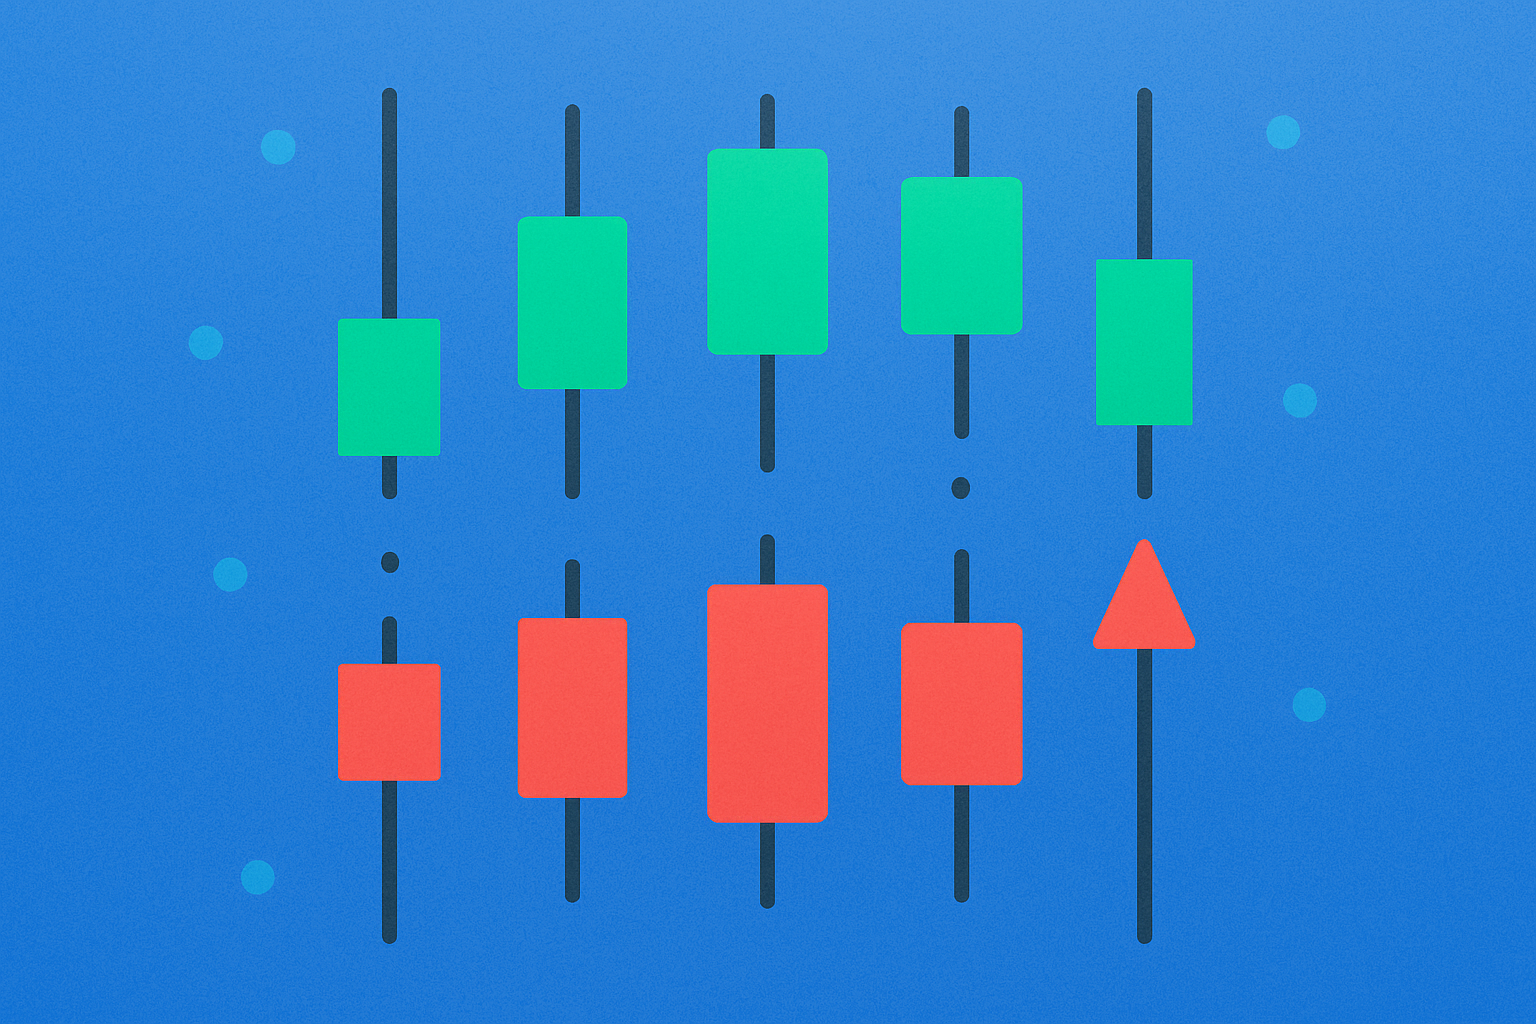
The candlestick body illustrates the difference between the opening and closing prices, while the wicks (or shadows) extend above and below to show the high and low levels. Candlesticks are typically color-coded to provide immediate visual clarity:
- Green: The closing price is higher than the opening price, indicating upward price movement
- Red: The closing price is lower than the opening price, signaling downward price movement
This visual representation allows traders to quickly assess market sentiment and price action at a glance, making it an invaluable tool for technical analysis in cryptocurrency markets.
Developed by Japanese rice traders in the 18th century, candlestick charts have evolved into an indispensable tool for modern investors and traders. These charts offer significant advantages over simple line charts by visually reflecting both price movements and market psychology in a comprehensive manner.
Candlestick charts provide traders with a deeper understanding of market dynamics by showing not just where prices opened and closed, but also the full range of price action during each period. This additional information reveals the strength of buying or selling pressure, helping traders identify potential trend reversals, continuations, and periods of market indecision. The ability to read market sentiment through candlestick patterns has made them the preferred charting method for cryptocurrency traders worldwide.
Candlestick formations develop over time and reveal trends, reversals, or market indecision. A single candlestick provides clues about price action within its own time frame, offering insights into the battle between buyers and sellers during that specific period.
However, when multiple candlesticks are analyzed together, they form larger patterns that provide more reliable signals about trend direction and potential market movements. Understanding these formations requires recognizing both individual candlestick characteristics and how they interact with preceding and following candles. Experienced traders learn to identify these patterns quickly, using them as early warning signals for potential trading opportunities in the volatile cryptocurrency markets.
Eight Essential Candlestick Patterns for Crypto Trading
Candlestick patterns are classified into two main categories: bullish patterns (signaling potential price increases) and bearish patterns (indicating possible price declines). Mastering these fundamental patterns provides traders with a powerful framework for analyzing market sentiment and making informed trading decisions.
Bullish Candlestick Patterns
Hammer
- Appearance: Forms at the bottom of a downtrend, featuring a small body (green or red) at the top with a long lower wick and little to no upper wick
- Meaning: Demonstrates strong buyer interest following selling pressure, suggesting that buyers have successfully defended a price level and are beginning to regain control
- Signal: Indicates potential price increase or trend reversal
- Trading Implication: When confirmed by subsequent bullish candles, the hammer pattern often marks the end of a downtrend and the beginning of an upward movement, making it an excellent entry signal for long positions
- Appearance: Appears at the bottom of a downtrend, characterized by a small body (green or red) with a long upper wick and minimal or no lower wick
- Meaning: Shows that buyers attempted to push prices higher but encountered resistance from sellers, though the buying pressure indicates a potential shift in momentum
- Signal: Suggests the beginning of a bullish trend
- Trading Implication: While the pattern shows initial rejection of higher prices, it demonstrates that buyers are becoming more aggressive, often preceding a trend reversal when confirmed by volume and subsequent price action
Bullish Engulfing
- Appearance: Occurs at the end of a downtrend, consisting of a small red candle followed by a larger green candle that completely engulfs the previous candle's body
- Meaning: Powerful buying pressure overwhelms sellers and market sentiment shifts decisively to positive, representing a complete reversal of the previous bearish momentum
- Signal: Strong bullish reversal indication
- Trading Implication: This pattern is considered one of the most reliable bullish reversal signals, especially when it appears after an extended downtrend and is accompanied by high trading volume
Morning Star
- Appearance: Forms at the end of a downtrend as a three-candle pattern: a long red candle, followed by a short-bodied "star" candle, then a long green candle
- Meaning: Illustrates that selling pressure is diminishing, followed by a period of indecision, and finally buyers taking control to initiate an upward trend
- Signal: Bullish reversal formation
- Trading Implication: The morning star is a highly regarded pattern that suggests a significant shift in market sentiment, with the middle "star" candle representing a transition phase between bearish and bullish control
Piercing Line
- Appearance: Develops at the end of a downtrend, featuring a long red candle followed by a long green candle that closes above the midpoint of the red candle's body
- Meaning: Despite a bearish opening, buyers enter forcefully and push prices significantly higher, demonstrating strong rejection of lower prices
- Signal: Bullish reversal with strong buying interest
- Trading Implication: The piercing line pattern indicates that buyers are willing to step in aggressively, often marking the end of a correction or downtrend in cryptocurrency markets
Bearish Candlestick Patterns
Hanging Man
- Appearance: Forms at the top of an uptrend, displaying a small body (green or red) with a long lower wick and little to no upper wick
- Meaning: Signals intensifying selling pressure and weakening upward momentum, suggesting that sellers are testing lower prices despite the prevailing uptrend
- Signal: Potential selling or beginning of a decline
- Trading Implication: When appearing after a significant rally, the hanging man warns traders of potential exhaustion in buying pressure and possible trend reversal, particularly when confirmed by subsequent bearish candles
Shooting Star
- Appearance: Appears at the top of an uptrend, characterized by a small body (green or red) with a long upper wick and minimal or no lower wick
- Meaning: Buyers pushed prices higher but faced sharp rejection, with the close near the opening price indicating failed breakout attempts and potential reversal
- Signal: Bearish reversal following price increases
- Trading Implication: The shooting star demonstrates that higher prices were rejected decisively, often marking the peak of a rally and signaling an excellent opportunity for profit-taking or short positions
- Appearance: Occurs at the top of an uptrend, consisting of a small green candle followed by a large red candle that completely engulfs the previous candle's body
- Meaning: Strong selling pressure dominates the market and sentiment shifts decisively negative, representing a complete reversal of bullish momentum
- Signal: Beginning of a downtrend
- Trading Implication: This powerful reversal pattern often marks the end of an uptrend and the start of significant selling pressure, making it a critical signal for risk management and potential short positions in cryptocurrency trading
Combining Candlestick Patterns With Other Indicators
While candlestick patterns are powerful analytical tools on their own, they become significantly more effective when combined with other technical indicators such as the Relative Strength Index (RSI), Moving Averages, or Bollinger Bands. Experienced traders use multiple confirmation methods to reduce false signals and improve their decision-making processes.
For example, a bullish hammer pattern gains additional credibility when it appears alongside an oversold RSI reading or at a key moving average support level. Similarly, a bearish engulfing pattern becomes more actionable when confirmed by a break below a significant moving average or when accompanied by declining volume. This multi-indicator approach helps traders distinguish between reliable signals and market noise, particularly important in the volatile cryptocurrency markets where false breakouts and reversals are common.
Successful traders typically wait for at least two forms of confirmation before executing trades based on candlestick patterns, combining price action analysis with momentum indicators, volume analysis, and key support and resistance levels.
Conclusion
Candlestick patterns serve as indispensable tools for cryptocurrency traders, offering valuable insights into market sentiment and potential price movements. By understanding these fundamental patterns and their implications, traders can better anticipate market behavior and identify high-probability trading opportunities.
However, it's crucial to remember that no single pattern or indicator guarantees success. The most effective approach involves confirming candlestick signals with other technical indicators, maintaining proper risk management, and developing a comprehensive trading strategy. As you gain experience reading candlestick patterns in cryptocurrency markets, you'll develop an intuitive understanding of market psychology that enhances your trading decisions.
Always practice responsible trading by using appropriate position sizing, setting stop-loss orders, and never risking more capital than you can afford to lose. Continuous learning and disciplined application of technical analysis principles will help you navigate the dynamic cryptocurrency markets more effectively.
FAQ
What is a candlestick chart/K-line chart, and what are its components?
A candlestick chart consists of four key components: opening price, closing price, highest price, and lowest price. The body shows price movement between open and close, colored to indicate gains or losses. The wicks extend from the body to show the high and low prices during the period.
How to identify and trade common candlestick patterns such as hammer, engulfing, and morning star?
Identify hammer lines by observing long lower wicks with small bodies indicating buying pressure and potential uptrends. Engulfing patterns show reversal strength when a larger candle completely contains the previous one. Morning star patterns, appearing at bottoms, suggest upward price movement ahead. Confirm signals with volume and support resistance levels.
How reliable are candlestick patterns in crypto trading, and what is the success rate?
Candlestick patterns alone have limited reliability, but when combined with other analysis tools like support/resistance levels and volume analysis, success rates improve significantly. Effectiveness varies based on trader experience and market conditions. Best practice is not to rely on a single tool.
What are bullish and bearish K-line signals, and how to identify trend reversals?
Bullish K-lines signal rising trends with long bodies and small wicks; bearish K-lines indicate falling trends. Identify reversals through patterns like hammers(锤子线), shooting stars(射击之星), and engulfing patterns. Confirm with volume and other indicators for accuracy.
How to combine multiple candlestick patterns to improve the accuracy of trading decisions?
Combine candlestick patterns across different timeframes to verify trend reliability. Analyze multiple chart periods simultaneously to confirm trend direction and reversal signals. Use technical indicators alongside patterns to enhance decision accuracy and reduce false signals for more precise entries and exits.
What are the limitations and risks of using candlestick technical analysis in the crypto market?
Candlestick analysis works well for short-term trading but crypto markets are highly volatile and susceptible to sudden events, leading to inaccurate predictions. Combine it with fundamental analysis. Key risks include extreme price fluctuations and rapid market sentiment shifts.
Beginners should start learning which basic K-line patterns?
Start with engulfing patterns (bullish and bearish) for trend analysis. Master head and shoulders plus double top/bottom for reversal signals. Then learn support and resistance levels for price identification.
* The information is not intended to be and does not constitute financial advice or any other recommendation of any sort offered or endorsed by Gate.