Discover the ascending wedge pattern in cryptocurrencies, including its definition, trading strategies, reversal signals on Gate, and risk management techniques. This comprehensive technical analysis guide is designed for traders at every skill level.
What Is an Ascending Wedge Pattern?
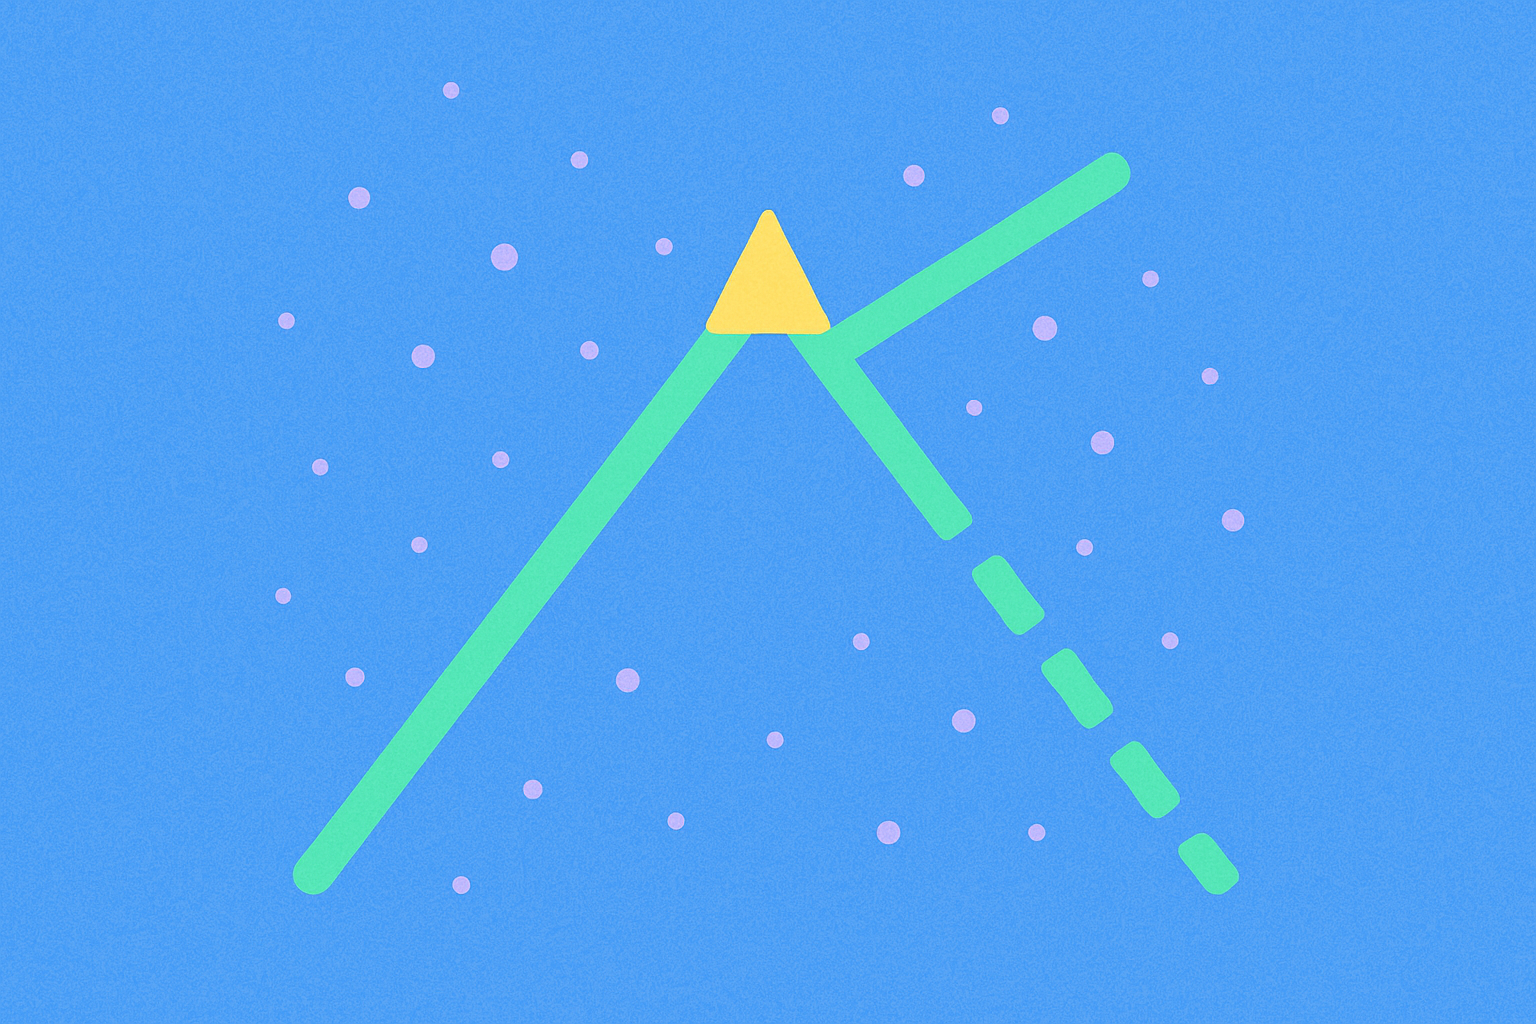
An ascending wedge pattern is one of the most important formations in technical analysis, widely used by traders to anticipate possible trend reversals or continuations in financial markets. This pattern features price movement within two upward-sloping, converging trendlines, resulting in a distinct wedge-shaped chart formation.
This pattern appears across multiple asset classes—including stocks, forex, commodities, and cryptocurrencies. Its versatility makes it a valuable tool for traders employing diverse strategies and working with different instruments.
The significance of the ascending wedge lies in its ability to offer traders clear signals about potential changes in market dynamics. Accurately interpreting this pattern supports sound trading decisions based on its characteristics and the subsequent shifts in price action. Understanding how the ascending wedge forms and its psychological implications gives traders a meaningful advantage in forecasting market moves.
Significance in Technical Analysis
The ascending wedge pattern holds a special place among technical analysis tools because of its reliability and practical utility. When traders spot this pattern on a chart, they gain the ability to make more informed decisions and craft effective strategies with clearly defined entry and exit points.
Key aspects of the ascending wedge in technical analysis include:
Trend Reversal or Continuation Indicator: The ascending wedge reliably signals a potential change in market direction. Depending on the setup, it can indicate either a reversal or a continuation after a temporary consolidation.
Entry and Exit Points: The pattern offers precise guides for identifying optimal trade entry and exit moments. The wedge’s support and resistance lines act as logical levels for placing orders.
Risk Management: This pattern’s structure allows traders to manage risk efficiently, setting rational stop-loss levels and calculating profit targets based on the wedge’s parameters.
Ascending Wedge Pattern: Key Features
To identify and interpret the pattern correctly, traders should understand its core characteristics:
Formation of the Ascending Wedge: Price moves within a narrowing range defined by two converging upward trendlines. Each successive high is relatively lower than the previous, while lows rise more rapidly, compressing the price range.
Trendlines: The lower support trendline connects higher lows, reflecting strengthening buying interest. The upper resistance trendline connects lower highs, showing weakening buyer momentum. The lower line always has a steeper slope than the upper, creating the wedge’s signature shape.
Trading Volume: Volume is vital for confirming the pattern. As the wedge develops, trading volume typically declines, signaling reduced market activity and participant uncertainty. However, when price breaks through one wedge boundary, volume should spike sharply—validating the signal and the strength of the new move.
Types of Ascending Wedges
Bullish Reversal
A bullish ascending wedge is relatively rare but important. It forms within a downtrend and features a narrowing price range trending upward. When price breaks above the upper resistance line, it suggests the bearish trend might end and an upward move could begin.
This scenario is generally less reliable than a bearish reversal because the pattern runs counter to the dominant trend and requires strong buyer momentum for a successful reversal. Traders should seek additional confirmation—such as increased volume on the breakout and support from other technical indicators.
Bearish Reversal
The bearish reversal is the most common and reliable type of ascending wedge. It develops after extended price rallies, as the market shows signs of fading bullish momentum. Price action slows, forming a narrower range between converging upward trendlines.
When price breaks below the lower support trendline, it’s a strong signal of a possible trend reversal and the start of a decline. Psychologically, this reflects buyers losing control and sellers taking over. The support break is usually accompanied by a surge in trading volume, confirming the significance of the reversal.
Identifying the Ascending Wedge Pattern
Choosing Timeframes: Ascending wedges can be spotted on any timeframe—from minute charts to weekly or monthly. The chosen interval should match the trader’s style and goals. Patterns on daily, weekly, or monthly charts typically yield more reliable signals and greater move potential. Short-term traders may use hourly or four-hour charts but must account for increased market noise.
Support and Resistance Levels: To build the pattern accurately, identify at least two consecutive higher lows for the support line and two consecutive lower highs for the resistance line. Price should consistently trade between these converging trendlines, creating the classic wedge shape. The more points of contact, the stronger the pattern’s reliability.
Pattern Confirmation: Before trading based on the ascending wedge, seek confirming signals—such as volume analysis (declining within the pattern, rising on breakout), alignment with other technical tools (momentum indicators, oscillators), and consideration of overall market context and fundamentals.
Trading the Ascending Wedge Pattern
Wedge Breakout: An aggressive trading strategy involves opening a position as price breaks through one wedge boundary. In a bearish scenario, traders short when price breaks below the lower support line with increased volume. In a bullish scenario, they go long on a breakout above the upper resistance line. This strategy enables early entry but carries a higher risk of false breakouts.
Pullback: A more conservative approach requires patience but offers a better risk-reward ratio. After the initial breakout, traders wait for price to retest the broken trendline, which now switches role (support becomes resistance or vice versa). Entry is triggered by confirmation of a bounce from this level, reducing the risk of false breakouts and allowing for a tighter stop-loss.
Exit Strategies
Profit Target: Projected target is calculated by measuring the wedge’s maximum height (usually at pattern inception) and projecting that distance from the breakout point in the expected direction. For example, if the wedge’s height is 100 points and the breakout occurs at 1000, the bearish target is 900. Traders may partially close positions at intermediate levels to secure profits.
Stop-Loss: Placing a protective stop order is essential for risk management. For a bearish reversal, set the stop-loss several points above the broken support or last high inside the wedge. For a bullish scenario, place the stop below the broken resistance. As price moves favorably, move the stop to breakeven or use a trailing stop to maximize gains.
Risk Management
Effective risk management is the foundation of successful ascending wedge trading:
Position Sizing: Calculate position size so that the risk per trade is within 1–2% of account equity. This ensures survival through a series of losses without critical damage.
Stop-Loss Placement: The protective order should be set at a logical level based on the pattern’s structure—not at an arbitrary distance. This limits losses if the setup fails.
Risk-Reward Ratio: Only enter trades where the potential profit is at least double the risk (minimum 1:2 ratio). This supports positive expectancy in your trading system.
Diversification: Don’t depend solely on one pattern. Using a variety of strategies and tools reduces overall portfolio risk.
Emotional Control: A well-defined plan with strict entry, exit, and position management rules helps avoid impulsive, emotion-driven decisions.
Continuous Learning: Regularly review your trades, learn from both wins and losses, and adapt strategies to changing markets to continually improve your skills.
Comparing Ascending Wedge to Other Patterns
Descending Wedge: This formation is the mirror opposite of the ascending wedge, with price moving between two downward-sloping, converging trendlines. Whereas ascending wedges usually signal bearish reversals, descending wedges are considered bullish, indicating potential upward reversals or trend continuations.
Symmetrical Triangle: This pattern forms as price fluctuates between converging trendlines—one rising, one falling. Unlike the ascending wedge, the symmetrical triangle has no clear bullish or bearish bias, and breakouts may occur in either direction. Traders should wait for breakout confirmation before entering trades.
Ascending Channel: This bullish trend continuation pattern features parallel upward-sloping support and resistance lines. Unlike wedges, channel lines remain parallel, signaling a steady uptrend without signs of weakening.
Common Mistakes to Avoid
Trading Without Confirmation: Opening a position without clear confirmation is a frequent error. Premature entry can result in being caught by a false breakout. Always wait for confirmation, such as a candle closing outside the wedge boundary with increased volume.
Ignoring Market Context: Analyzing the pattern in isolation can lead to wrong conclusions. Consider the broader trend, key support and resistance levels, and relevant fundamentals.
Poor Risk Management: Failing to use stop-losses, taking oversized positions, or using poor risk-reward ratios can cause significant losses—even with correct pattern identification.
Overreliance on One Pattern: Using only the ascending wedge—without combining it with other technical tools—reduces signal reliability. A comprehensive approach with indicators, volume analysis, and other patterns boosts your odds of success.
Impatience: Rushing into trades before the pattern forms or skipping confirmation often leads to losses. Discipline and patience are essential qualities for successful traders.
Lack of a Trading Plan: Trading without a clear plan—including entry criteria, stop-loss, and take-profit levels—turns trading into gambling. Plan every trade in advance.
Tips for Successful Ascending Wedge Trading
Practice on a Demo Account: Before risking real capital, practice pattern identification and trading on a demo account. Gain experience and test strategies risk-free.
Discipline and Consistency: Rigorously follow your trading plan and avoid impulsive, emotion-driven decisions. Consistency with a proven strategy is key to lasting success.
Continuous Learning: Financial markets evolve, and successful traders never stop learning. Regularly review your trades, study new techniques, adapt your strategies to changing conditions, and stay up to date with technical analysis advancements.
Maintain a Trading Journal: Document every trade, including reasons for entry, outcomes, and lessons learned. This helps you identify strengths and weaknesses and supports ongoing skill development.
FAQ
What Is an Ascending Wedge and What Are Its Main Characteristics?
An ascending wedge is a bearish chart pattern where both highs and lows rise, but price swings narrow over time. It typically signals a pending downward reversal and a break below the lower support line, followed by a drop in price.
How Do You Properly Identify an Ascending Wedge Pattern on a Chart? What Are the Required Conditions?
An ascending wedge forms as price rises with diminishing momentum. Two trendlines converge, forming a narrowing channel within an uptrend. Confirmation requires analyzing trading volume and a break below the lower support line to complete the pattern.
What Price Movement Does an Ascending Wedge Typically Predict? Is It Bullish or Bearish?
Most of the time, the ascending wedge acts as a bearish pattern, signaling a price drop. However, if price breaks the resistance line, an upward reversal is possible. Overall, it’s considered a bearish signal by the market.
How Should You Set Entry, Stop-Loss, and Take-Profit Points When Trading an Ascending Wedge?
Entry—above the wedge’s resistance line. Stop-loss—below the support line. Take-profit—the wedge’s height projected downward from the entry point.
Ascending Wedge vs Ascending Triangle: What’s the Difference and How Do the Trading Strategies Differ?
The ascending wedge is a bearish pattern signaling a price decline; the ascending triangle is bullish, pointing to a rally. For the wedge, use a sell strategy; for the triangle, buy on a breakout above the resistance line.
How Reliable Is the Ascending Wedge Pattern? What Is Its Approximate Success Rate?
The ascending wedge shows 81% reliability in bullish markets with an average potential gain of +38%. It is highly reliable for identifying trend reversals and ranks as one of the most proven technical analysis patterns.
What Should You Watch for When Trading Ascending Wedges on Different Timeframes (Daily, 4-hour, 1-hour)?
Monitor trading volume and confirm with RSI and MACD indicators. Key signals: bearish divergence and trendline breakout. Use multi-timeframe analysis to boost strategy accuracy.
How Can You Combine Other Technical Indicators to Confirm Ascending Wedge Trading Signals?
Combine ascending wedge signals with moving averages and RSI for confirmation. Check for divergence and support levels. Multiple indicators reduce false signals and improve trade entry precision.
* The information is not intended to be and does not constitute financial advice or any other recommendation of any sort offered or endorsed by Gate.