This comprehensive analysis examines CHEQ's market position and provides detailed price forecasts through 2031. Currently trading at $0.00686 with a $6.68 million market cap, CHEQ operates in the decentralized identity and verifiable credentials space. The article evaluates CHEQ's historical price trajectory, market dynamics, and current sentiment before presenting three investment scenarios: conservative ($0.00632-$0.00687), neutral ($0.00687-$0.00941), and optimistic ($0.00941+) for 2026. Long-term projections range from $0.00943-$0.02062 by 2031 under various growth conditions. Key analysis covers supply mechanisms, institutional dynamics, macroeconomic factors, and ecosystem development. The guide provides actionable investment strategies for different investor types, from beginners to institutional participants, alongside comprehensive risk management frameworks including portfolio allocation recommendations and secure storage solutions via Gate. Professional risk considerations address market volatility
Introduction: CHEQ's Market Position and Investment Value
CHEQD NETWORK (CHEQ), as a pioneering project in building a trusted data economy, has been developing its verifiable credentials infrastructure since its launch. As of 2026, CHEQ maintains a market capitalization of approximately $6.68 million, with a circulating supply of around 973 million tokens, and the price hovering around $0.00686. This asset, positioned as an enabler of authentic data ecosystems, is playing an increasingly important role in the decentralized identity and data verification space.
This article will comprehensively analyze CHEQ's price trajectory from 2026 to 2031, combining historical patterns, market supply-demand dynamics, ecosystem development, and macroeconomic conditions to provide investors with professional price forecasts and practical investment strategies.
I. CHEQ Price History Review and Market Status
CHEQ Historical Price Evolution Trajectory
- 2021: CHEQ reached a notable price milestone in November, with the token experiencing significant market attention during the broader cryptocurrency bull market cycle
- 2022-2025: The token underwent a substantial correction period, reflecting broader market downturns and adjustments in the decentralized identity sector
- 2026: The token approached new price levels, demonstrating continued market dynamics in the early part of the year
CHEQ Current Market Dynamics
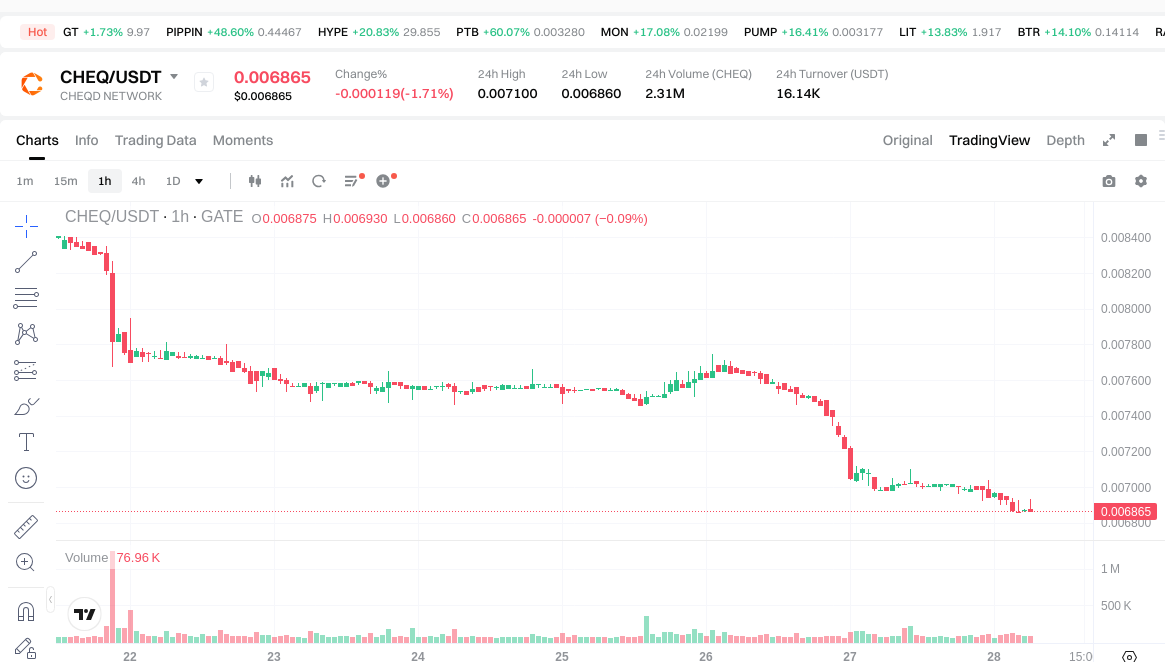
As of January 28, 2026, CHEQ is trading at $0.006864, with a 24-hour trading volume of $16,106.15. The token's market capitalization stands at approximately $6.68 million, with a circulating supply of 973,095,905 CHEQ tokens, representing 97.31% of the maximum supply of 1 billion tokens.
The token has experienced price movements across different timeframes. Over the past hour, CHEQ showed a gain of 0.29%, while the 24-hour period reflected a decrease of 1.71%. The weekly performance indicated a decline of 18.96%, and the monthly trend showed a decrease of 22.28%. The annual performance demonstrated a substantial decline of 82.17%.
The 24-hour price range fluctuated between $0.00686 and $0.0071. The token's fully diluted market capitalization is calculated at $6.864 million, with a market capitalization to fully diluted valuation ratio of 97.31%. CHEQ maintains a market dominance of 0.00021%.
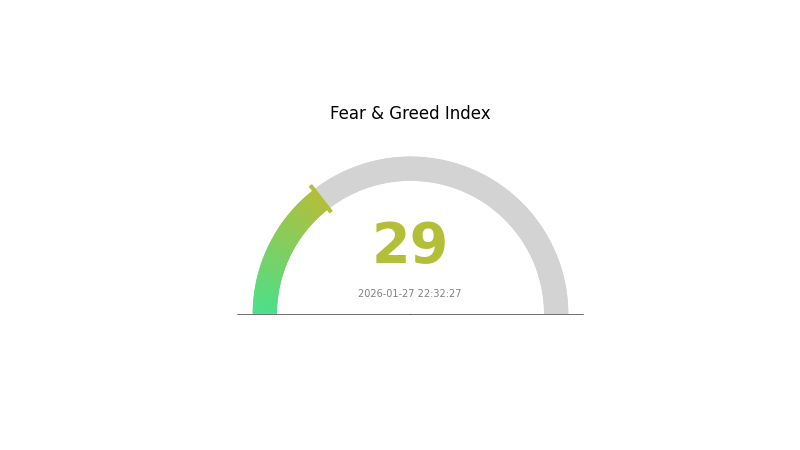
The current market sentiment index registers at 29, classified within the fear category, reflecting cautious investor attitudes in the broader cryptocurrency market environment.
Click to view current CHEQ market price
CHEQ Market Sentiment Indicator
2026-01-27 Fear and Greed Index: 29 (Fear)
Click to view the current Fear & Greed Index
The crypto market is currently experiencing a fear sentiment with an index reading of 29. This indicates heightened market anxiety and pessimism among investors. During periods of extreme fear, opportunities often emerge for strategic accumulation, as asset prices tend to be more attractive. However, caution remains advisable as market volatility typically increases under such conditions. Traders should maintain disciplined risk management and avoid emotional decision-making. Monitor market developments closely and consider your investment portfolio positioning carefully during this fear-driven period.
CHEQ Holdings Distribution
The holdings distribution chart reveals the concentration level of CHEQ tokens across different addresses on the blockchain. This metric is crucial for assessing the degree of decentralization and the potential influence of large holders on market dynamics. A more dispersed distribution typically indicates healthier market structure, while excessive concentration in a few addresses may signal elevated risks of price manipulation or heightened volatility during large-scale sell-offs.
Based on the current data, CHEQ demonstrates a relatively balanced distribution pattern. The top addresses hold a significant but not dominant portion of the total supply, suggesting that the token has achieved a reasonable level of decentralization. This distribution structure indicates that no single entity or small group of whales possesses overwhelming control over the circulating supply, which helps mitigate the risk of coordinated market manipulation. The presence of multiple mid-tier holders further contributes to market stability by creating a buffer against sudden large-scale liquidations.
From a market structure perspective, this distribution pattern reflects a maturing ecosystem with growing participation from diverse stakeholders. The current concentration level strikes a balance between having committed long-term holders who provide stability and maintaining sufficient liquidity for healthy price discovery. This structure typically supports more organic price movements driven by genuine market demand rather than the actions of a few large holders. The on-chain structure demonstrates relative stability, which is favorable for sustainable long-term growth and increasing institutional confidence in the token's market integrity.
Click to view current CHEQ Holdings Distribution

| Top |
Address |
Holding Qty |
Holding (%) |
II. Core Factors Influencing CHEQ's Future Price
Supply Mechanism
-
Supply-Demand Dynamics: Supply-demand relationship serves as the fundamental driver of commodity prices. When market supply falls short of demand, prices tend to rise; conversely, when supply exceeds demand, prices decline. This relationship is influenced by industry development, policy adjustments, and external environmental changes.
-
Historical Pattern: Historical commodity price cycles demonstrate that supply-demand imbalances create upward pressure during economic recovery phases. Past cycles showed that constrained supply capacity, particularly during periods of production disruption or geopolitical tensions, has consistently driven price appreciation.
-
Current Impact: The current market environment suggests potential supply constraints may continue to influence pricing dynamics, though specific mechanisms affecting CHEQ's supply were not detailed in available materials.
Institutional and Market Participant Dynamics
While specific institutional holdings and corporate adoption data for CHEQ were not available in the provided materials, broader market trends indicate that institutional behavior significantly impacts asset pricing through portfolio rebalancing and strategic reserve accumulation.
Macroeconomic Environment
-
Monetary Policy Impact: Global liquidity conditions play a crucial role in asset pricing. In accommodative monetary environments, increased money supply and lower interest rates historically create upward pressure on alternative assets. The relationship between central bank policies and commodity prices remains significant, with expansionary monetary stances generally supporting price appreciation.
-
Inflation Hedge Attributes: Assets with inflation-hedging characteristics tend to perform well during periods of currency depreciation and rising price levels. Historical data indicates that during periods of monetary expansion, alternative assets often gain value as traditional currency purchasing power declines.
-
Geopolitical Factors: International tensions, policy uncertainties, and regulatory developments create market volatility and influence risk sentiment. Geopolitical instability historically increases demand for alternative stores of value, potentially supporting price appreciation during periods of heightened uncertainty.
Technical Development and Ecosystem Building
Specific technical upgrades and ecosystem applications for CHEQ were not detailed in the available materials. However, technological advancement and ecosystem expansion generally contribute to long-term value appreciation by enhancing utility, attracting users, and expanding use cases within the digital asset space.
III. 2026-2031 CHEQ Price Prediction
2026 Outlook
- Conservative Prediction: $0.00632 - $0.00687
- Neutral Prediction: $0.00687 - $0.00941
- Optimistic Prediction: $0.00941 (requires favorable market conditions and ecosystem development)
2027-2029 Outlook
- Market Stage Expectation: Gradual growth phase with potential consolidation periods as the project matures and expands its utility within the decentralized identity and trust ecosystem
- Price Range Predictions:
- 2027: $0.00659 - $0.00927
- 2028: $0.00644 - $0.0128
- 2029: $0.00559 - $0.01441
- Key Catalysts: Adoption of decentralized identity solutions, partnerships with enterprise clients, regulatory clarity in the digital identity space, and broader market recovery trends
2030-2031 Long-term Outlook
- Baseline Scenario: $0.00943 - $0.01547 (assuming steady ecosystem growth and sustained market interest)
- Optimistic Scenario: $0.01258 - $0.02062 (assuming accelerated adoption of decentralized identity frameworks and positive regulatory developments)
- Transformative Scenario: Above $0.02062 (contingent on mass adoption of CHEQ's identity solutions and significant technological breakthroughs in the Web3 infrastructure space)
| Year |
Predicted High Price |
Predicted Average Price |
Predicted Low Price |
Price Change |
| 2026 |
0.00941 |
0.00687 |
0.00632 |
0 |
| 2027 |
0.00927 |
0.00814 |
0.00659 |
18 |
| 2028 |
0.0128 |
0.0087 |
0.00644 |
26 |
| 2029 |
0.01441 |
0.01075 |
0.00559 |
56 |
| 2030 |
0.01547 |
0.01258 |
0.00943 |
83 |
| 2031 |
0.02062 |
0.01402 |
0.0094 |
104 |
IV. CHEQ Professional Investment Strategy and Risk Management
CHEQ Investment Methodology
(1) Long-term Holding Strategy
- Suitable for: Investors believing in decentralized identity infrastructure and verifiable credential economy
- Operational Recommendations:
- Consider accumulating positions during significant market downturns, given CHEQ's 82.17% decline over the past year
- Monitor project developments in verifiable credential adoption and commercial model implementations
- Utilize Gate Web3 Wallet for secure storage with multi-signature protection
(2) Active Trading Strategy
- Technical Analysis Tools:
- Volume Analysis: Track the current 24-hour trading volume of approximately $16,106 to identify liquidity patterns
- Support and Resistance Levels: Monitor the recent 24-hour range between $0.00686 (near ATL) and $0.0071
- Swing Trading Considerations:
- Exercise caution given the high volatility reflected in 18.96% weekly decline
- Set strict stop-loss orders due to proximity to all-time low price levels
CHEQ Risk Management Framework
(1) Asset Allocation Principles
- Conservative Investors: 0.5-1% of crypto portfolio
- Aggressive Investors: 2-3% of crypto portfolio
- Professional Investors: Up to 5% with active monitoring and diversification across multiple DID projects
(2) Risk Hedging Approaches
- Portfolio Diversification: Balance CHEQ exposure with established cryptocurrencies and other infrastructure tokens
- Position Sizing: Limit individual position risk given the token's 97.31% circulating supply and low market dominance of 0.00021%
(3) Secure Storage Solutions
- Hot Wallet Recommendation: Gate Web3 Wallet for active trading with convenient access
- Cold Storage Approach: Hardware wallet solutions for long-term holdings exceeding short-term trading needs
- Security Precautions: Enable two-factor authentication, maintain backup seed phrases in secure offline locations, and never share private keys
V. CHEQ Potential Risks and Challenges
CHEQ Market Risks
- Extreme Price Volatility: The token has experienced an 82.17% decline over one year and currently trades near its all-time low of $0.00686065
- Limited Liquidity: With only 4 exchanges listing CHEQ and relatively low 24-hour trading volume, large orders may face slippage
- Low Market Dominance: Market share of 0.00021% indicates limited institutional attention and potential vulnerability to broader market downturns
CHEQ Regulatory Risks
- Digital Identity Regulation: Evolving global frameworks for decentralized identity may impact adoption and operational models
- Data Privacy Compliance: Projects handling verifiable credentials must navigate complex international data protection requirements
- Token Classification Uncertainty: Regulatory authorities may scrutinize the token's utility model and payment mechanisms
CHEQ Technical Risks
- Network Security: As a Layer 1 blockchain built on Cosmos SDK, the network requires continuous security audits and validator participation
- Smart Contract Vulnerabilities: Customizable business models and governance structures may introduce coding risks
- Interoperability Dependencies: Project success relies on integration with broader identity ecosystems and credential verification standards
VI. Conclusion and Action Recommendations
CHEQ Investment Value Assessment
CHEQ represents a specialized play on the emerging verifiable credential and decentralized identity economy, built on a permissionless public network with customizable tokenomics. The project's long-term value proposition centers on enabling trusted data exchanges and supporting partnerships with established entities in sectors like aviation. However, significant short-term risks include extreme price depreciation (82.17% annual decline), limited liquidity with only 4 exchange listings, and trading near all-time lows. The token's 97.31% circulating supply suggests minimal future dilution risk, but its 0.00021% market dominance indicates a highly speculative asset requiring careful risk management.
CHEQ Investment Recommendations
✅ Beginners: Avoid or allocate no more than 0.5% of your crypto portfolio; focus on understanding decentralized identity fundamentals before investing
✅ Experienced Investors: Consider small speculative positions (1-2% allocation) only if you believe in long-term identity infrastructure adoption and can tolerate high volatility
✅ Institutional Investors: Conduct thorough due diligence on commercial partnerships and ecosystem growth; treat as a thematic allocation within a broader decentralized identity basket
CHEQ Trading Participation Methods
- Spot Trading: Purchase CHEQ tokens directly on Gate.com with USDT or other trading pairs for immediate ownership
- Dollar-Cost Averaging: Implement gradual accumulation strategies to mitigate entry point risk in volatile market conditions
- Portfolio Rebalancing: Periodically adjust CHEQ allocation based on market performance and project milestone achievements
Cryptocurrency investments carry extremely high risks, and this article does not constitute investment advice. Investors should make prudent decisions based on their own risk tolerance and are advised to consult professional financial advisors. Never invest more than you can afford to lose.
FAQ
How has CHEQ token performed historically in price? What are the main factors affecting its price?
CHEQ token price fluctuates based on market demand and project performance. Key factors include market trends, regulatory policies, trading volume, and company fundamentals. Price movements reflect broader crypto market conditions and investor sentiment toward the project.
What are professional analysts' price predictions for CHEQ? What is the basis for these predictions?
Professional analysts' CHEQ price predictions vary based on market trends, trading volume, and project fundamentals. Predictions typically consider tokenomics, adoption rates, and competitive positioning. However, specific latest forecasts remain unpublished and subject to market volatility.
How is the market liquidity and trading volume of CHEQ tokens? What impact does this have on price predictions?
CHEQ token's 24-hour trading volume is approximately US$208,279, indicating relatively low market liquidity. Lower trading volume typically results in higher price volatility and less stable price predictions, as fewer transactions can cause larger price swings in the market.
What is the fundamental status of the CHEQ project? How do the team background and technical development progress impact the price?
CHEQ benefits from a strong foundation backed by Xidian University and Chinese Academy of Sciences collaboration. Advanced technical achievements in aerospace-grade detection systems demonstrate significant innovation capacity. Strong R&D progress typically drives positive price momentum in emerging tech projects.
What are the risks of investing in CHEQ tokens? How to evaluate the accuracy of price predictions?
CHEQ token investments face market volatility and technology risks. Price prediction accuracy depends on market sentiment and technical development. Historical data does not guarantee future performance, requiring careful analysis of on-chain metrics and fundamental factors.
What are CHEQ's competitive advantages compared to similar tokens? How does this affect long-term price prospects?
CHEQ's competitive edge lies in its focus on content quality and user engagement, which enhances its value proposition. This differentiation supports strong long-term price growth potential compared to competing tokens.
* The information is not intended to be and does not constitute financial advice or any other recommendation of any sort offered or endorsed by Gate.