
#ETHMarketAnalysis
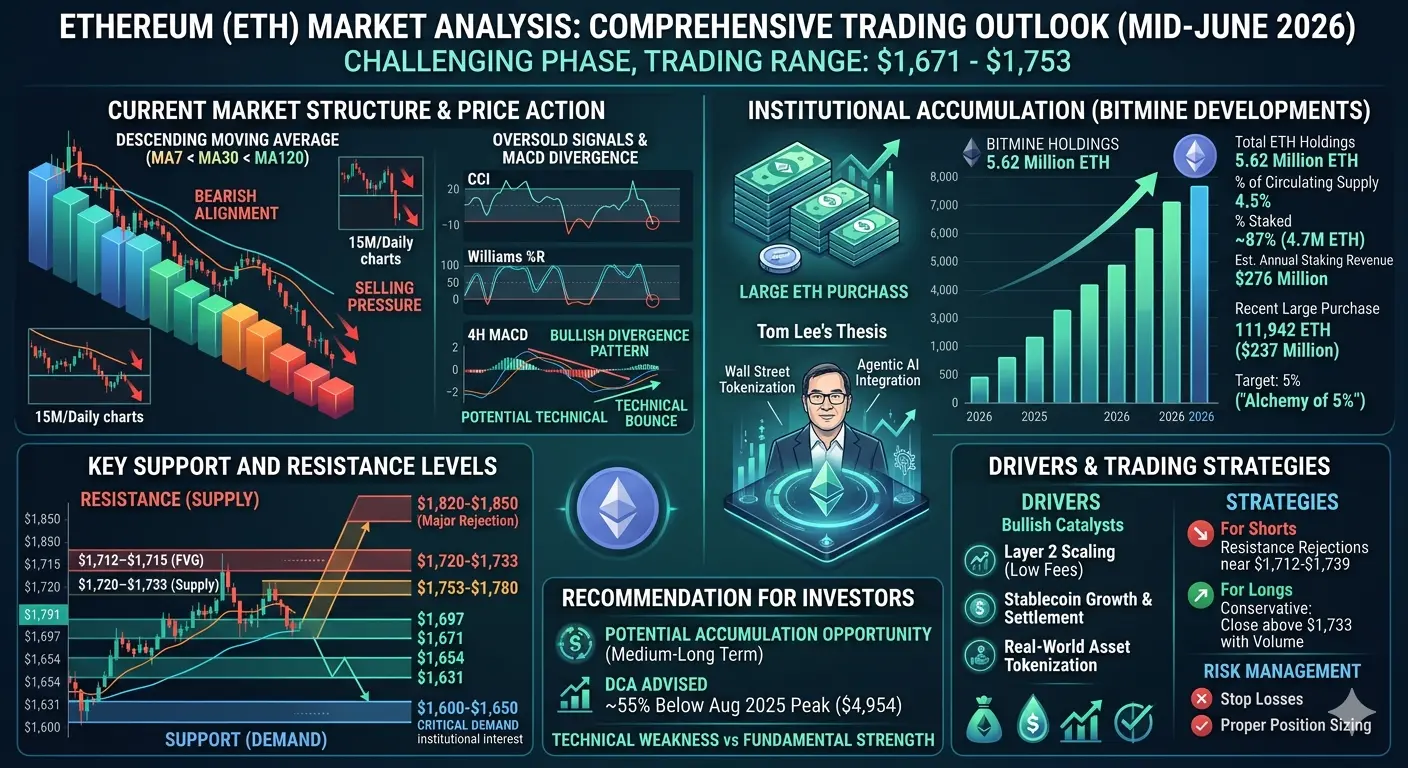
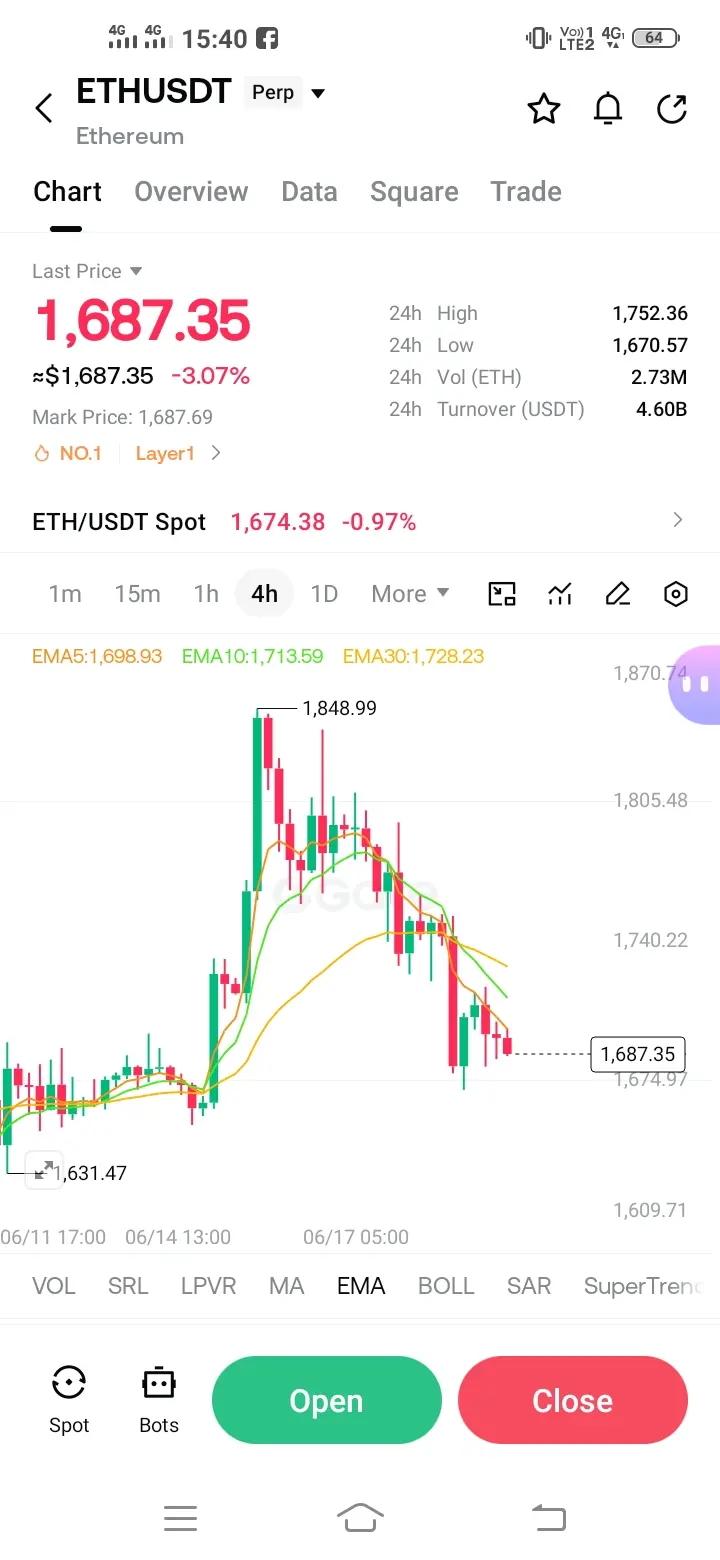
Ethereum is currently navigating through a challenging phase in mid-June 2026, trading in the range of approximately 1671 to 1753 dollars after experiencing a decline of around 3 percent over the past 24 hours. The market sentiment among traders remains predominantly cautious with a bearish bias dominating the lower timeframes. This analysis aims to provide investors with a detailed examination of the current market conditions, key technical levels, institutional developments, and strategic considerations for potential trading opportunities.
Current Market Structure and Price Action
The Ethereum market structure has shifted into a bearish alignment across multiple timeframes. On the 15-minute and daily charts, the moving averages are positioned in a descending order with MA7 below MA30 and MA30 below MA120, which signals sustained selling pressure. The price action has broken below several critical support zones that previously held firm, indicating that sellers are currently in control of the market momentum. Volume analysis reveals significantly increased trading activity during the recent decline, which is characteristic of panic selling behavior where long positions are being liquidated and weak hands are exiting the market.
Despite the bearish structure, technical indicators such as the Commodity Channel Index and Williams Percent Range are currently showing oversold conditions. This divergence between price action and momentum indicators suggests that the selling pressure may be reaching exhaustion levels. Furthermore, the 4-hour MACD is forming a bullish divergence pattern, which historically precedes short-term relief rallies or trend reversals. These oversold signals combined with divergence patterns indicate that a technical bounce could materialize in the near term, though the broader trend remains tilted to the downside until proven otherwise.
Key Support and Resistance Levels
Understanding critical price zones is essential for effective risk management and trade planning. The immediate support levels for Ethereum are clustered around 1697 dollars and 1671 dollars, with deeper support found at 1654 dollars and 1631 dollars. The most significant long-term support zone lies between 1650 and 1600 dollars, representing a critical demand area where institutional buyers have historically shown interest. A decisive break below this zone could open the path toward 1500 dollars or lower.
On the resistance side, the first major hurdle is located between 1712 and 1715 dollars, which coincides with a fair value gap from previous price action. The next resistance cluster spans from 1720 to 1733 dollars, representing recent equilibrium levels where supply has previously overwhelmed demand. Stronger resistance is found between 1753 and 1780 dollars, with the major rejection zone from recent highs situated at 1820 to 1850 dollars. For a genuine bullish reversal to occur, Ethereum would need to establish a decisive close above 1733 dollars with strong volume confirmation, which would shift the target range toward 1820 dollars and potentially higher.
Institutional Accumulation and Bitmine Developments
One of the most significant developments in the Ethereum ecosystem is the aggressive accumulation strategy being executed by Bitmine Immersion Technologies, a company led by renowned market strategist Tom Lee. Bitmine has emerged as the largest corporate Ethereum holder globally, now controlling approximately 5.62 million ETH tokens, which represents roughly 4.5 percent of Ethereum's total circulating supply. This positions Bitmine as the second-largest crypto treasury after Strategy's Bitcoin holdings.
Bitmine's accumulation strategy has been remarkably consistent throughout 2026, with the company purchasing over 1 million ETH since the beginning of the year. Their most recent major acquisition involved approximately 111,942 ETH valued at around 237 million dollars, representing their largest single purchase of 2026. The company has stated that their internal target is to reach 5 percent of Ethereum's total supply, a milestone they refer to as the "Alchemy of 5 percent." At current holdings, they are approximately 90 percent of the way toward achieving this ambitious goal.
What makes Bitmine's strategy particularly noteworthy is that over 4.7 million of their ETH holdings are currently staked, representing approximately 87 percent of their total position. This staking activity generates an estimated annualized revenue of 276 million dollars for the company, demonstrating a long-term conviction in Ethereum's utility as a yield-generating asset. Tom Lee has publicly described recent Ethereum pullbacks as "attractive opportunities" and maintains his thesis that Ethereum is currently in the "early stages of crypto spring." His outlook is driven by two primary catalysts: Wall Street tokenization and the integration of agentic artificial intelligence on the Ethereum network.
Factors Driving Ethereum Price Appreciation
Several fundamental catalysts are positioned to potentially drive Ethereum's price higher in the coming months. The Ethereum network continues to undergo significant structural improvements through its Layer 2 scaling solutions, which have substantially reduced transaction costs and increased network capacity. These upgrades are attracting institutional interest as they make Ethereum more viable for enterprise applications and large-scale financial operations.
The growth of stablecoins on Ethereum remains a critical demand driver, with the network serving as the primary settlement layer for the majority of dollar-denominated digital assets. As traditional finance continues to explore blockchain integration, Ethereum's position as the leading smart contract platform provides it with a significant competitive advantage. The ongoing development of real-world asset tokenization is expected to bring trillions of dollars of traditional assets onto blockchain networks, with Ethereum positioned to capture a substantial portion of this migration.
Exchange-traded fund flows represent another important variable for Ethereum's price trajectory. While recent weeks have seen some outflows from ETH ETFs, the broader trend of institutional adoption through regulated investment vehicles continues to expand. Major financial institutions including Bank of America have disclosed significant indirect exposure to Ethereum through ETF holdings and investments in crypto-related companies, signaling growing mainstream acceptance.
Trading Strategies and Risk Management
For traders considering Ethereum positions at current levels, several strategic approaches warrant consideration. The bearish bias on lower timeframes suggests that short-term traders should focus on resistance rejections and breakdowns for short entries. Potential short setups would involve waiting for price to retest the 1712 to 1739 dollar resistance zone with bearish reversal candlestick patterns such as rejection wicks or bearish engulfing formations. Downside targets would cascade toward 1697 dollars, then 1671 dollars, followed by 1654 dollars and 1631 dollars, with a potential extension toward 1603 dollars if momentum accelerates.
For those considering long positions, the oversold technical indicators present a potential mean reversion opportunity, though caution is warranted given the broader bearish structure. A more conservative long entry would require a decisive close above 1733 dollars with strong volume, which would shift the bias toward upside targets at 1820 to 1850 dollars. Risk management remains paramount, with stop losses recommended above recent swing highs for short positions and below key support levels for long positions.
Recommendation for Investors
For investors with a medium to long-term horizon, the current price levels present a potentially attractive accumulation opportunity, particularly in light of institutional buying activity from entities like Bitmine. The fundamental case for Ethereum remains robust, with network upgrades, institutional adoption, and the expanding ecosystem of decentralized applications providing underlying value support.
Investors considering dollar-cost averaging into Ethereum positions may find the current discount from all-time highs compelling. The price is currently trading approximately 55 percent below its August 2025 peak of nearly 4954 dollars, which may represent a favorable risk-reward profile for patient capital. However, it is essential to maintain proper position sizing and only allocate capital that can withstand potential further downside volatility.
The staking opportunity on Ethereum continues to offer attractive yields for holders willing to lock up their assets, with current annual percentage rates providing passive income alongside potential price appreciation. This yield component distinguishes Ethereum from many other digital assets and aligns with the strategies being employed by sophisticated institutional investors.
Conclusion
Ethereum finds itself at a critical juncture where technical weakness is meeting fundamental strength. The bearish price structure and oversold conditions suggest that near-term volatility is likely to persist, with the potential for both further downside and sharp relief rallies. Key support levels between 1650 and 1600 dollars will be critical to monitor, as a break below this zone could accelerate selling pressure. Conversely, a reclaim of 1733 dollars would signal a potential trend reversal.
The institutional accumulation by Bitmine and other corporate entities provides a compelling counter-narrative to the current price weakness. Their continued buying during pullbacks suggests that smart money views current levels as attractive entry points for long-term positioning. Combined with the ongoing network developments and expanding use cases, the foundation for Ethereum's next major move higher appears to be building, even if the timing remains uncertain.
Investors and traders should remain disciplined in their approach, utilizing the identified support and resistance levels for trade planning while maintaining appropriate risk management protocols. The market is likely to remain volatile in the near term, but the confluence of oversold technical conditions and strong institutional demand creates an environment where patient and prepared participants may find favorable opportunities.
@Gate_Square #MyGateTradeStory #STRC跌破面值11%創上市新低