Le MACD (Moving Average Convergence Divergence, soit Convergence/Divergence des Moyennes Mobiles) est apparu à une époque où les traders cherchaient des moyens plus structurés d'interpréter les graphiques de prix, sans se fier uniquement à leur jugement visuel. Au fil du temps, il est devenu un outil d'analyse standard, car il capture à la fois la direction d'une tendance et la force qui la sous-tend. Cette double perspective le rend particulièrement utile sur des marchés où les mouvements de prix sont continus, mais pas toujours évidents.
Plutôt que de se concentrer sur des points de prix isolés, le MACD présente le comportement des prix comme une interaction dynamique entre les variations à court terme et les tendances à plus long terme.
Qu'est-ce que le MACD ?
Le MACD est un indicateur de momentum suivant la tendance. Il mesure la différence entre deux moyennes mobiles exponentielles pour montrer comment l'évolution des prix se déroule dans le temps.
En termes simples, il indique si l'action récente des prix accélère plus ou moins rapidement que la tendance générale. Lorsque l'écart entre les deux moyennes s'élargit, le momentum augmente ; lorsqu'il se rétrécit, le momentum s'estompe.
Une façon utile de concevoir le MACD est de le voir comme un pont entre l'analyse de tendance et l'analyse de momentum, permettant d'observer les deux au sein d'un même cadre, plutôt que comme des outils séparés.
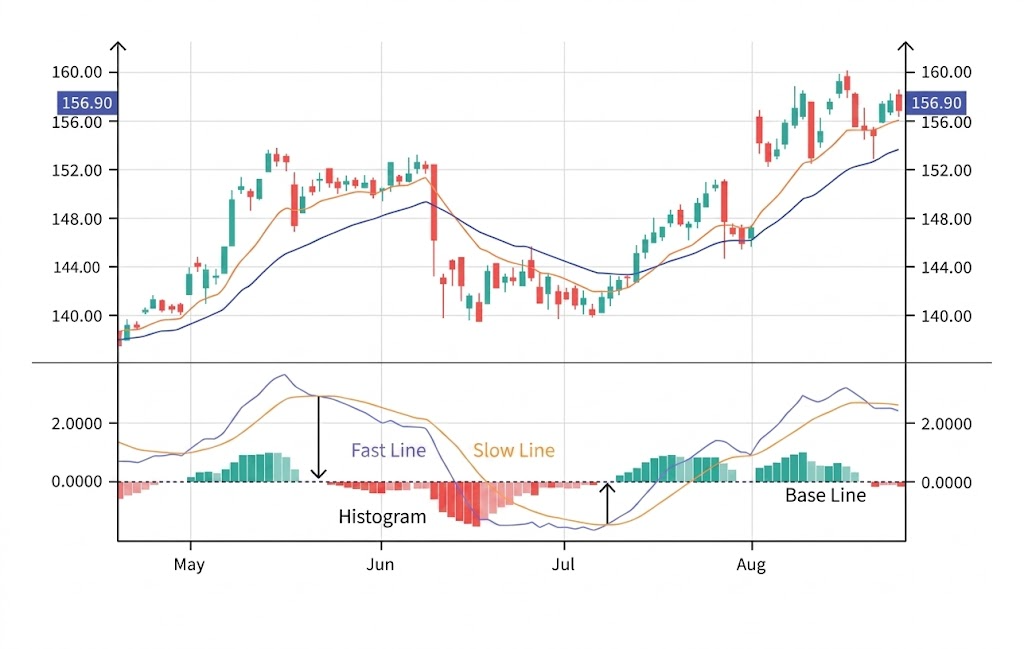
Le MACD repose sur trois composants qui travaillent ensemble pour traduire le mouvement des prix en une structure plus interprétable. Le premier composant, communément appelé la ligne MACD, est calculé en soustrayant une moyenne mobile exponentielle à long terme (généralement 26 périodes) d'une moyenne à court terme (généralement 12 périodes). Cette différence reflète la rapidité avec laquelle les prix récents évoluent par rapport à la tendance générale.
Le deuxième composant, la ligne de signal, applique un lissage supplémentaire en prenant une moyenne mobile exponentielle sur 9 périodes de la ligne MACD elle-même. Cela permet de filtrer les fluctuations mineures et de rendre les motifs sous-jacents plus faciles à reconnaître.
Le troisième élément, l'histogramme, représente la distance entre la ligne MACD et la ligne de signal. Lorsque les barres s'élargissent, cela suggère que le momentum se renforce ; lorsqu'elles se contractent, cela indique que le momentum perd de sa force. En pratique, l'histogramme fournit souvent le premier indice visuel d'un changement de conditions.
| Composant |
Base de calcul |
Rôle conceptuel |
| Ligne MACD |
12 EMA − 26 EMA |
Capture le changement de momentum |
| Ligne de signal |
9 EMA de la ligne MACD |
Lisse les fluctuations |
| Histogramme |
Différence entre les lignes |
Visualise l'intensité du momentum |
Lecture des croisements et des divergences du MACD
L'interprétation du MACD commence généralement par l'observation de l'interaction entre ses deux lignes. L'un des signaux les plus discutés est le croisement. Lorsque la ligne MACD passe au-dessus de la ligne de signal, cela reflète généralement un renforcement du momentum haussier. Lorsqu'elle passe en dessous, l'inverse se produit : le momentum peut s'affaiblir ou s'orienter à la baisse.
En pratique, ces croisements sont moins utiles pour identifier des points de retournement exacts que pour indiquer que les conditions sous-jacentes changent. Cette distinction est importante, car le prix ne s'inverse pas toujours immédiatement après l'apparition d'un signal.
La divergence offre une autre couche d'interprétation. Elle se produit lorsque le prix et le MACD commencent à évoluer dans des directions différentes. Par exemple, si les prix continuent d'augmenter tandis que l'indicateur commence à s'aplatir ou à baisser, cela suggère que le mouvement haussier perd de sa force. De même, lorsque les prix baissent mais que le MACD commence à monter, la pression baissière peut s'atténuer. Ces situations attirent souvent l'attention, car elles révèlent une tension interne au sein d'une tendance.
Le MACD dans les marchés en tendance vs les marchés de range
Le comportement du MACD devient beaucoup plus facile à interpréter une fois que l'environnement de marché plus large est pris en compte. Sur les marchés en tendance, où les prix évoluent de manière cohérente dans une direction, l'indicateur tend à produire des signaux qui s'alignent plus clairement sur le comportement réel des prix. Le momentum se construit de manière soutenue, et les lignes ainsi que l'histogramme reflètent cette continuité.
Cependant, cette clarté se dégrade souvent sur les marchés de range. Lorsque les prix évoluent de manière latérale sans direction définie, les signaux du MACD peuvent devenir fréquents mais moins significatifs. Les croisements peuvent se produire de manière répétée sans entraîner de mouvement soutenu, et l'histogramme peut fluctuer sans établir de motif clair.
Ce contraste souligne un point important : le MACD ne fonctionne pas en isolation. Son efficacité dépend fortement de la structure du marché auquel il est appliqué.
Le retard du signal du MACD et le bruit sur les marchés volatils
Le MACD est intrinsèquement un indicateur retardé, principalement parce qu'il est dérivé de moyennes mobiles plutôt que de variations de prix en temps réel. Cela signifie qu'au moment où un signal apparaît, une partie du mouvement des prix a déjà eu lieu. Bien que ce retard aide à réduire les fluctuations aléatoires, il peut également retarder la reconnaissance des changements rapides.
Dans des conditions plus volatiles, ce défi devient plus perceptible. Des fluctuations de prix brutales peuvent amener l'indicateur à réagir rapidement et de manière incohérente, produisant des signaux qui reflètent le bruit à court terme plutôt qu'un momentum soutenu. Dans de tels cas, l'interprétation du MACD nécessite une approche plus prudente, car tous les mouvements ne portent pas une information significative.
Limites du MACD
Bien que le MACD fournisse une manière structurée d'analyser le comportement des prix, il ne capture pas tous les aspects de la dynamique du marché. Sa dépendance aux données historiques signifie qu'il répond aux changements plutôt qu'il ne les anticipe. Cela peut limiter son utilité dans des environnements en évolution rapide où le timing est crucial.
Une autre limite apparaît sur les marchés latéraux, où des signaux répétés peuvent créer de la confusion plutôt que de la clarté. L'indicateur est également sensible à ses paramètres de réglage, ce qui signifie que différentes configurations peuvent conduire à des interprétations différentes des mêmes données de prix.
Enfin, le MACD se concentre exclusivement sur les informations basées sur les prix. Il ne tient pas compte des influences externes telles que le volume des transactions, les développements macroéconomiques ou les événements de marché inattendus. Pour cette raison, il est préférable de le considérer comme une perspective analytique parmi d'autres, plutôt que comme un cadre complet.
Conclusion
Le MACD peut être compris comme un outil qui traduit le mouvement des prix en une relation entre tendance et momentum. En comparant les moyennes à court et à long terme, il révèle si le momentum se construit, s'estompe ou diverge de la direction dominante.
Ce qui le rend particulièrement utile n'est pas seulement les signaux qu'il produit, mais la manière dont il présente le comportement des prix dans le temps. Au lieu de considérer le prix comme une série de mouvements isolés, le MACD le présente comme une structure en évolution façonnée par l'interaction entre différents horizons temporels. Dans un contexte analytique plus large, cette perspective aide à comprendre comment les tendances se développent et évoluent.
FAQ
Que signifie MACD ?
MACD signifie Moving Average Convergence Divergence (Convergence/Divergence des Moyennes Mobiles).
Le MACD est-il un indicateur avancé ou retardé ?
Il est considéré comme un indicateur retardé, car il est basé sur des données de prix passées.
Que montre l'histogramme ?
L'histogramme montre la différence entre la ligne MACD et la ligne de signal, indiquant les changements dans la force du momentum.
Pourquoi le MACD peut-il produire de faux signaux ?
Les faux signaux sont plus fréquents sur les marchés latéraux, où le prix manque de direction de tendance claire.
Quand le MACD est-il le plus efficace ?
Le MACD tend à être plus fiable sur les marchés en tendance, où le momentum se développe dans une direction cohérente.