*Data last updated: 2026-05-05 22:12 (UTC+8)
As of 2026-05-05 22:12, Grab Holdings Ltd (ADRs) (GRAB) is priced at $3,69, with a total market cap of $14,38B, a P/E ratio of 76,19, and a dividend yield of 0,00 %. Today, the stock price fluctuated between $3,59 and $3,87. The current price is 2,78 % above the day's low and 4,65 % below the day's high, with a trading volume of 68,59M. Over the past 52 weeks, GRAB has traded between $3,48 to $4,27, and the current price is -13,58 % away from the 52-week high.
GRAB Key Stats
About GRAB
Erfahren Sie mehr über Grab Holdings Ltd (ADRs) (GRAB)
Gate Learn Articles
Warum Crypto zu Fintech wird und Fintech zu Crypto wird
Der Artikel liefert eine gründliche Analyse der Nutzung von Blockchain-Technologie im Finanzbereich und veranschaulicht durch spezifische Praxisbeispiele, wie sich Kryptowährungen mit der klassischen Finanzwelt verbinden lassen, um Innovationen im Finanzsektor zu fördern.
2025-10-20
Warum Kryptowährungen zunehmend Teil des Fintech-Sektors werden und Fintech sich immer stärker mit Kryptowährungen verbindet
Der Artikel liefert eine umfassende Analyse des Einsatzes von Blockchain-Technologie im Finanzsektor und veranschaulicht anhand spezifischer Fallstudien, wie sich Kryptowährungen mit klassischen Finanzsystemen verbinden lassen, um Innovationen im Finanzbereich gezielt voranzubringen.
2025-10-20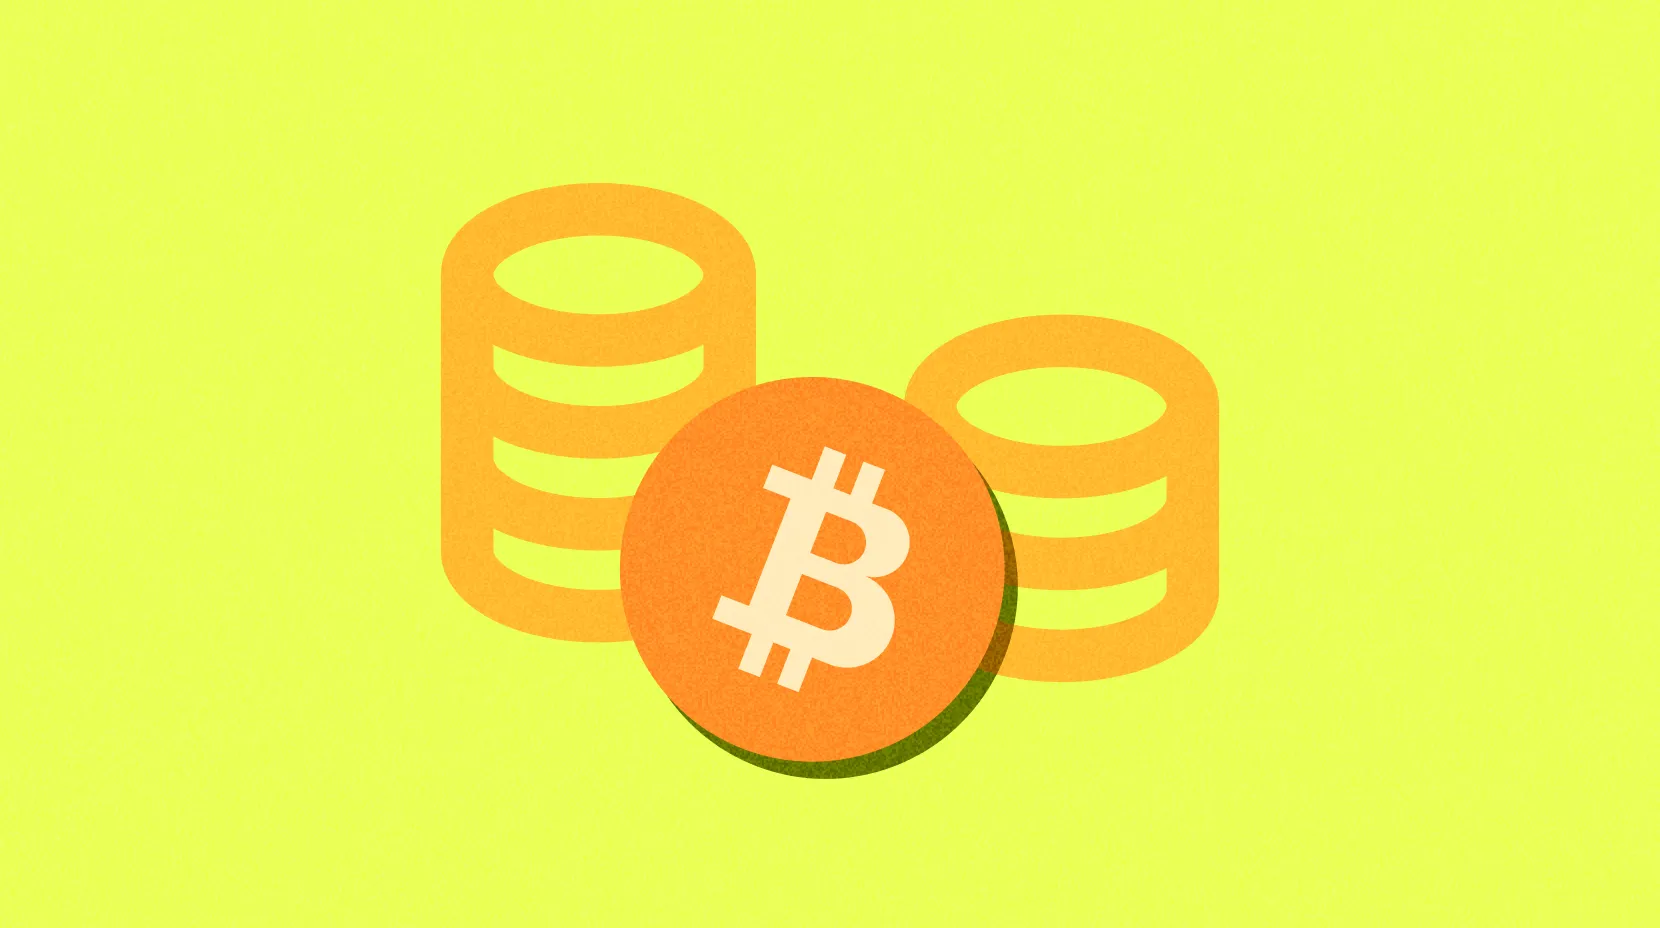
USDC und die Zukunft des Dollars
In diesem Artikel werden wir die einzigartigen Merkmale von USDC als Stablecoin-Produkt, seine derzeitige Annahme als Zahlungsmittel und die Regulierungslandschaft diskutieren, der sich USDC und andere digitale Vermögenswerte heute gegenübersehen, und was all dies für die digitale Zukunft des Dollars bedeutet.
2024-08-29

Grab Holdings Ltd (ADRs) (GRAB) FAQ
What's the stock price of Grab Holdings Ltd (ADRs) (GRAB) today?
What are the 52-week high and low prices for Grab Holdings Ltd (ADRs) (GRAB)?
What is the price-to-earnings (P/E) ratio of Grab Holdings Ltd (ADRs) (GRAB)? What does it indicate?
What is the market cap of Grab Holdings Ltd (ADRs) (GRAB)?
What is the most recent quarterly earnings per share (EPS) for Grab Holdings Ltd (ADRs) (GRAB)?
Should you buy or sell Grab Holdings Ltd (ADRs) (GRAB) now?
What factors can affect the stock price of Grab Holdings Ltd (ADRs) (GRAB)?
How to buy Grab Holdings Ltd (ADRs) (GRAB) stock?
Risk Warning
Disclaimer
Beliebte Beiträge zu Grab Holdings Ltd (ADRs) (GRAB)

AuroraStone