阿浩001
古希臘掌管波段的神,實盤不在這裡,《謹慎+萬千次小勝利+復盤》
阿浩001
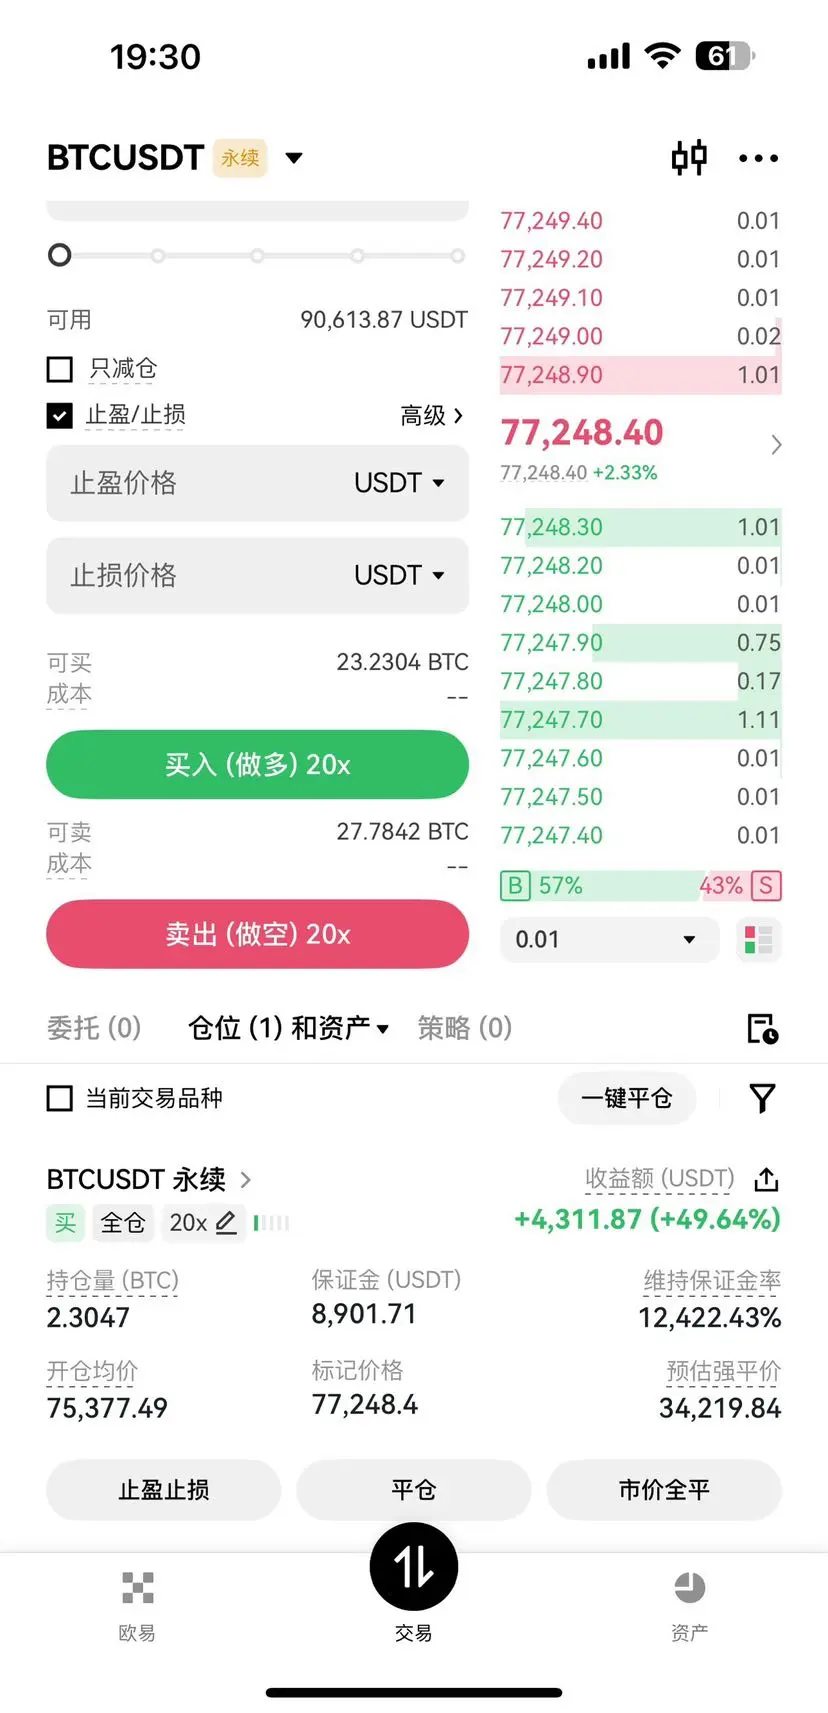
BTC6萬就是大底了,今天是2026/6/3,周線這裡有可能回踩六萬形成雙底,短期65000-64000我會開多博反彈,止損帶在62900,散戶又看3萬4萬了,我就知道機會來了,全在等3萬,4萬,賣房賣車抄底,如果回踩6萬,我會梭哈全部身家買入現貨,主力不可能讓散戶接到低價籌碼,我內心很笃定,行情企穩抓到主升浪之前,幣本位開多,下輪最低翻個2-3倍,這是一篇偉大的文章
查看原文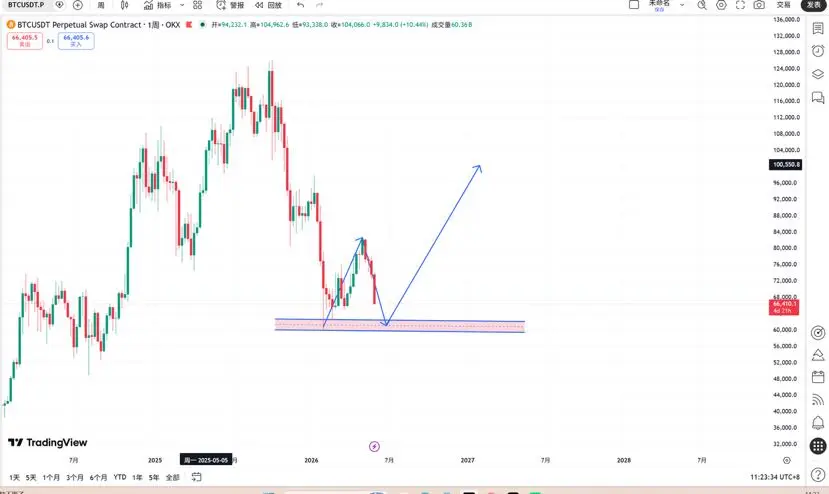
- 打賞
- 按讚
- 回覆
- 轉發
- 分享
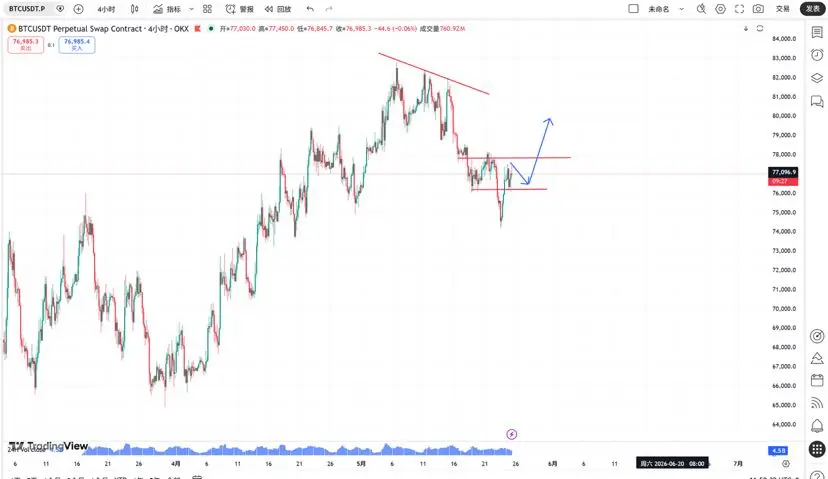
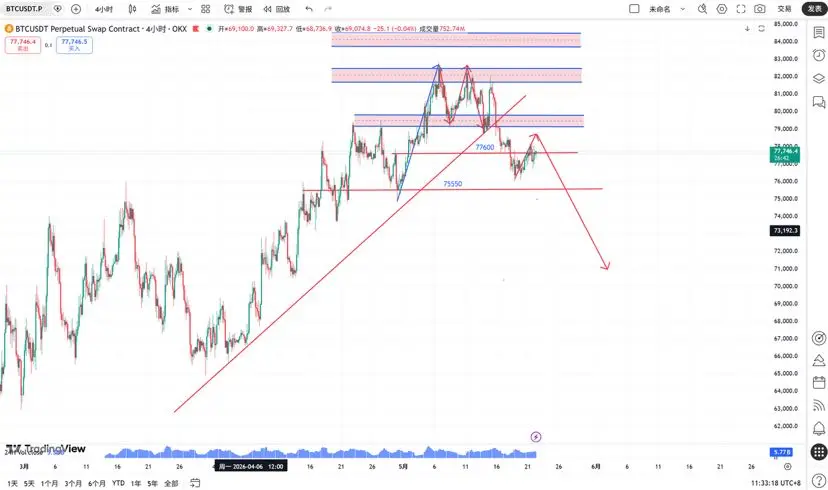
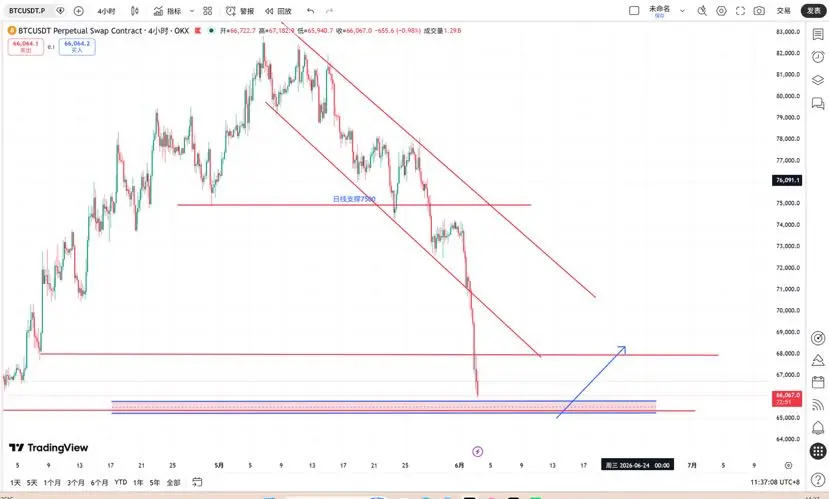
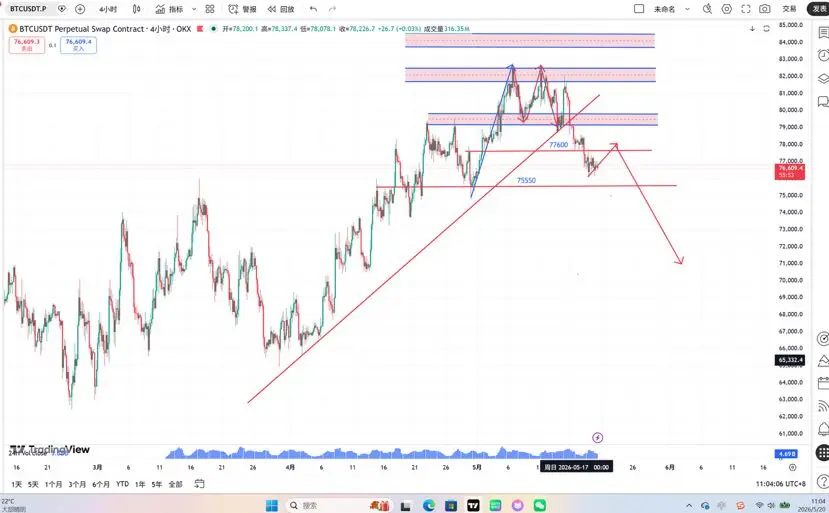
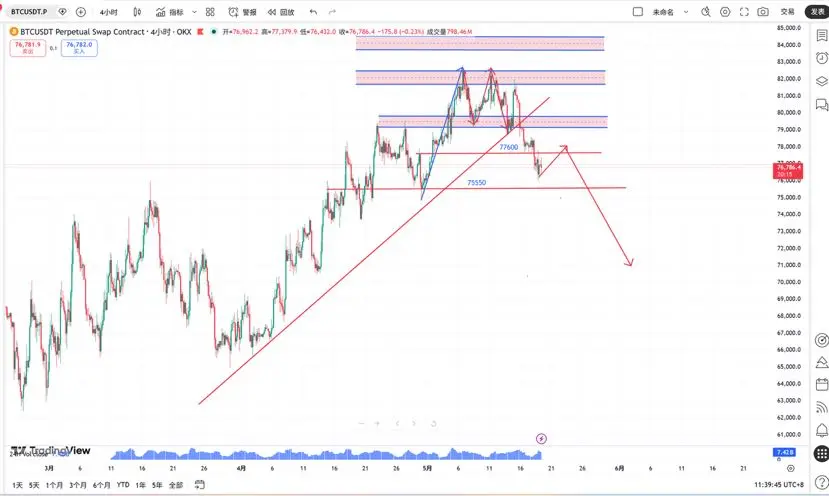
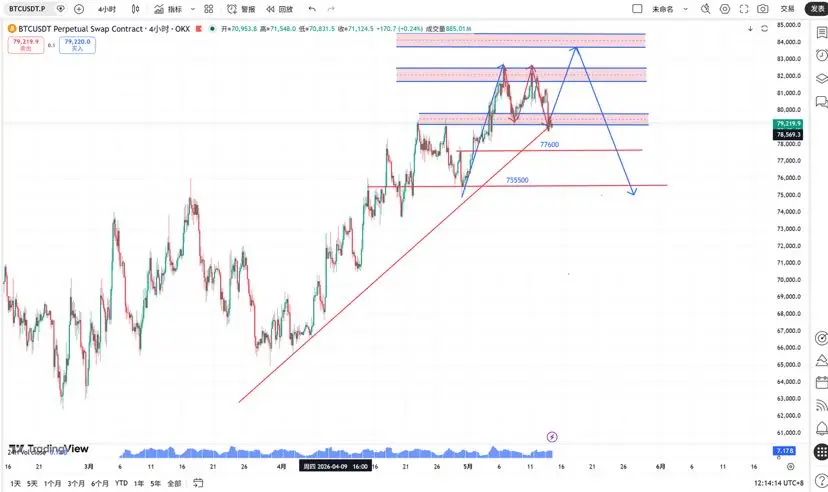
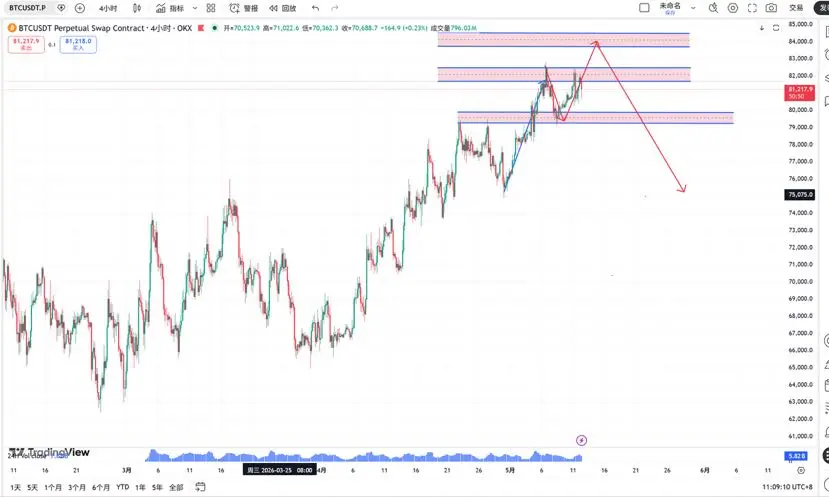
大餅76000撐住,現在的上漲看作反彈,反彈壓力位78500-79400,空頭趨勢沒有改變,這裡可以繼續做空,反彈後還會下跌,未來還會有一波大暴跌,但是我認為不會跌破6萬,到了6.5萬附近分批打入現貨,不要等一堆KOL說的三萬四萬了,你看看你能等到不
查看原文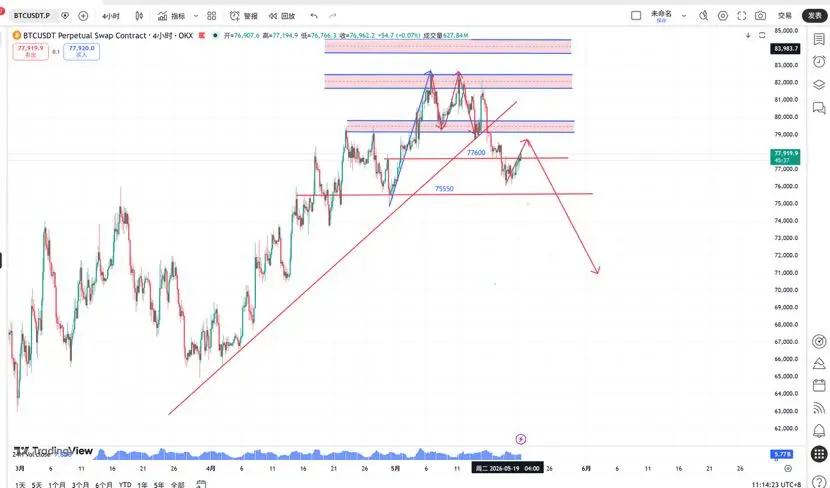
- 打賞
- 按讚
- 回覆
- 轉發
- 分享
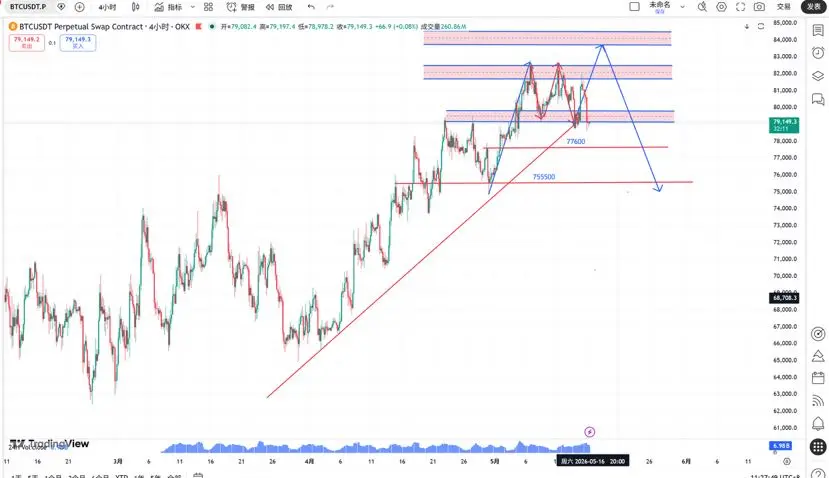
親愛的現在是北京時間,5月15號,9:58,你懂我意思嗎
查看原文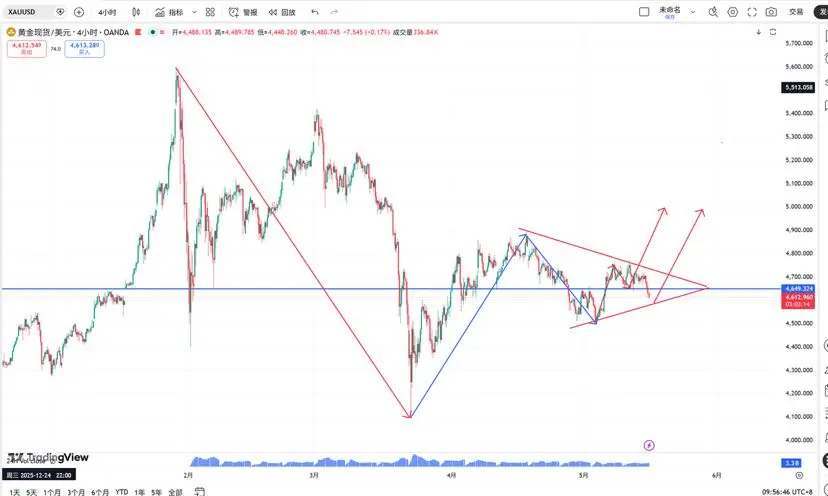
- 打賞
- 按讚
- 回覆
- 轉發
- 分享
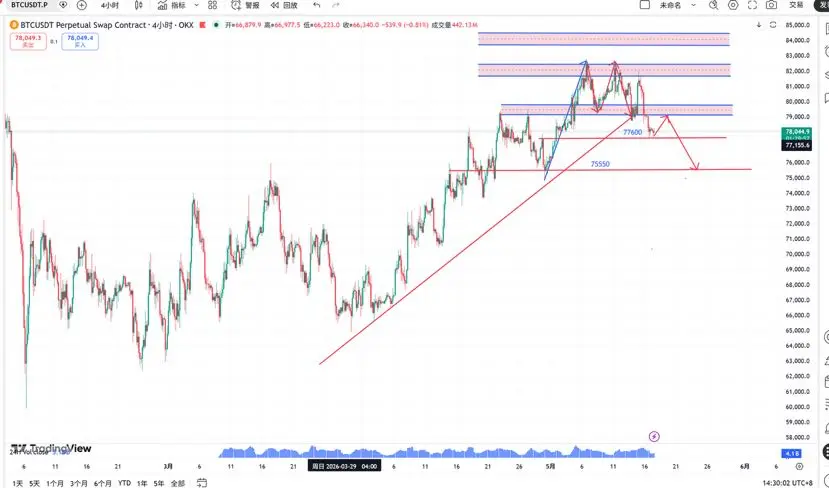
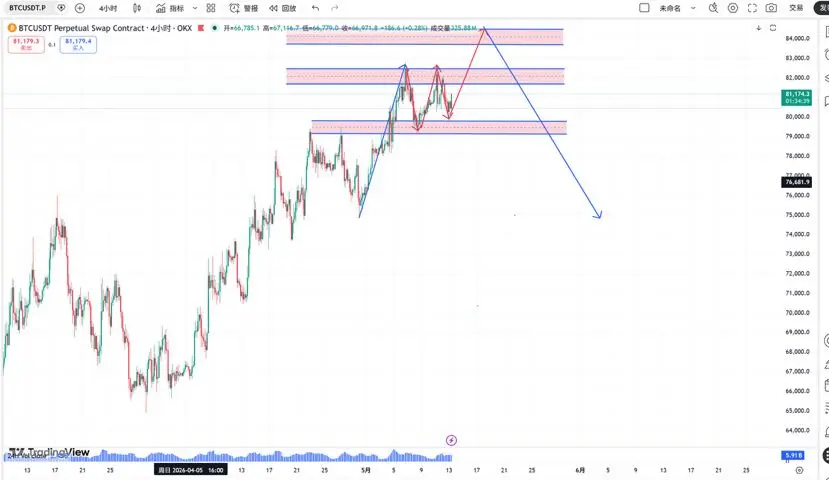
上午說了不要盲目追空,82000的空單跑對了,哪怕賣飛,主力就是在培養做空習慣,近一個月做空如做狗,只有套住的兄弟感同身受
查看原文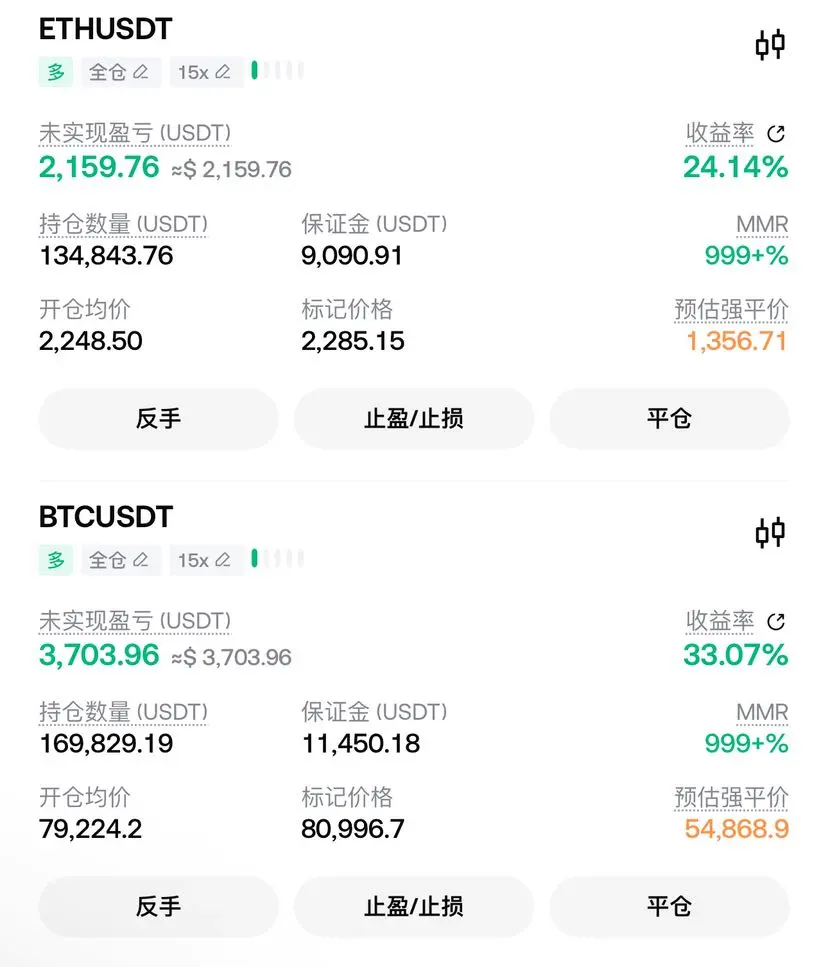
- 打賞
- 按讚
- 回覆
- 轉發
- 分享
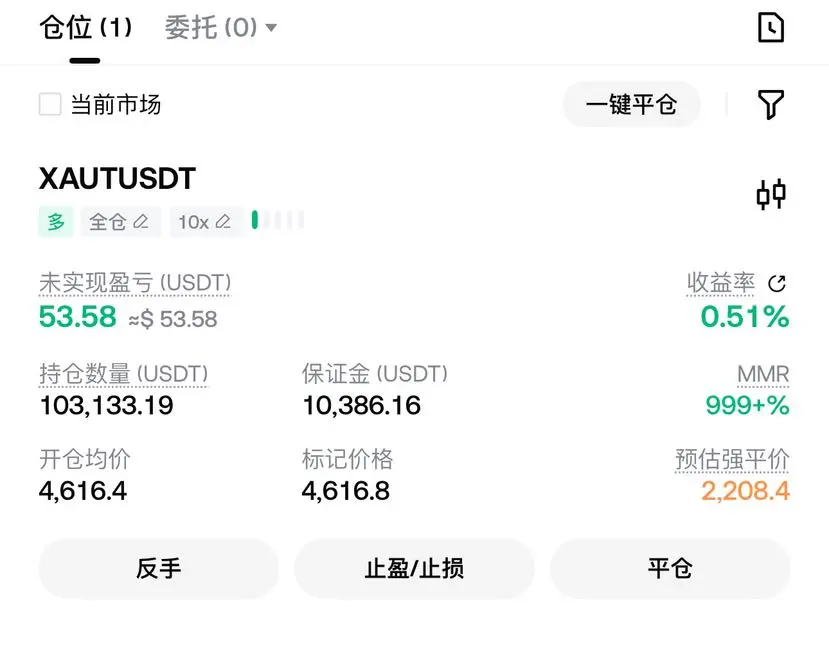
黃金昨天在我們畫的藍色支撐4660附近強勢反彈,衝到了4760附近,這裡我沒有加槓桿,買的紙黃金,上方壓力明顯,還有可能走個三角形調整或是一個收斂調整。這樣走也屬於是強勢調整,問題不大,調整結束後黃金仍會漲至5000,如果調整期間再跌破4500,結構失效。後續有新的交易機會我再隨時更新
查看原文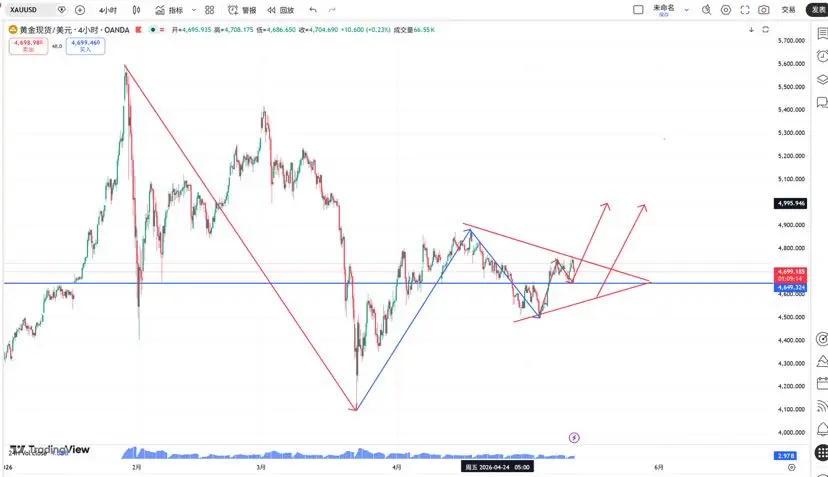
- 打賞
- 按讚
- 回覆
- 轉發
- 分享
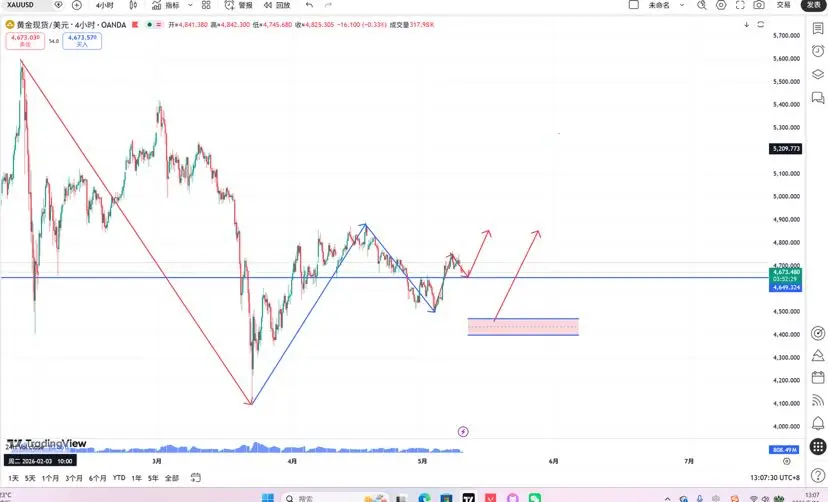
假設4501作為黃金新一輪上漲的起點,那麼4501-4765為第一段上漲,4765開始運行的是針對該段上漲的回調。
不跌破4664是一個強勢回調,跌破4664則可能運行一個深度回調,直接跌破4501則說明黃金自4890開始的,針對4100-4890上漲的回調還未結束,後續找到回調終點後仍會繼續上漲。(以4100做階段性低點為前
查看原文不跌破4664是一個強勢回調,跌破4664則可能運行一個深度回調,直接跌破4501則說明黃金自4890開始的,針對4100-4890上漲的回調還未結束,後續找到回調終點後仍會繼續上漲。(以4100做階段性低點為前
- 打賞
- 按讚
- 回覆
- 轉發
- 分享
熱門話題
查看更多3萬 熱度
31.4萬 熱度
71.79萬 熱度
69.1萬 熱度
78.51萬 熱度