#StrategyBitcoinPositionTurnsRed Managing Red Positions in BTC
Bitcoin Market Alert — What Red Positions Really Mean
Positions turning red is a natural part of market cycles, but it also signals an important moment for strategic decision-making. Traders and investors must differentiate between temporary pullbacks and signs of sustained weakness.
🔍 Understanding Red Positions
Short-term Losses: Negative returns indicate BTC has retraced from recent highs.
Market Sentiment: Widespread red can trigger fear—but it also creates accumulation opportunities for disciplined participants.
Risk Management Trigger: This is a critical moment to review stop-loss levels, exposure, and leverage.
📊 Technical & On-Chain Context
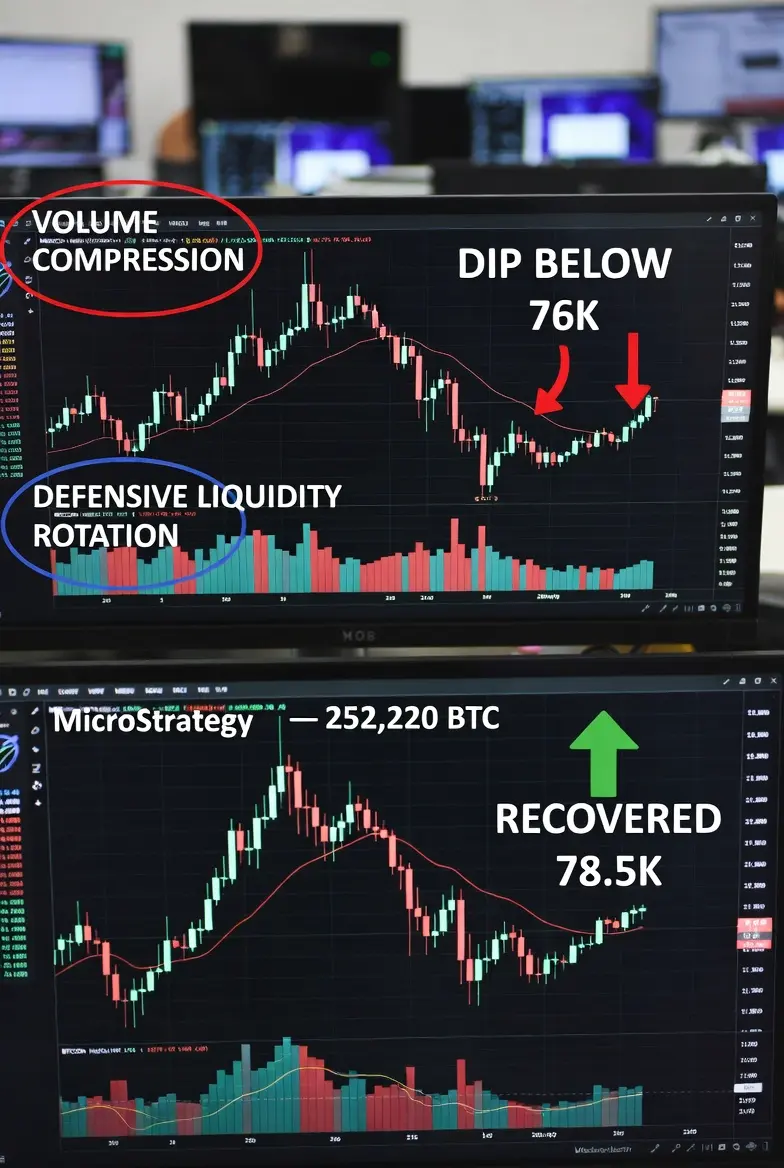
Support Testing: BTC is currently testing $75,000–$76,500; holding this zone is crucial.
Liquidity Zones: Red positions often coincide with smart money buying at key levels.
Indicators:
RSI: Neutral to slightly oversold (45–50)
MACD: Slight bearish crossover signaling short-term weakness
🧠 Market Implications
Short-Term Traders: Red positions can serve as a warning to reduce leverage or take partial profits.
Long-Term Investors: Dips may provide favorable accumulation opportunities.
Institutional Behavior: Exchange outflows and whale accumulation suggest smart money is using red periods to quietly build positions.
⚡ Strategic Takeaways
Red positions are normal in volatile markets—they don’t always indicate a downtrend.
Conservative approach: Reduce exposure and wait for confirmation of support.
Aggressive approach: Add to positions if support holds and market sentiment begins to shift.
Smart traders monitor volume, on-chain flows, funding rates, and macro factors before deciding on timing.
Key Insight: Red periods reveal where liquidity is absorbed and who is accumulating. Understanding this dynamic separates strategic participants from emotional traders.
Bitcoin Market Alert — What Red Positions Really Mean
Positions turning red is a natural part of market cycles, but it also signals an important moment for strategic decision-making. Traders and investors must differentiate between temporary pullbacks and signs of sustained weakness.
🔍 Understanding Red Positions
Short-term Losses: Negative returns indicate BTC has retraced from recent highs.
Market Sentiment: Widespread red can trigger fear—but it also creates accumulation opportunities for disciplined participants.
Risk Management Trigger: This is a critical moment to review stop-loss levels, exposure, and leverage.
📊 Technical & On-Chain Context
Support Testing: BTC is currently testing $75,000–$76,500; holding this zone is crucial.
Liquidity Zones: Red positions often coincide with smart money buying at key levels.
Indicators:
RSI: Neutral to slightly oversold (45–50)
MACD: Slight bearish crossover signaling short-term weakness
🧠 Market Implications
Short-Term Traders: Red positions can serve as a warning to reduce leverage or take partial profits.
Long-Term Investors: Dips may provide favorable accumulation opportunities.
Institutional Behavior: Exchange outflows and whale accumulation suggest smart money is using red periods to quietly build positions.
⚡ Strategic Takeaways
Red positions are normal in volatile markets—they don’t always indicate a downtrend.
Conservative approach: Reduce exposure and wait for confirmation of support.
Aggressive approach: Add to positions if support holds and market sentiment begins to shift.
Smart traders monitor volume, on-chain flows, funding rates, and macro factors before deciding on timing.
Key Insight: Red periods reveal where liquidity is absorbed and who is accumulating. Understanding this dynamic separates strategic participants from emotional traders.