#BitcoinBouncesBack
Bitcoin Pushes Toward $80K: Liquidity Wars, Institutional Flows, and the Next Market Phase
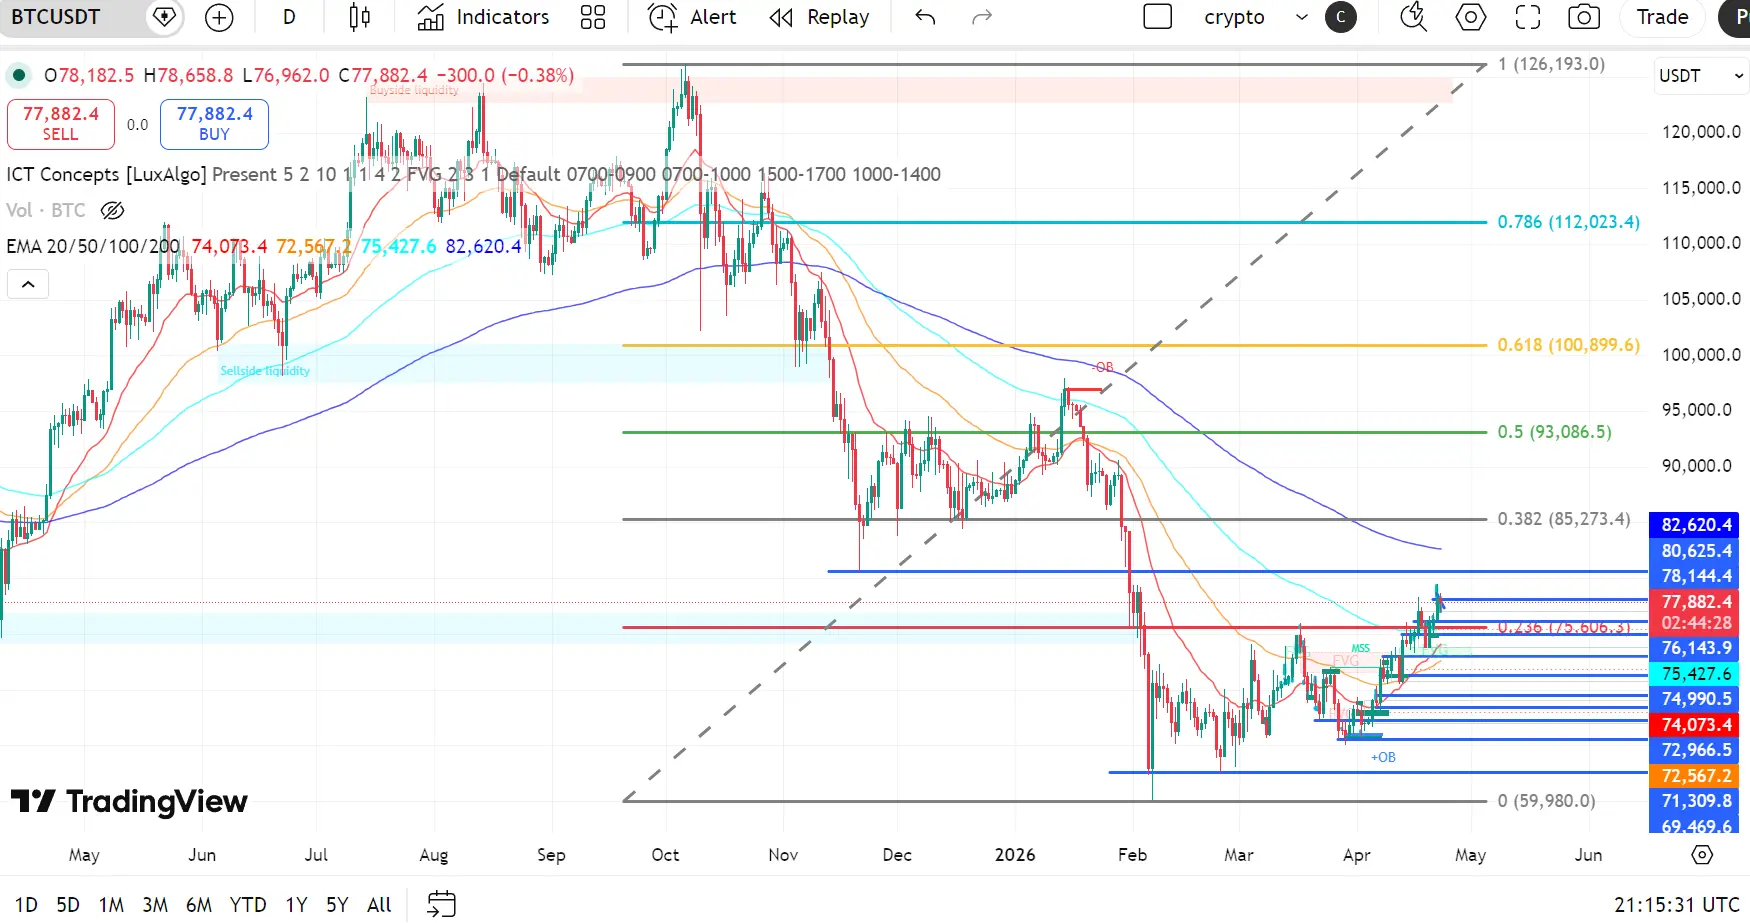
The recent rebound in Bitcoin has done more than recover price—it has reshaped short-term market psychology. After reclaiming the $78,000 region and briefly testing higher liquidity zones, the market is now entering a far more complex phase than the initial V-shaped bounce. This is no longer just about recovery; it’s about whether the structure can transition into a sustainable trend or fade into another consolidation trap.
What’s different in this phase compared to earlier rebounds is the nature of liquidity flow. Previously, rallies were largely driven by retail momentum and speculative leverage. Now, the movement is increasingly influenced by deeper capital layers—particularly institutional positioning and derivatives market structure. Open interest across major exchanges has expanded significantly, but without a proportional rise in spot volume. This divergence suggests that leverage—not organic demand—is still playing a dominant role in price movement.
At the same time, the role of spot demand cannot be ignored. Quiet accumulation has been observed through large wallet activity and exchange outflows, indicating that some long-term participants are positioning below the $80,000 threshold. This creates an interesting dynamic: while short-term traders are battling within tight ranges, longer-term players appear to be building positions in anticipation of a larger breakout.
The derivatives market is sending mixed signals. Funding rates remain slightly negative to neutral, which typically indicates that traders are still leaning bearish despite rising prices. This imbalance creates the conditions for continued short squeeze potential. However, unlike the previous move where liquidations triggered explosive upside, the current environment shows more controlled volatility. This implies that market makers are actively managing liquidity rather than allowing uncontrolled cascades.
Another key factor shaping the current structure is macro uncertainty. Global financial conditions remain tight, and risk assets are highly sensitive to interest rate expectations. The stance of Federal Reserve continues to influence liquidity across all markets, including crypto. Any shift toward easing could act as a strong catalyst for further upside, while continued tightening or uncertainty may cap gains and reinforce range-bound behavior.
Ethereum, represented by Ethereum, is once again lagging behind Bitcoin in terms of momentum. This divergence is becoming a recurring theme in the current cycle. While Ethereum’s ecosystem remains fundamentally strong—with ongoing development in scaling solutions and staking participation—capital rotation is clearly favoring Bitcoin as the primary store-of-value narrative strengthens. The ETH/BTC ratio remains under pressure, reflecting this shift in preference among larger investors.
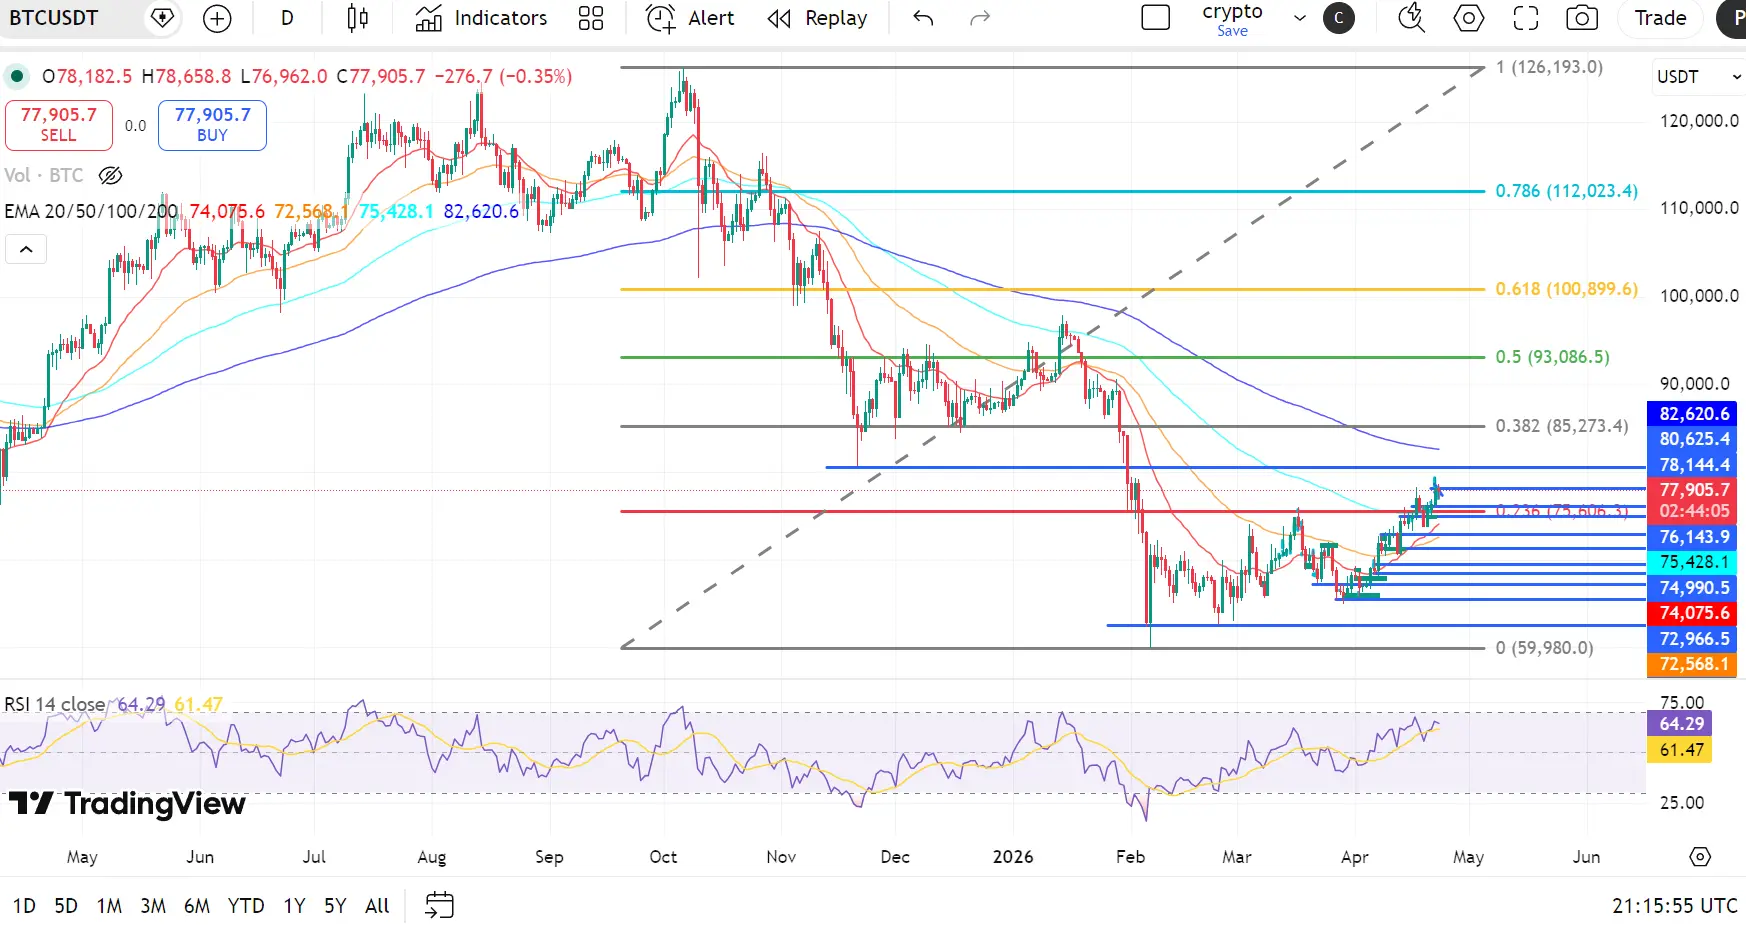
From a technical standpoint, the $78,000–$80,000 zone remains the most critical battlefield. This range is dense with historical resistance, liquidity clusters, and psychological significance. A clean breakout above $80,000, supported by strong spot volume and sustained buying pressure, could open the path toward the $85,000–$88,000 region. However, failure to break this zone convincingly may lead to a rejection scenario, with price revisiting support levels around $74,000–$75,000.
What makes this moment particularly interesting is volatility compression. Indicators such as Bollinger Bands and realized volatility metrics are tightening again after the initial expansion during the recovery phase. Historically, such compression often precedes large directional moves. The question is not whether volatility will return—but in which direction it will resolve.
Another emerging narrative is the increasing correlation between crypto and traditional financial markets. Assets like Apple and Tesla have shown sensitivity to the same macro signals influencing Bitcoin, particularly around interest rates and global liquidity. This growing interconnection suggests that crypto is becoming more integrated into the broader financial system, rather than operating as an isolated asset class.
On-chain data adds another layer to the story. Long-term holder supply continues to trend upward, indicating that a significant portion of Bitcoin is being held rather than traded. Meanwhile, short-term holder activity has increased, reflecting the speculative nature of recent price movements. This split between long-term conviction and short-term trading creates a push-and-pull dynamic that often leads to choppy market conditions before a decisive breakout.
Stablecoin flows are also worth monitoring. Inflows to exchanges typically signal buying intent, while outflows suggest capital is moving into storage or alternative uses. Recent data shows a balanced flow, reinforcing the idea that the market is in a state of indecision rather than clear accumulation or distribution.
From a trading perspective, this environment demands adaptability. The sharp V-shaped recovery rewarded aggressive positioning, but the current phase requires patience and precision. Chasing momentum in a tightening range can quickly lead to losses, especially as liquidity becomes more fragmented and unpredictable.
Risk management becomes the defining factor. Instead of focusing solely on potential upside, traders must account for downside scenarios with equal attention. Position sizing, stop-loss discipline, and diversification across assets are no longer optional—they are essential in a market that can shift direction rapidly.
Psychology, once again, plays a central role. After a strong rebound, the temptation to assume a continued uptrend is high. However, markets rarely move in straight lines. Periods of consolidation, false breakouts, and liquidity hunts are common before any sustained move. Remaining neutral and reactive, rather than emotionally committed to a single bias, is often the most effective approach.
Looking ahead, several catalysts could define the next major move. Macroeconomic data releases, shifts in central bank policy, institutional inflows, and geopolitical developments all have the potential to influence market direction. At the same time, internal crypto factors—such as ETF flows, network activity, and regulatory updates—will continue to shape sentiment.
The key takeaway is that the market is transitioning. The explosive recovery phase is over, and a more strategic phase has begun. This is where trends are either confirmed or invalidated. Breakouts from this structure tend to be more meaningful because they are built on consolidation rather than reaction.
For now, all eyes remain on the $80,000 level. It is not just a resistance point—it is a decision zone that will likely determine the next major trend for Bitcoin. Whether the market breaks through with conviction or gets rejected into another cycle of consolidation, one thing is certain: the calm we see now is unlikely to last.
Stay alert, stay flexible, and most importantly—stay disciplined. In markets like this, survival is just as important as profit.
#GateSquare #CreatorCarnival #ContentMining
Bitcoin Pushes Toward $80K: Liquidity Wars, Institutional Flows, and the Next Market Phase
The recent rebound in Bitcoin has done more than recover price—it has reshaped short-term market psychology. After reclaiming the $78,000 region and briefly testing higher liquidity zones, the market is now entering a far more complex phase than the initial V-shaped bounce. This is no longer just about recovery; it’s about whether the structure can transition into a sustainable trend or fade into another consolidation trap.
What’s different in this phase compared to earlier rebounds is the nature of liquidity flow. Previously, rallies were largely driven by retail momentum and speculative leverage. Now, the movement is increasingly influenced by deeper capital layers—particularly institutional positioning and derivatives market structure. Open interest across major exchanges has expanded significantly, but without a proportional rise in spot volume. This divergence suggests that leverage—not organic demand—is still playing a dominant role in price movement.
At the same time, the role of spot demand cannot be ignored. Quiet accumulation has been observed through large wallet activity and exchange outflows, indicating that some long-term participants are positioning below the $80,000 threshold. This creates an interesting dynamic: while short-term traders are battling within tight ranges, longer-term players appear to be building positions in anticipation of a larger breakout.
The derivatives market is sending mixed signals. Funding rates remain slightly negative to neutral, which typically indicates that traders are still leaning bearish despite rising prices. This imbalance creates the conditions for continued short squeeze potential. However, unlike the previous move where liquidations triggered explosive upside, the current environment shows more controlled volatility. This implies that market makers are actively managing liquidity rather than allowing uncontrolled cascades.
Another key factor shaping the current structure is macro uncertainty. Global financial conditions remain tight, and risk assets are highly sensitive to interest rate expectations. The stance of Federal Reserve continues to influence liquidity across all markets, including crypto. Any shift toward easing could act as a strong catalyst for further upside, while continued tightening or uncertainty may cap gains and reinforce range-bound behavior.
Ethereum, represented by Ethereum, is once again lagging behind Bitcoin in terms of momentum. This divergence is becoming a recurring theme in the current cycle. While Ethereum’s ecosystem remains fundamentally strong—with ongoing development in scaling solutions and staking participation—capital rotation is clearly favoring Bitcoin as the primary store-of-value narrative strengthens. The ETH/BTC ratio remains under pressure, reflecting this shift in preference among larger investors.
From a technical standpoint, the $78,000–$80,000 zone remains the most critical battlefield. This range is dense with historical resistance, liquidity clusters, and psychological significance. A clean breakout above $80,000, supported by strong spot volume and sustained buying pressure, could open the path toward the $85,000–$88,000 region. However, failure to break this zone convincingly may lead to a rejection scenario, with price revisiting support levels around $74,000–$75,000.
What makes this moment particularly interesting is volatility compression. Indicators such as Bollinger Bands and realized volatility metrics are tightening again after the initial expansion during the recovery phase. Historically, such compression often precedes large directional moves. The question is not whether volatility will return—but in which direction it will resolve.
Another emerging narrative is the increasing correlation between crypto and traditional financial markets. Assets like Apple and Tesla have shown sensitivity to the same macro signals influencing Bitcoin, particularly around interest rates and global liquidity. This growing interconnection suggests that crypto is becoming more integrated into the broader financial system, rather than operating as an isolated asset class.
On-chain data adds another layer to the story. Long-term holder supply continues to trend upward, indicating that a significant portion of Bitcoin is being held rather than traded. Meanwhile, short-term holder activity has increased, reflecting the speculative nature of recent price movements. This split between long-term conviction and short-term trading creates a push-and-pull dynamic that often leads to choppy market conditions before a decisive breakout.
Stablecoin flows are also worth monitoring. Inflows to exchanges typically signal buying intent, while outflows suggest capital is moving into storage or alternative uses. Recent data shows a balanced flow, reinforcing the idea that the market is in a state of indecision rather than clear accumulation or distribution.
From a trading perspective, this environment demands adaptability. The sharp V-shaped recovery rewarded aggressive positioning, but the current phase requires patience and precision. Chasing momentum in a tightening range can quickly lead to losses, especially as liquidity becomes more fragmented and unpredictable.
Risk management becomes the defining factor. Instead of focusing solely on potential upside, traders must account for downside scenarios with equal attention. Position sizing, stop-loss discipline, and diversification across assets are no longer optional—they are essential in a market that can shift direction rapidly.
Psychology, once again, plays a central role. After a strong rebound, the temptation to assume a continued uptrend is high. However, markets rarely move in straight lines. Periods of consolidation, false breakouts, and liquidity hunts are common before any sustained move. Remaining neutral and reactive, rather than emotionally committed to a single bias, is often the most effective approach.
Looking ahead, several catalysts could define the next major move. Macroeconomic data releases, shifts in central bank policy, institutional inflows, and geopolitical developments all have the potential to influence market direction. At the same time, internal crypto factors—such as ETF flows, network activity, and regulatory updates—will continue to shape sentiment.
The key takeaway is that the market is transitioning. The explosive recovery phase is over, and a more strategic phase has begun. This is where trends are either confirmed or invalidated. Breakouts from this structure tend to be more meaningful because they are built on consolidation rather than reaction.
For now, all eyes remain on the $80,000 level. It is not just a resistance point—it is a decision zone that will likely determine the next major trend for Bitcoin. Whether the market breaks through with conviction or gets rejected into another cycle of consolidation, one thing is certain: the calm we see now is unlikely to last.
Stay alert, stay flexible, and most importantly—stay disciplined. In markets like this, survival is just as important as profit.
#GateSquare #CreatorCarnival #ContentMining