As stats indicate, bears have the upper hand in today’s session as seen from the global market cap, which has dropped by 1.71% from its previous 24-hour one, as the total cap stood at $1.63T as of press time. The fear and greed index is 67, as fear now creeps back into the markets
Bitcoin Price Analysis
Bitcoin (BTC), the number one crypto, has failed to show dominance today as the Bitcoin price stood at $43.8K as of press time, representing a 0.5% plunge in the last 24 hours as the weekly rise stood at 3.2%. Bitcoin’s trading volume has spiked by 51% over the same period to stand at $23.8B.
The future price trajectory for Bitcoin looks bearis as an indepth analysis of 24 hour BTC/USD charts reveal. The Relative Strength Index indicator has is moving south showing mounting bear pressure on BTC. The MACD indicator, on the other hand, is in the red zone, showing bearish prospects for the Bitcoin price as well.
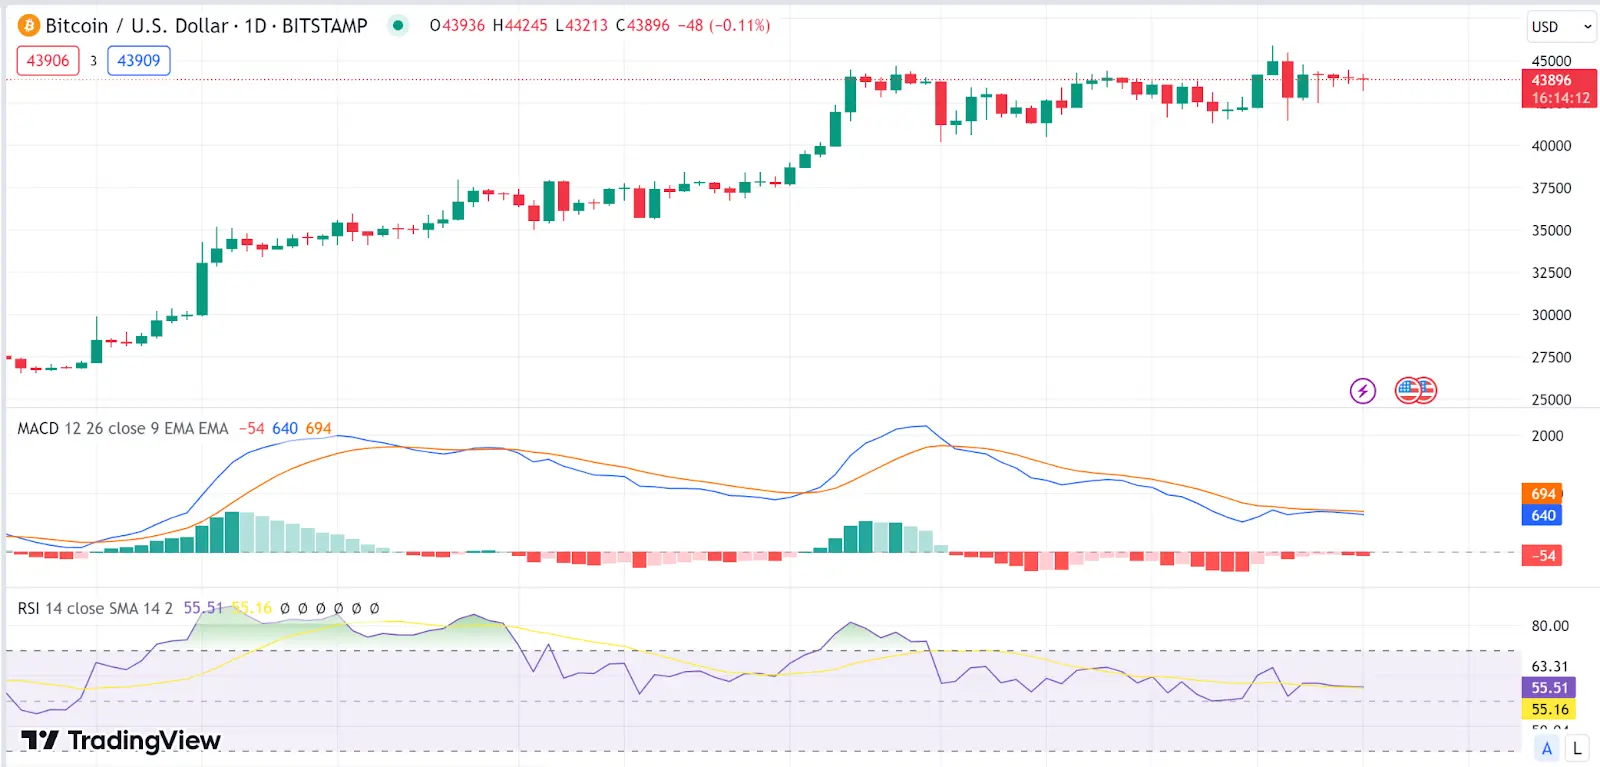 BTC 1-day chart | Source: TradingView## Ethereum Price Analysis
Ethereum (ETH) has also fallen prey to bear activity today as the Ethereum price stood at $2222 as of press time, representing a 1.2% increase in the last 24 hours as the weekly drop stood at 2.6%. The trading volume has spiked by 59% to $8.7B as trading activities generally increase.
An in-depth analysis of the ETH/USD charts reveals bear action ETH, as shown by the Relative Strength Index indicator, which is currently on a southern trajectory, showing bear action on the Ethereum price. At the same time, the MACD moves in the red zone, supporting the bear prospects on the Ethereum price.
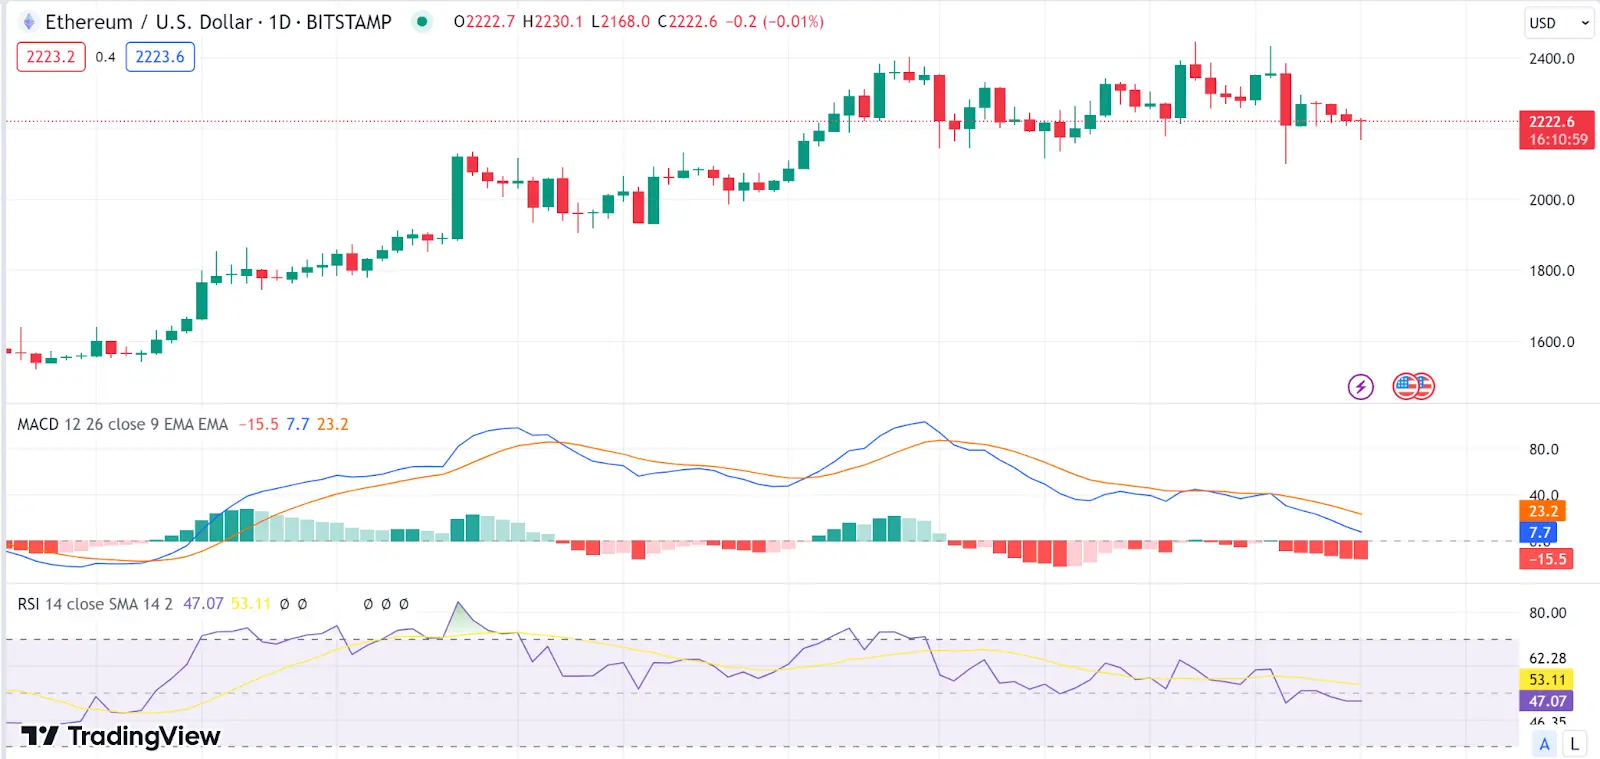 ETH 1-day chart | Source: TradingView## Stacks Price Analysis
Today has seen close to no gainers with Stacks (STX) appearing among the few. The Stacks price stood at $1.75 as of press time, representing a 10.8% increase in the last 24 hours as the weekly rise stood at 20%. The trading volume has spiked by 67% to $475M.
Looking at an in-depth analysis of 24 hour STX/USD charts, bulls are in control of stacks, as shown by the Relative Strength Index indicator, which is currently moving north, showing bull dominance on the Stacks price. At the same time, the MACD moves in the green zone, supporting the bull prospects on the Stacks price.
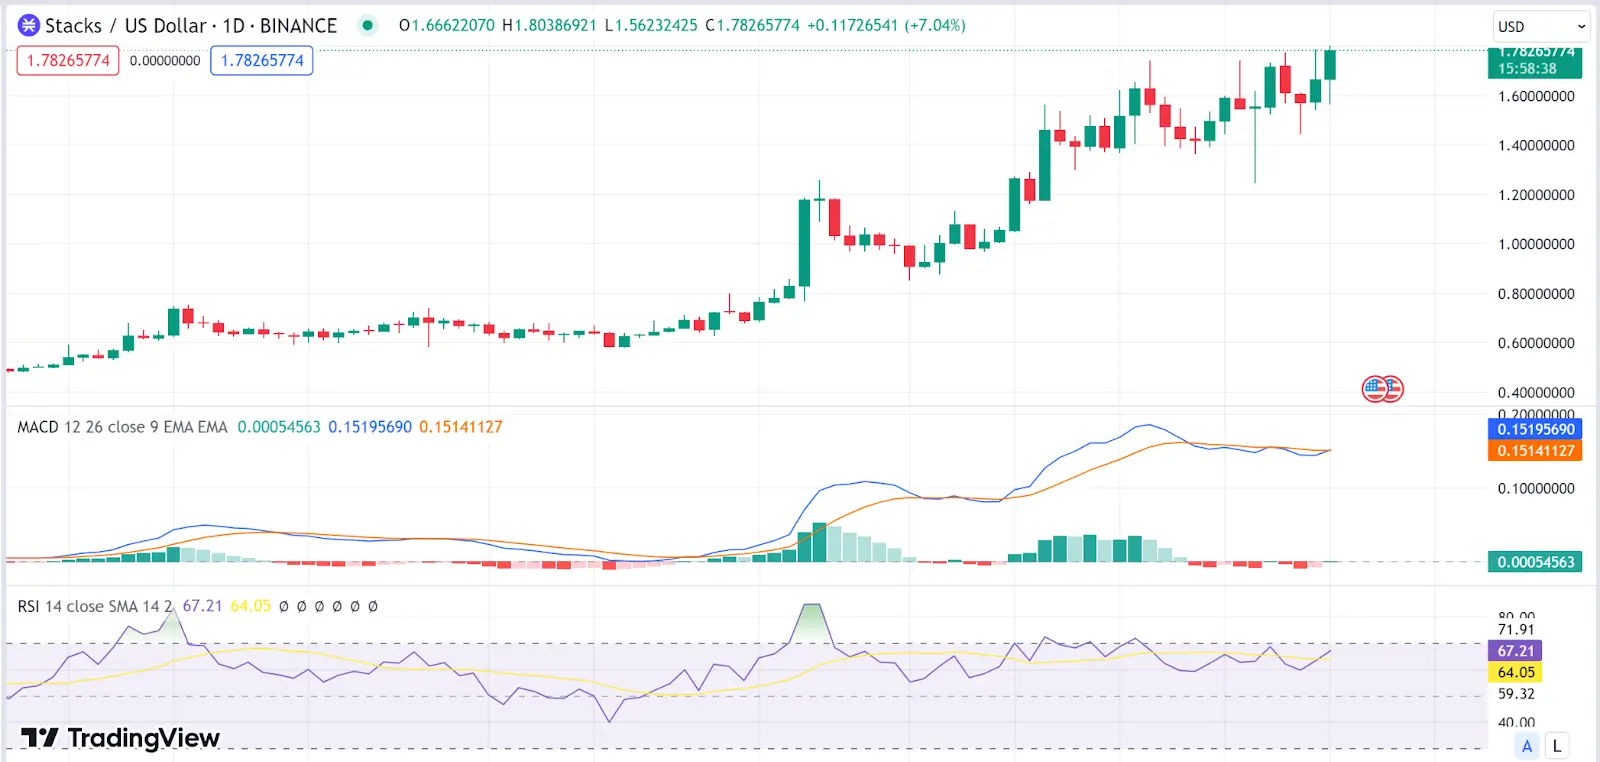 STX 1-day chart | Source: TradingView## Injective Price Analysis
Injective (INJ) is another gainer in today’s session as the Injective price stood at $38.2 as of press time, representing a 1.7% increase in the last 24 hours as the weekly rise stood at 6.8%. The trading volume has, however, dropped by 17% to $219M.
Looking at an in-depth analysis of 24 hour INJ/USD charts, bulls are now mounting dominance on the token, as shown by the Relative Strength Index indicator, which is currently moving north, showing building buying pressure on the Injecctive price. At the same time, the MACD is reverting towards the green zone backing bullish prospects on the Injective price.
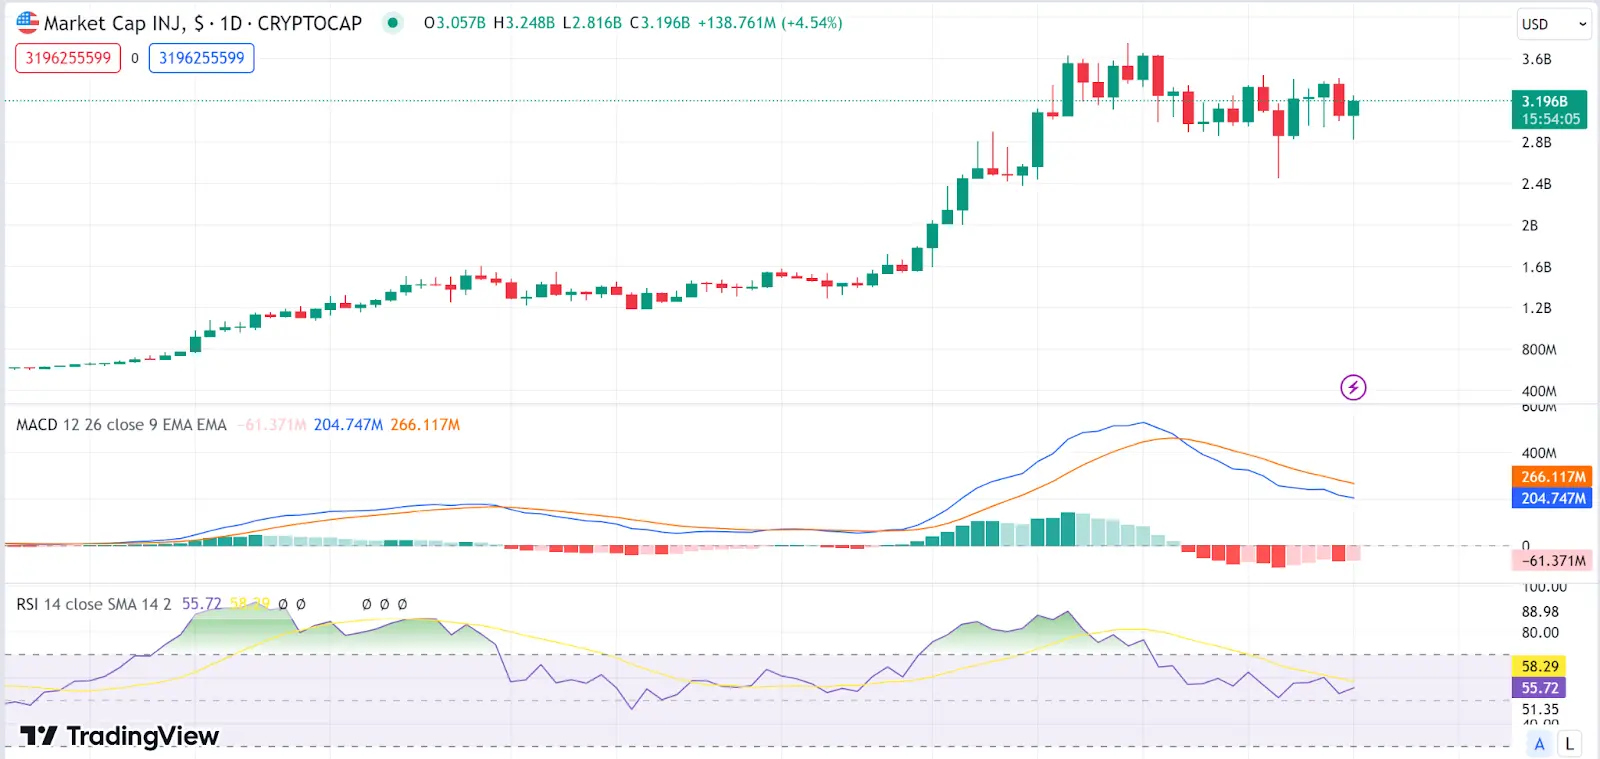 INJ 1-day chart | Source: TradingView## Maker Price Analysis
Maker (MKR) is our last gainer of the day as the Maker price stood at $1813.6 as of press time, representing a 3.5% increase in the last 24 hours as the weekly rise stood at 4.9%. The trading volume has jumped by 71% to $107M during the same period.
Looking at an in-depth analysis of 24 hour MKR/USD charts, the short term Maker price trajectory is currently uncertain as bulls and bears struggle for dominance. The Relative Strength Index indicator is moving north suggesting bull action while the MACD is reverting towards the red zone to show some bearish prospects on the Injective price.
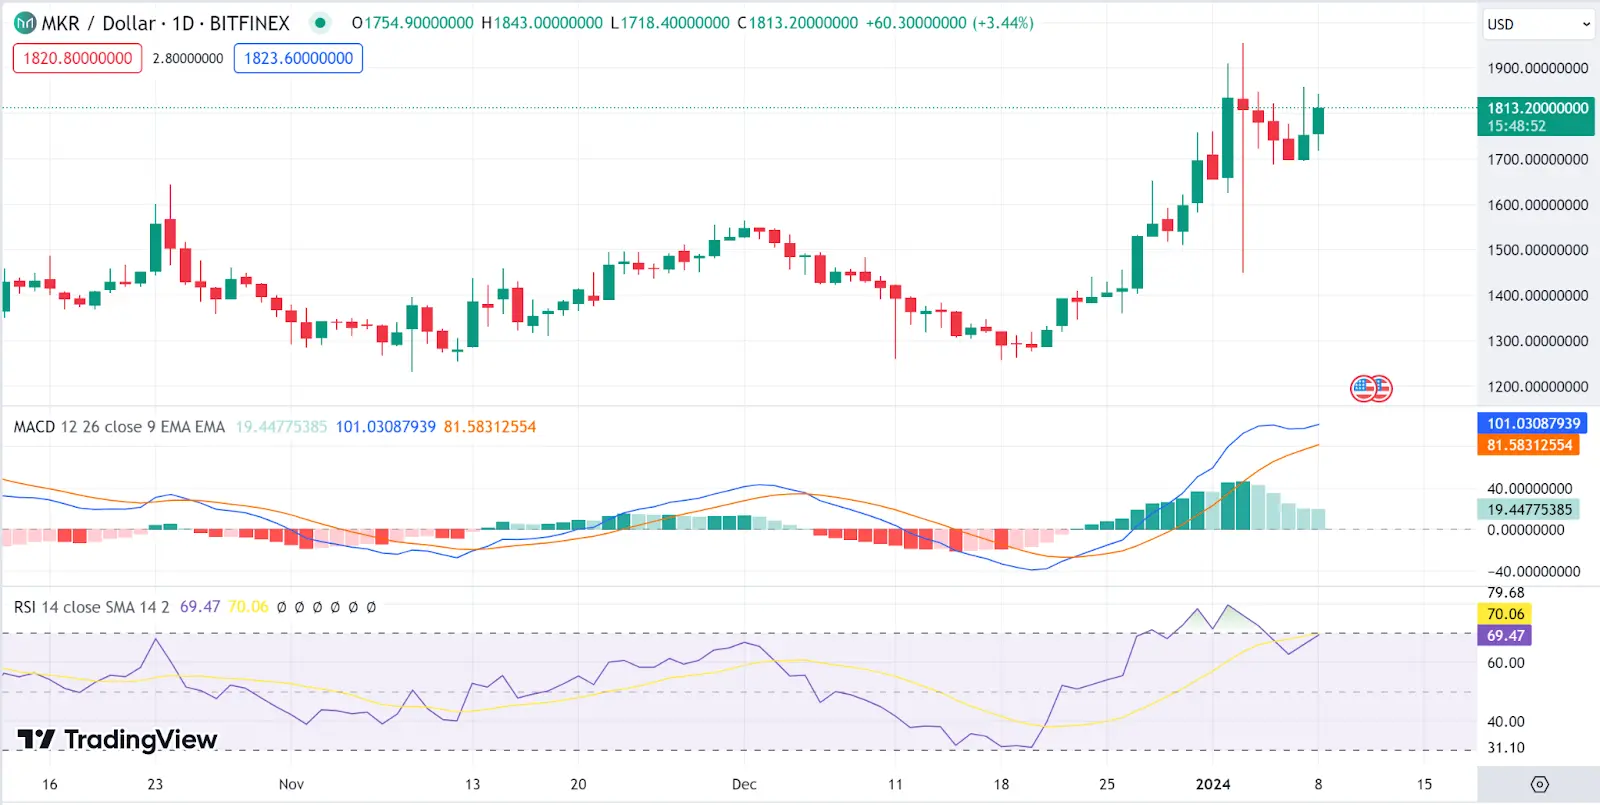 MKR 1-day chart | Source: TradingView
Disclaimer: The information on this page may come from third parties and does not represent the views or opinions of Gate. The content displayed on this page is for reference only and does not constitute any financial, investment, or legal advice. Gate does not guarantee the accuracy or completeness of the information and shall not be liable for any losses arising from the use of this information. Virtual asset investments carry high risks and are subject to significant price volatility. You may lose all of your invested principal. Please fully understand the relevant risks and make prudent decisions based on your own financial situation and risk tolerance. For details, please refer to
Disclaimer.