Ethereum’s price has been trending upward over recent weeks, leading investors to feel optimistic that a new bull market is on the horizon. Yet, there are still key resistance levels to be taken out for ETH to experience a new long-term bullish trend.
Technical Analysis
By: Edris
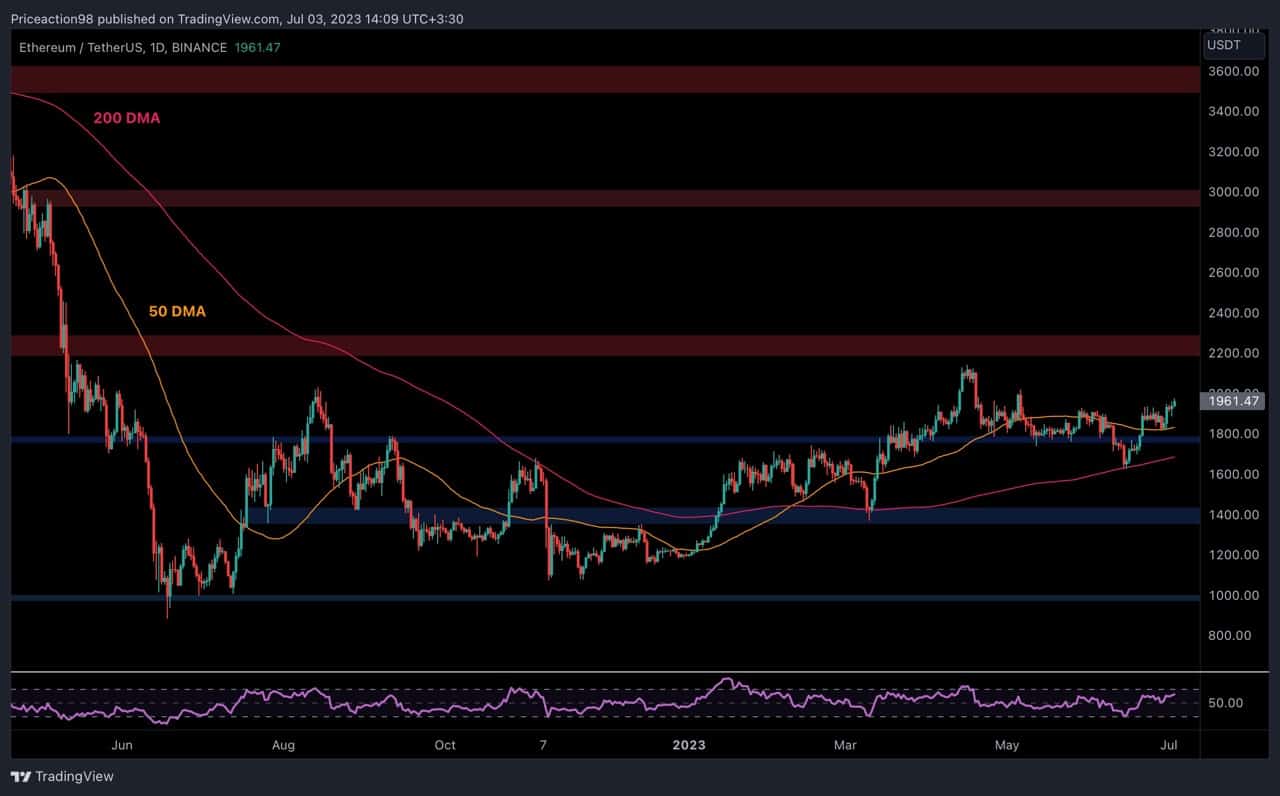
The Daily Chart
On the daily chart, the price has been rallying higher following a decisive rebound from the 200-day moving average, along with a breakout from the 50-day moving average to the upside. The aforementioned 50-day moving average, currently located around the $1,850 mark, has recently supported the price, pushing it to the upside.
Currently, the $2,200 level is the most likely target in this timeframe. A breakout above the $2,200 level would be instrumental for the market to enter a long-term bullish trend once more.
 Source: TradingView### The 4-Hour Chart
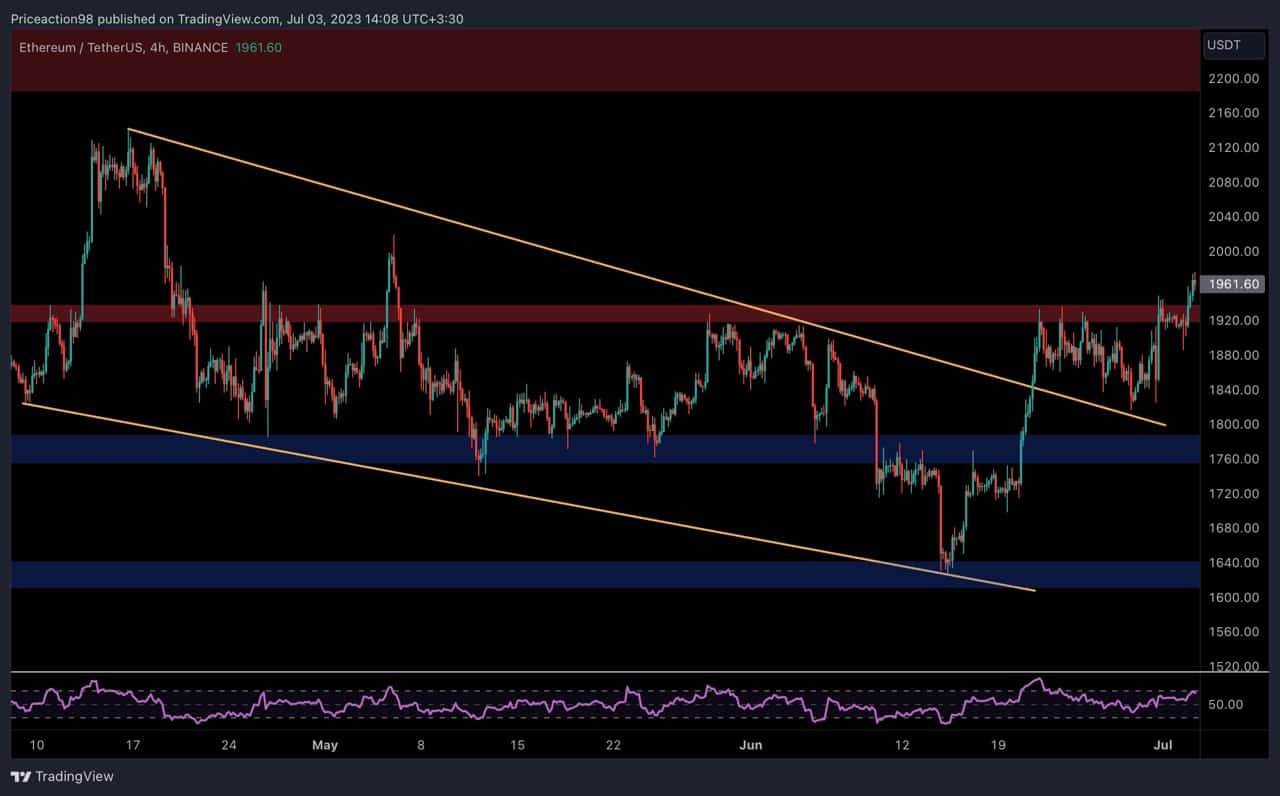
Looking at the 4-hour chart, things appear more interesting. Ethereum’s price has broken out of the large falling wedge pattern, but the $1,920 resistance level has rejected ETH several times. Even so, the cryptocurrency has been held by the higher boundary of the falling wedge and has been trending upwards consistently.
The $1,920 level is currently getting broken to the upside as the market climbs towards the $2,000 psychological level. Furthermore, while the RSI indicator is presently demonstrating bullish momentum dominance, it is approaching the overbought zone.
 Source: TradingViewSentiment Analysis
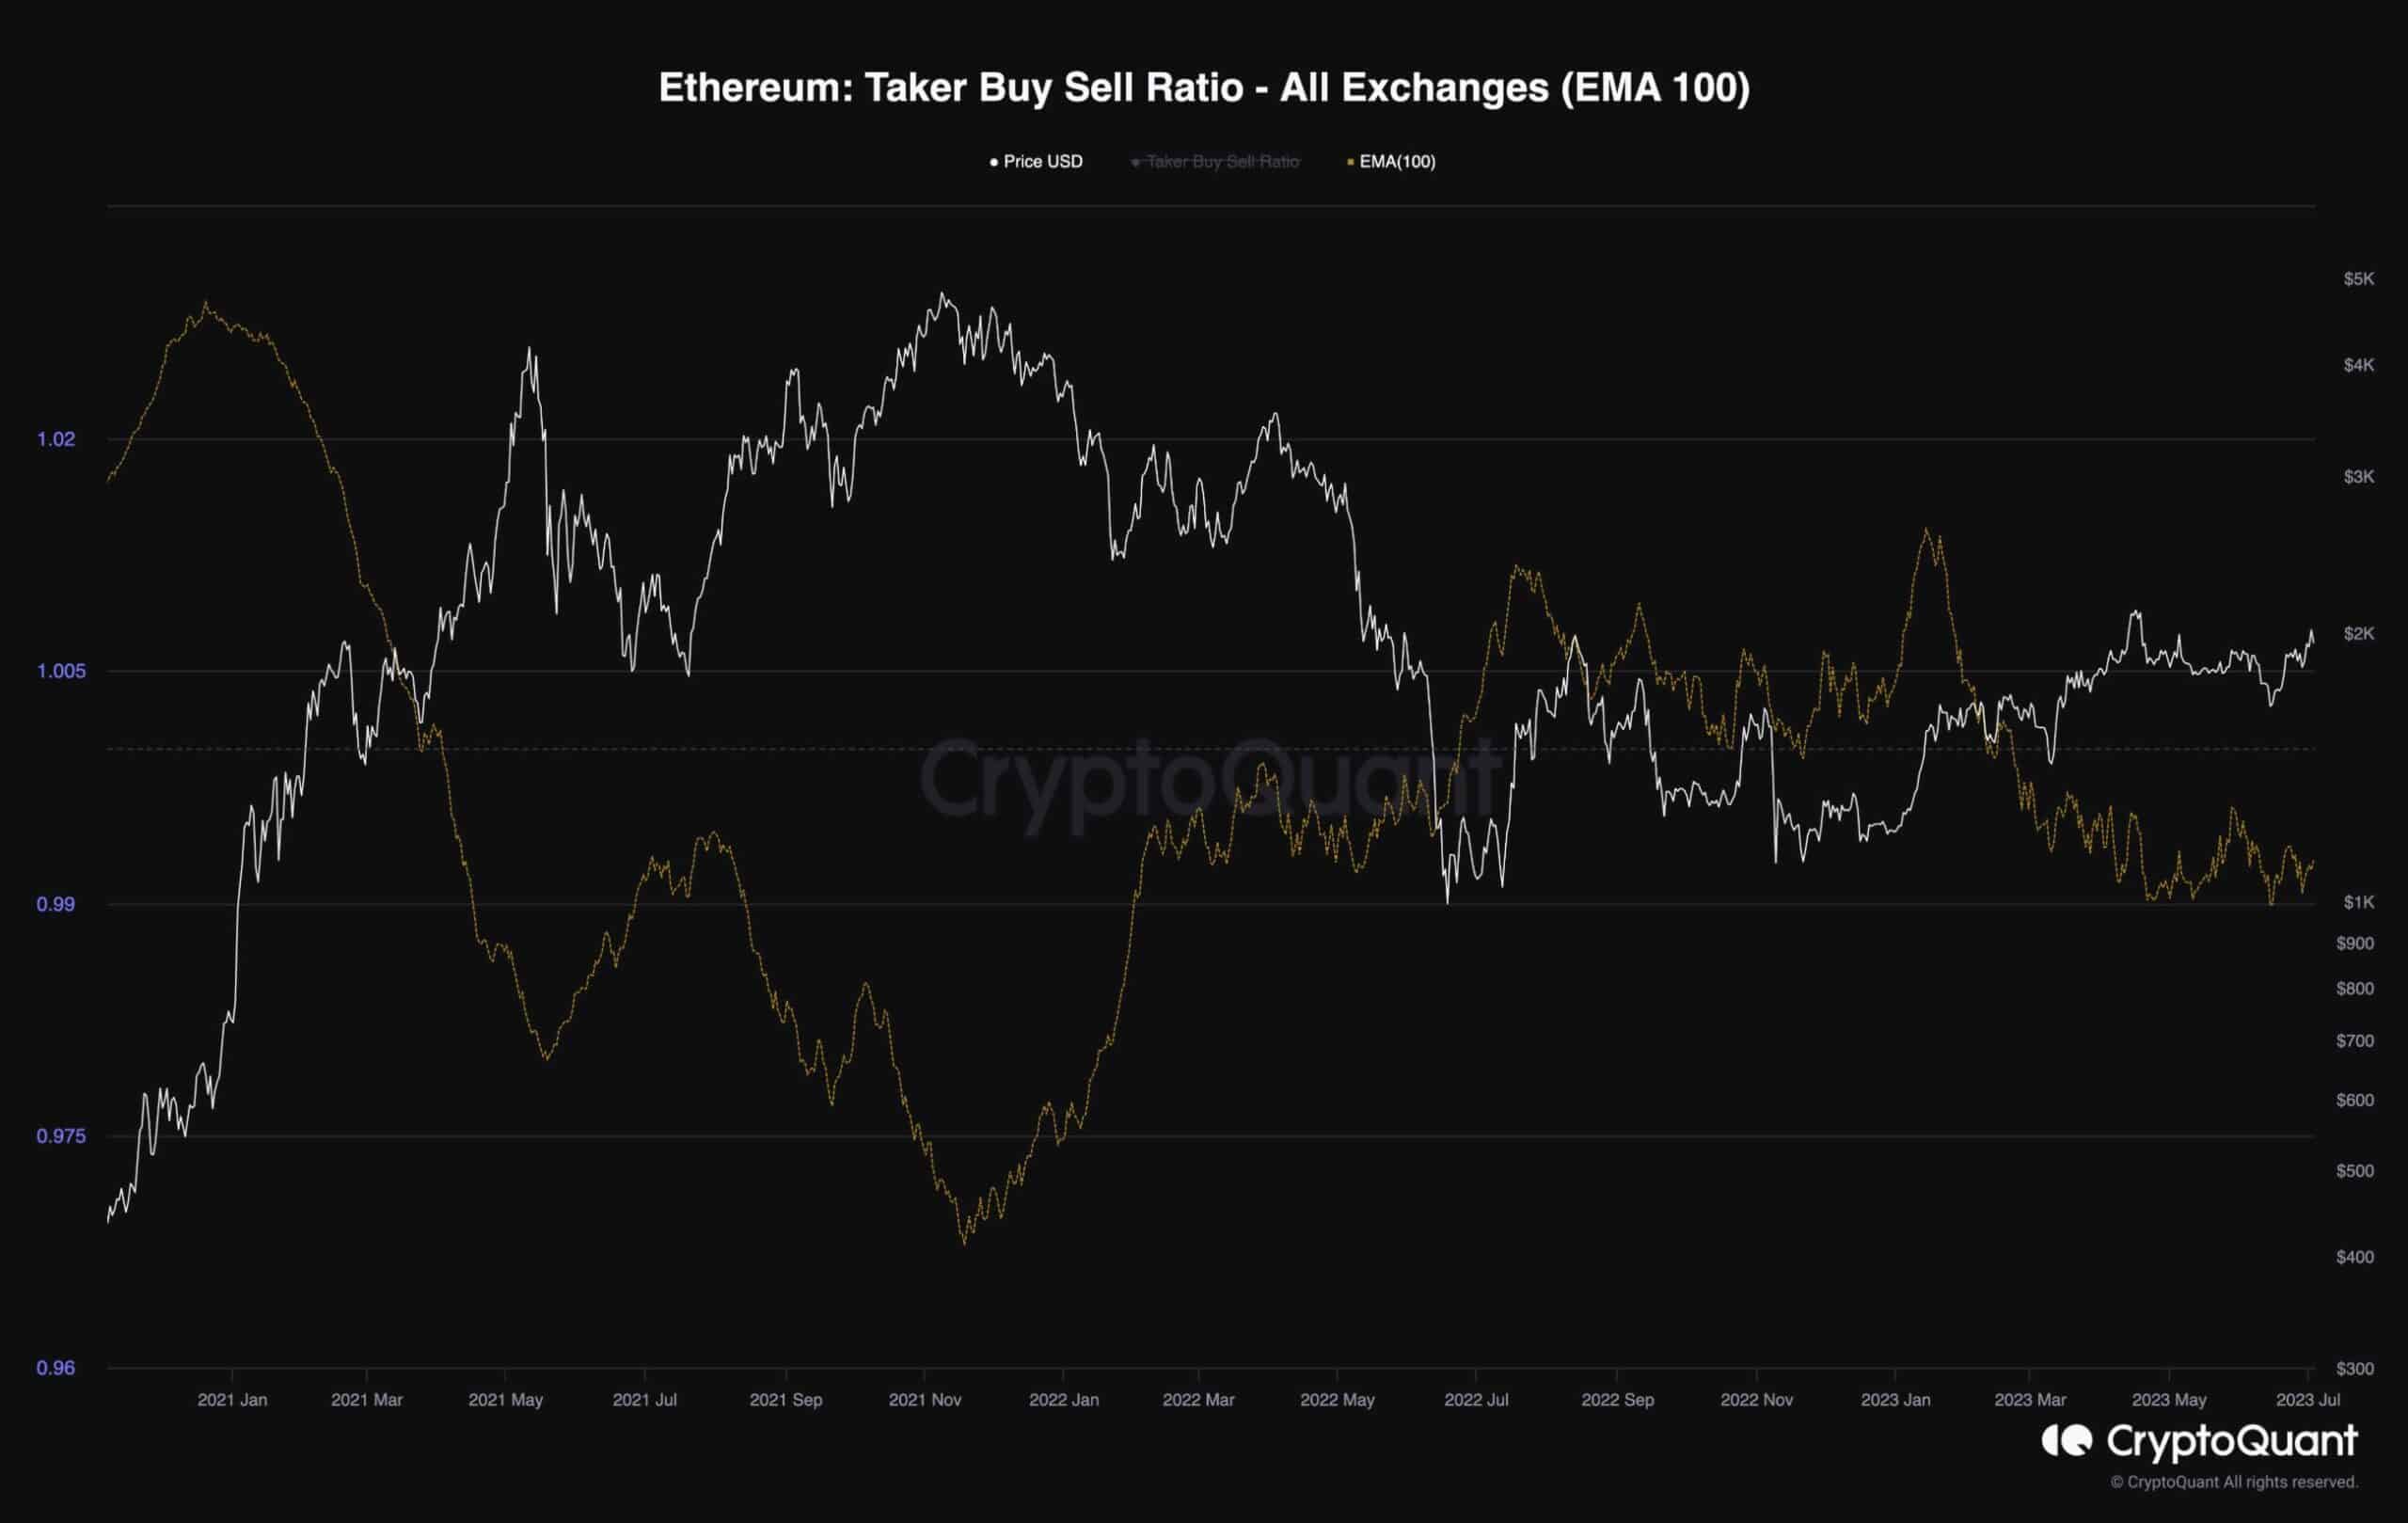
Ethereum Taker Buy Sell Ratio
To gain insights into the current market sentiment and determine whether Ethereum is entering a new bull market or continuing the current bear market, it would be valuable to examine the sentiment in the perpetual futures market.
Analyzing the Taker Buy-Sell Ratio metric, which is smoothed by a 100-day exponential moving average, provides valuable information about the dominance of long or short traders. A ratio above 1 suggests a bullish sentiment, while a ratio below 1 indicates a bearish sentiment.
Despite the gradual recovery in Ethereum’s price over the past few months, the Taker Buy-Sell Ratio remains below 1. This suggests that there is ongoing bearish sentiment in the futures market. Some investors may be shorting the market to hedge their spot portfolios, while others are engaging in short-selling for profit, indicating a belief that the bear market is not yet over.
If this behavior continues among futures traders and the demand in the spot market diminishes, it could lead to selling pressure and a potential bearish reversal shortly.
 Source: CryptoQuant
Disclaimer: The information on this page may come from third parties and does not represent the views or opinions of Gate. The content displayed on this page is for reference only and does not constitute any financial, investment, or legal advice. Gate does not guarantee the accuracy or completeness of the information and shall not be liable for any losses arising from the use of this information. Virtual asset investments carry high risks and are subject to significant price volatility. You may lose all of your invested principal. Please fully understand the relevant risks and make prudent decisions based on your own financial situation and risk tolerance. For details, please refer to
Disclaimer.