Trade
Basic
Futures
Futures
Hundreds of contracts settled in USDT or BTC
TradFi
Gold
Trade global traditional assets with USDT in one place
Options
Hot
Trade European-style vanilla options
Unified Account
Maximize your capital efficiency
Demo Trading
Futures Kickoff
Get prepared for your futures trading
Futures Events
Participate in events to win generous rewards
Demo Trading
Use virtual funds to experience risk-free trading
Earn
Launch
CandyDrop
Collect candies to earn airdrops
Launchpool
Quick staking, earn potential new tokens
HODLer Airdrop
Hold GT and get massive airdrops for free
Launchpad
Be early to the next big token project
Alpha Points
Trade on-chain assets and enjoy airdrop rewards!
Futures Points
Earn futures points and claim airdrop rewards
Investment
Simple Earn
Earn interests with idle tokens
Auto-Invest
Auto-invest on a regular basis
Dual Investment
Buy low and sell high to take profits from price fluctuations
Soft Staking
Earn rewards with flexible staking
Crypto Loan
0 Fees
Pledge one crypto to borrow another
Lending Center
One-stop lending hub
VIP Wealth Hub
Customized wealth management empowers your assets growth
Private Wealth Management
Customized asset management to grow your digital assets
Quant Fund
Top asset management team helps you profit without hassle
Staking
Stake cryptos to earn in PoS products
Smart Leverage
New
No forced liquidation before maturity, worry-free leveraged gains
GUSD Minting
Use USDT/USDC to mint GUSD for treasury-level yields
More
BlackSea
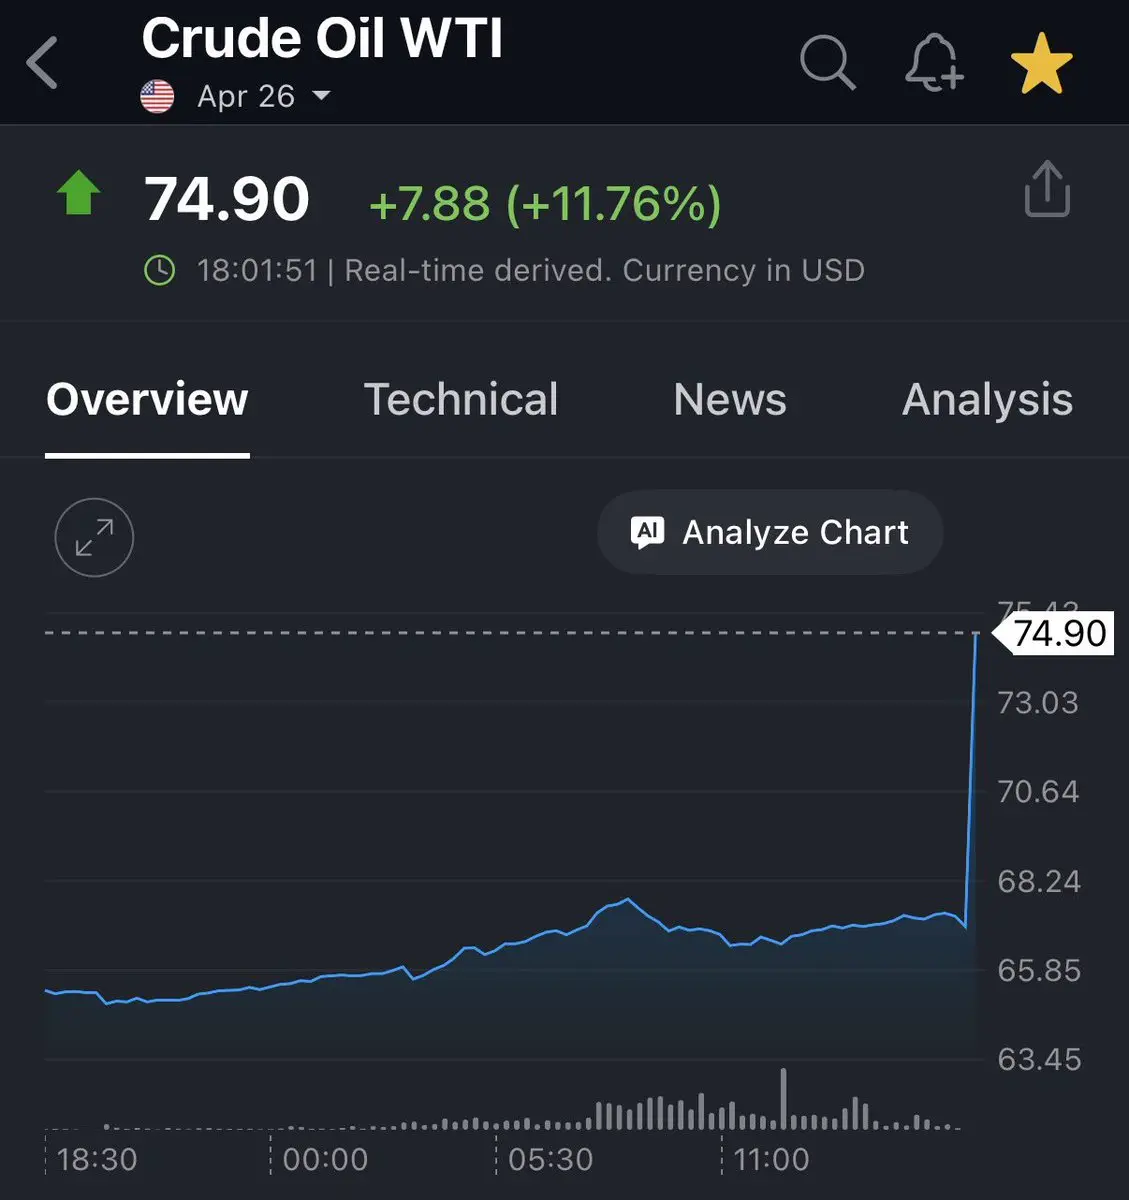
Oil surged almost 12% in the open.
Energy supercycle incoming?
Energy supercycle incoming?
- Reward
- like
- Comment
- Repost
- Share
🚨 JUST IN: Oil surges 12% to $75 per barrel as the US–Israel conflict with Iran escalates.
Why this matters:
Iran sits near the Strait of Hormuz — a key route where ~20% of global oil supply passes.
If that flow is threatened, prices spike fast.
Markets are now pricing in:
• Supply disruption risk
• Higher inflation pressure
• More volatility in stocks & crypto
Energy up. Risk assets on watch.
If oil keeps climbing, expect bigger moves across global markets.
Are we heading toward $80+ next? 👀

- Reward
- like
- Comment
- Repost
- Share
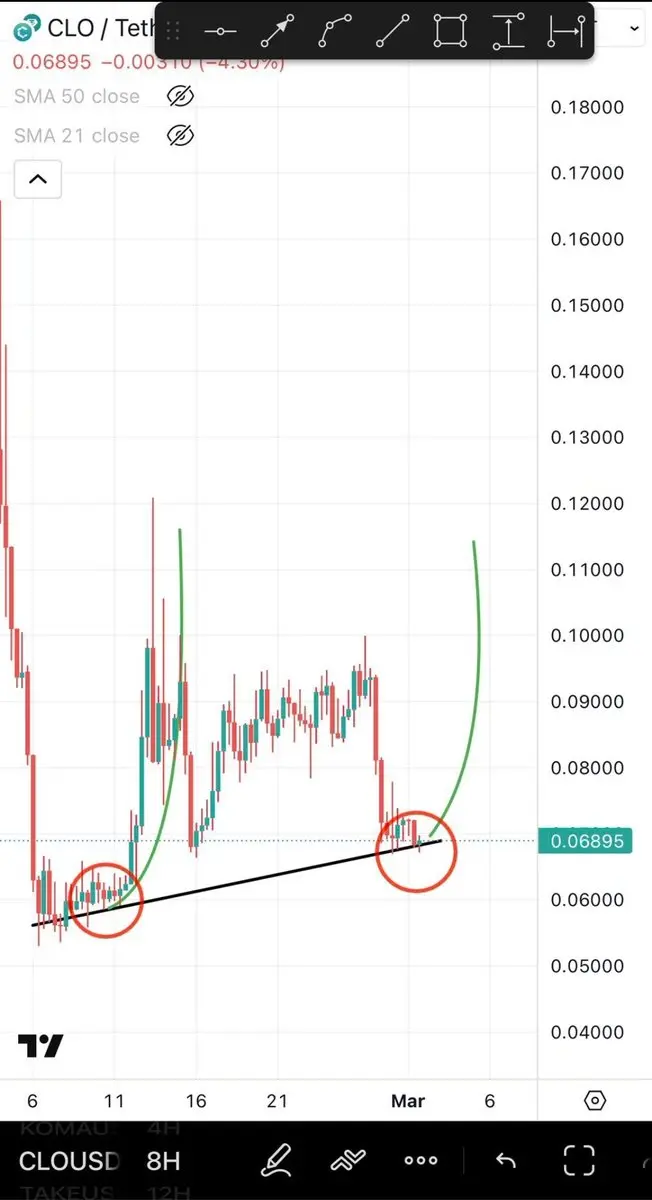
$CLO should start moving up from here as it repeats the same exact price action it did before it previously ran 150%
I’ve seen this pattern too many times & it almost always prints💰 $CLO
Chart looking pretty bullish cup & handle pattern with a very profitable technical target $CELO #TrumpordersfederalbanonAnthropicAI #USIsraelStrikesIranBTCPlunges
I’ve seen this pattern too many times & it almost always prints💰 $CLO
Chart looking pretty bullish cup & handle pattern with a very profitable technical target $CELO #TrumpordersfederalbanonAnthropicAI #USIsraelStrikesIranBTCPlunges
CELO-0,66%
- Reward
- like
- Comment
- Repost
- Share
DDR
内存条
Created By@AJourneyThroughMountainsAnd
Listing Progress
0.00%
MC:
$2.38K
More Tokens

- Reward
- like
- Comment
- Repost
- Share
The small oil deal opened on Friday was satisfying.
View Original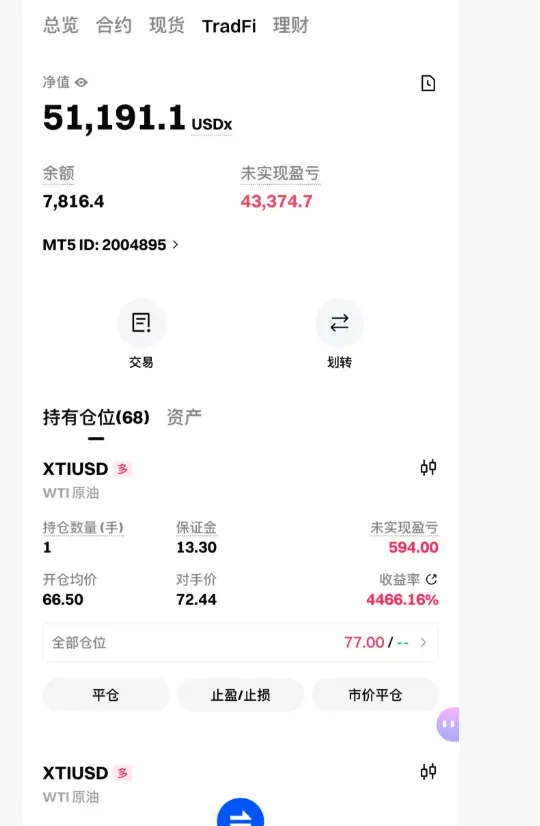
- Reward
- like
- Comment
- Repost
- Share
When capital flow opens the floodgates, is XRP futures a cash machine or an emotion harvesting machine?
Recently, whenever the market opens, the capital flow in XRP futures is like a suddenly fueled sports car — roaring forward with a bang. Open interest soars, trading volume expands, funding rates become volatile, and the atmosphere is immediately electrified. But here’s the question: is this the prelude to a trend taking off, or a fireworks warehouse built on leverage?
Step one, don’t be fooled by the “liveliness.” A surge in capital flow essentially indicates growing disagreement. Bulls thi
XRP-2,03%


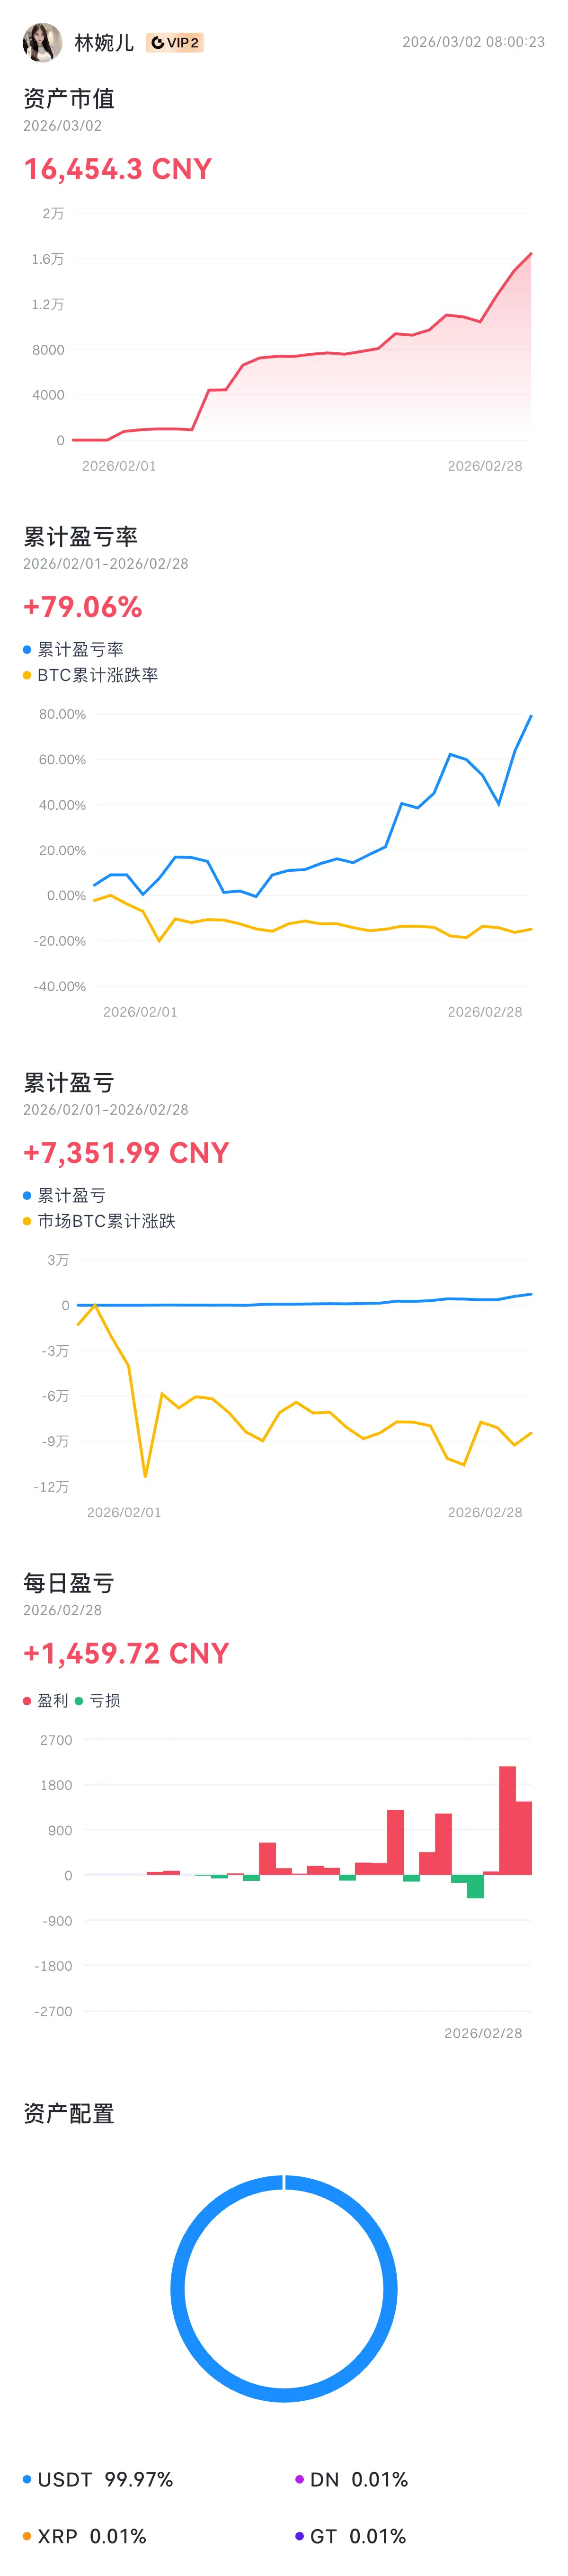
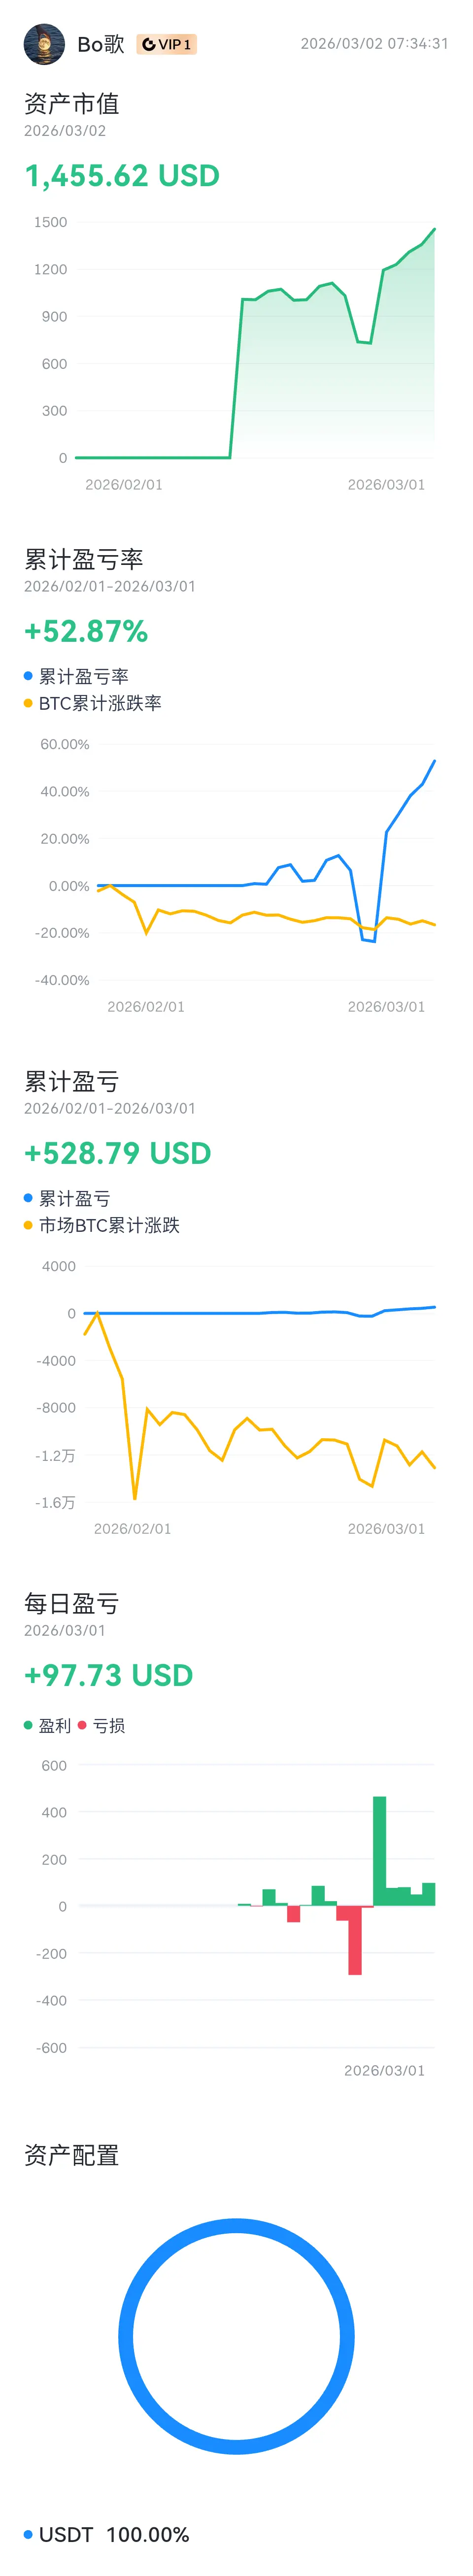
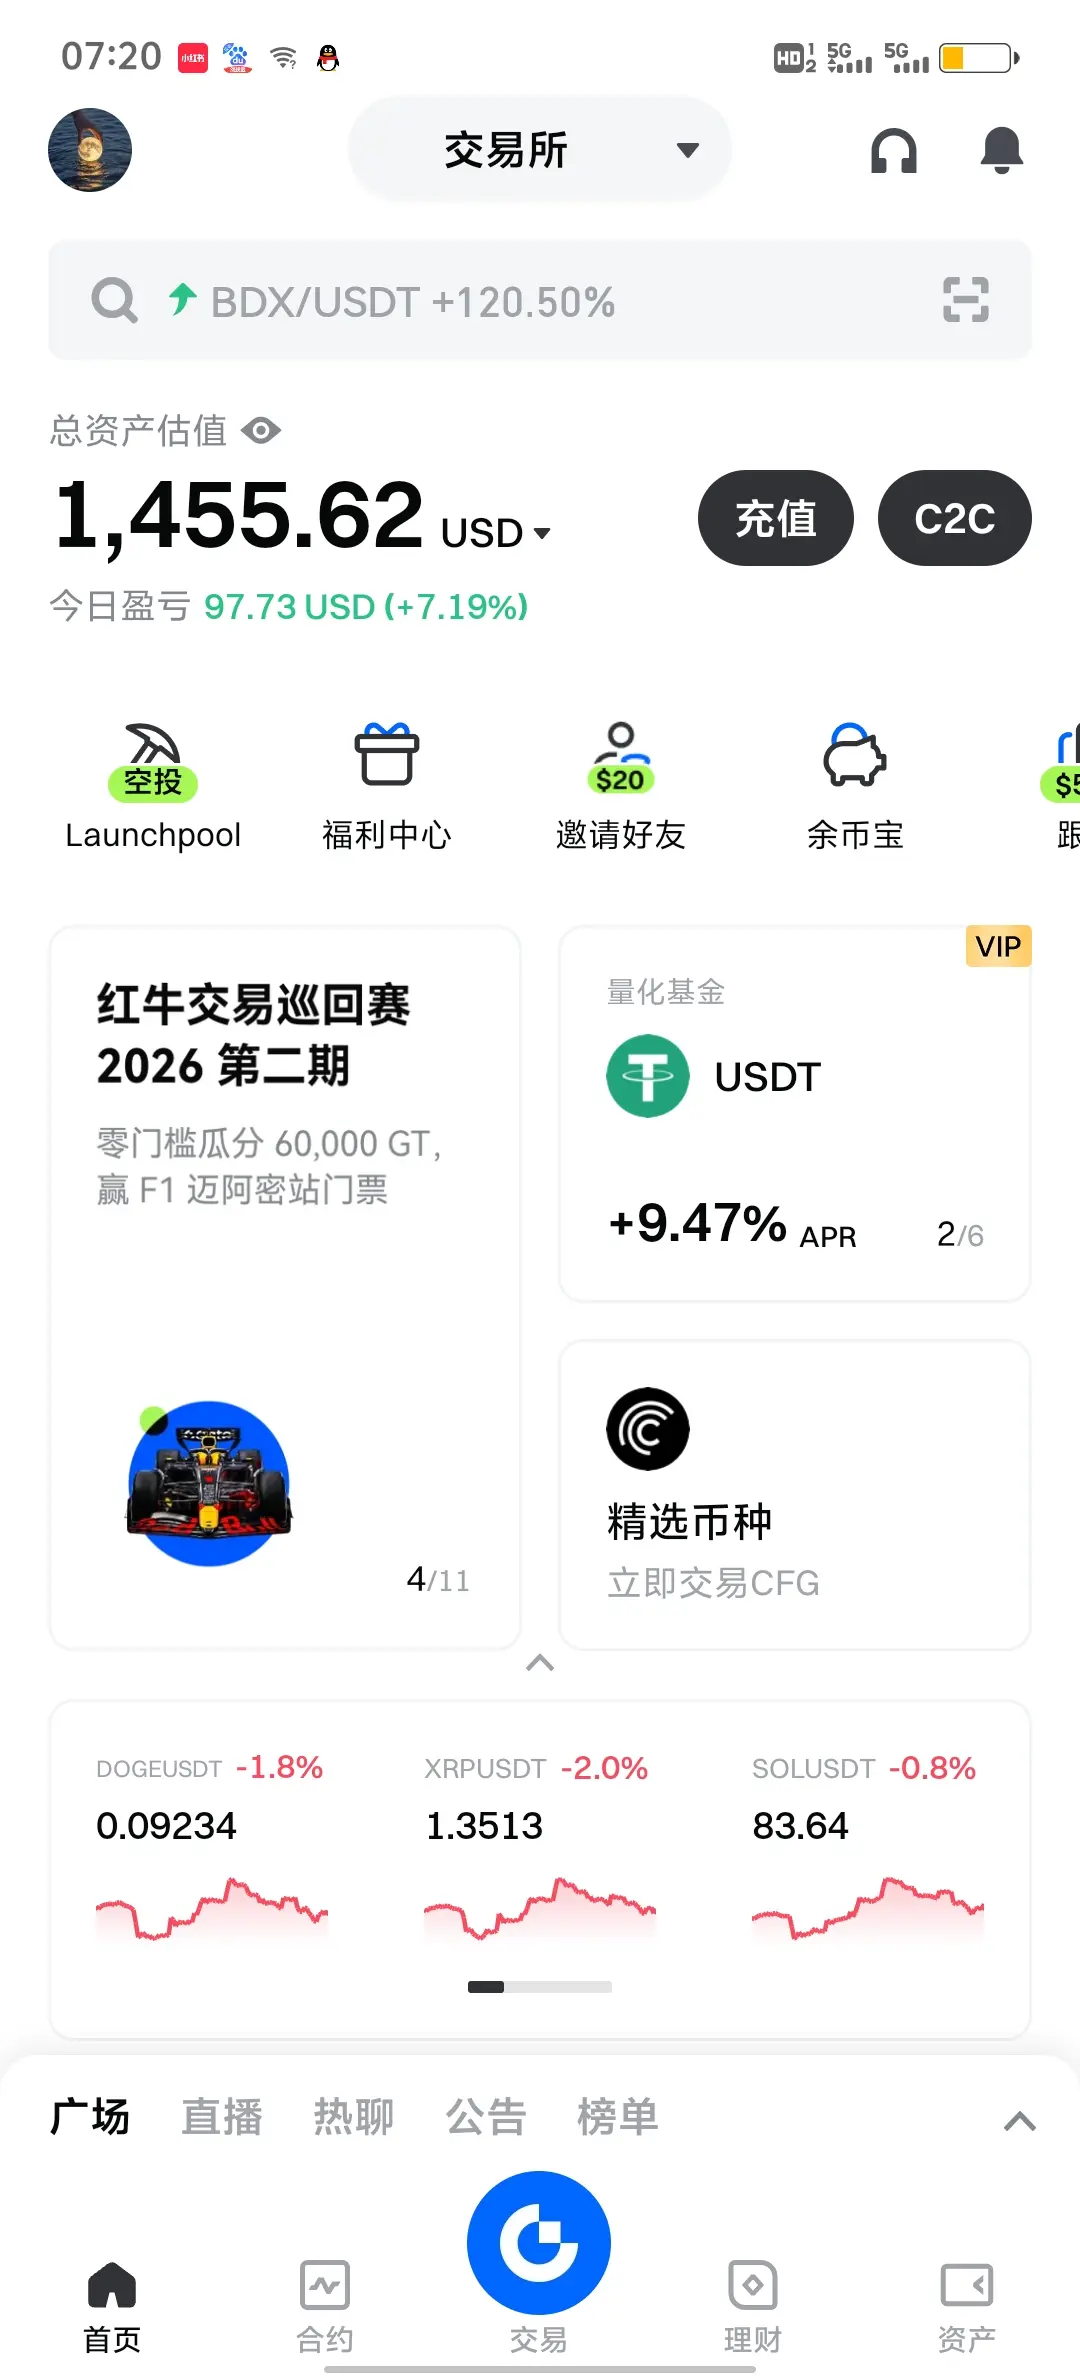
[The user has shared his/her trading data. Go to the App to view more.]
- Reward
- 2
- 1
- Repost
- Share
CoinWay :
:
Good luck and prosperity 🧧
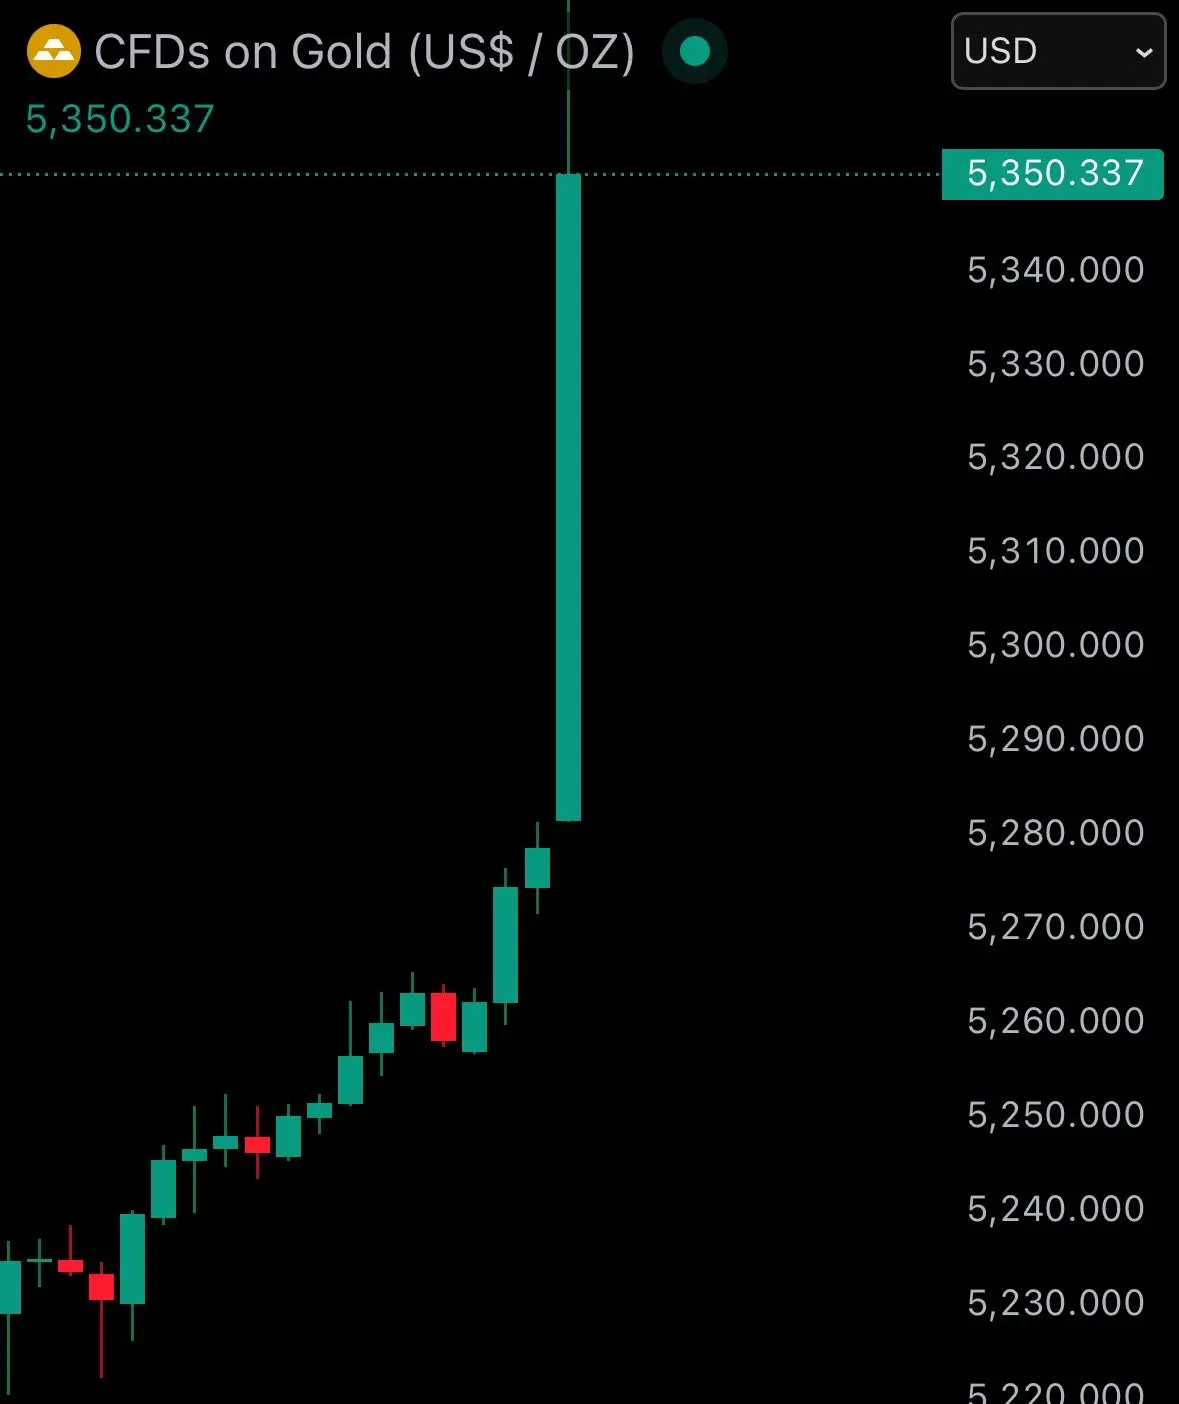
Gold Reclaims $5,350 — Bulls Back in Control
Gold has stormed back above the $5,350 mark, signaling renewed momentum in the precious-metals space. The rebound comes as traders rotate into hard assets amid heightened macro uncertainty, softer risk appetite, and persistent inflation hedging.
Market watchers say the move reinforces gold’s role as the ultimate safe haven, with technicals flashing strength after a brief consolidation. If buying pressure holds, attention now turns to whether this breakout can be sustained—or if profit-taking lurks just ahead.

- Reward
- like
- Comment
- Repost
- Share


Everything reminds me of him 😈

- Reward
- like
- Comment
- Repost
- Share
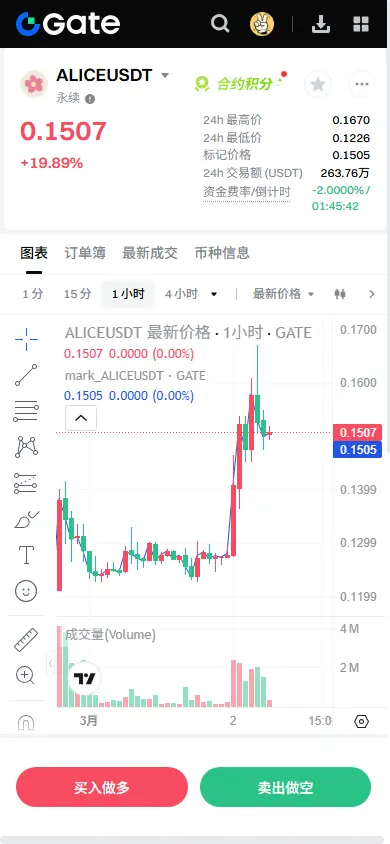
【$ALICE Signal】Pullback to Long + Main Force Supports Short Squeeze
$ALICE 1H timeframe is consolidating strongly above a critical support zone, digesting yesterday's 20% sharp rally. A single massive bullish candle on the 4H chart confirms a trend reversal. The current price retracement to EMA20(1H) and the previous breakout level presents an excellent second-entry opportunity. Negative funding rate (-0.1%) combined with stable open interest indicates that bears are under short squeeze pressure, and main force is clearly supporting the market.
🎯Direction: Long (Long)
⚡Entry/Order: 0.14 - 0.1
View Original$ALICE 1H timeframe is consolidating strongly above a critical support zone, digesting yesterday's 20% sharp rally. A single massive bullish candle on the 4H chart confirms a trend reversal. The current price retracement to EMA20(1H) and the previous breakout level presents an excellent second-entry opportunity. Negative funding rate (-0.1%) combined with stable open interest indicates that bears are under short squeeze pressure, and main force is clearly supporting the market.
🎯Direction: Long (Long)
⚡Entry/Order: 0.14 - 0.1
- Reward
- like
- Comment
- Repost
- Share
💡 PARTNERSHIP
#InventMoneyApp x #M_Pesa 🚀
@M_Pesa empowers millions with mobile money. InventMoneyApp empowers millions with crypto earnings. Together: instant USDT withdrawals + global reach.Tagging @inventmoneyapp + @SafaricomPLC
Top 3 pitches win 2,500 $INVENT 🔥
#InventMoneyApp x #M_Pesa 🚀
@M_Pesa empowers millions with mobile money. InventMoneyApp empowers millions with crypto earnings. Together: instant USDT withdrawals + global reach.Tagging @inventmoneyapp + @SafaricomPLC
Top 3 pitches win 2,500 $INVENT 🔥

- Reward
- like
- Comment
- Repost
- Share
F
飞驰人生
Created By@DonaldLiuTao
Subscription Progress
0.00%
MC:
$0
More Tokens
[The user has shared his/her trading data. Go to the App to view more.]
- Reward
- like
- Comment
- Repost
- Share
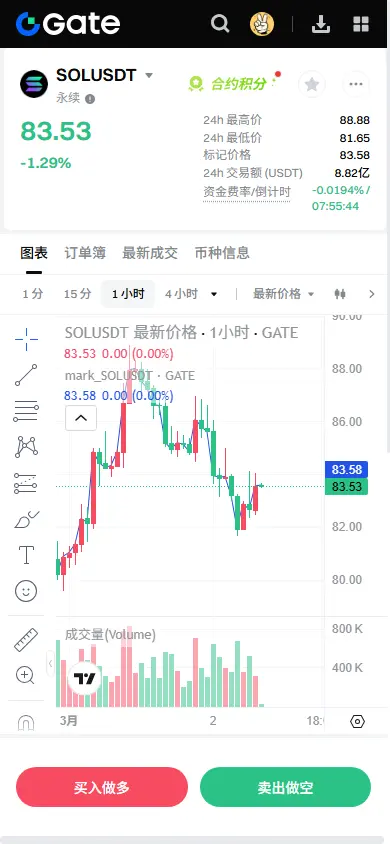
【$SOL Signal】Pullback to Long + 1H RSI Bottom Divergence, Clear Sign of Main Force Supporting the Market
$SOL The 1H timeframe is oscillating near a critical support zone (83.0-83.5), forming a bottom. RSI shows bottom divergence signals. Although the 4H timeframe is in a downtrend channel, open interest (OI) remains stable. Price declines have not triggered capital outflows, indicating that the main force may be supporting the market or accumulating positions. Buy orders are concentrated around 83.5 on the 1H chart, with strong support in the 83.0-83.3 range. Combined with 1H RSI divergence,
View Original$SOL The 1H timeframe is oscillating near a critical support zone (83.0-83.5), forming a bottom. RSI shows bottom divergence signals. Although the 4H timeframe is in a downtrend channel, open interest (OI) remains stable. Price declines have not triggered capital outflows, indicating that the main force may be supporting the market or accumulating positions. Buy orders are concentrated around 83.5 on the 1H chart, with strong support in the 83.0-83.3 range. Combined with 1H RSI divergence,
- Reward
- like
- Comment
- Repost
- Share
#DeepCreationCamp GateToken (GT) is currently in a accumulation phase after experiencing prolonged downward pressure from its previous highs. The price action indicates that the token is attempting to establish a stable base near a major demand zone, where buyers have started absorbing selling pressure. However, momentum remains relatively weak, suggesting that the market is still waiting for a strong catalyst.
On the daily timeframe, GT is trading below the key moving averages, maintaining a slightly bearish overall structure. The 50-day moving average acts as a dynamic resistance, while the
On the daily timeframe, GT is trading below the key moving averages, maintaining a slightly bearish overall structure. The 50-day moving average acts as a dynamic resistance, while the
GT-1,71%

- Reward
- like
- Comment
- Repost
- Share
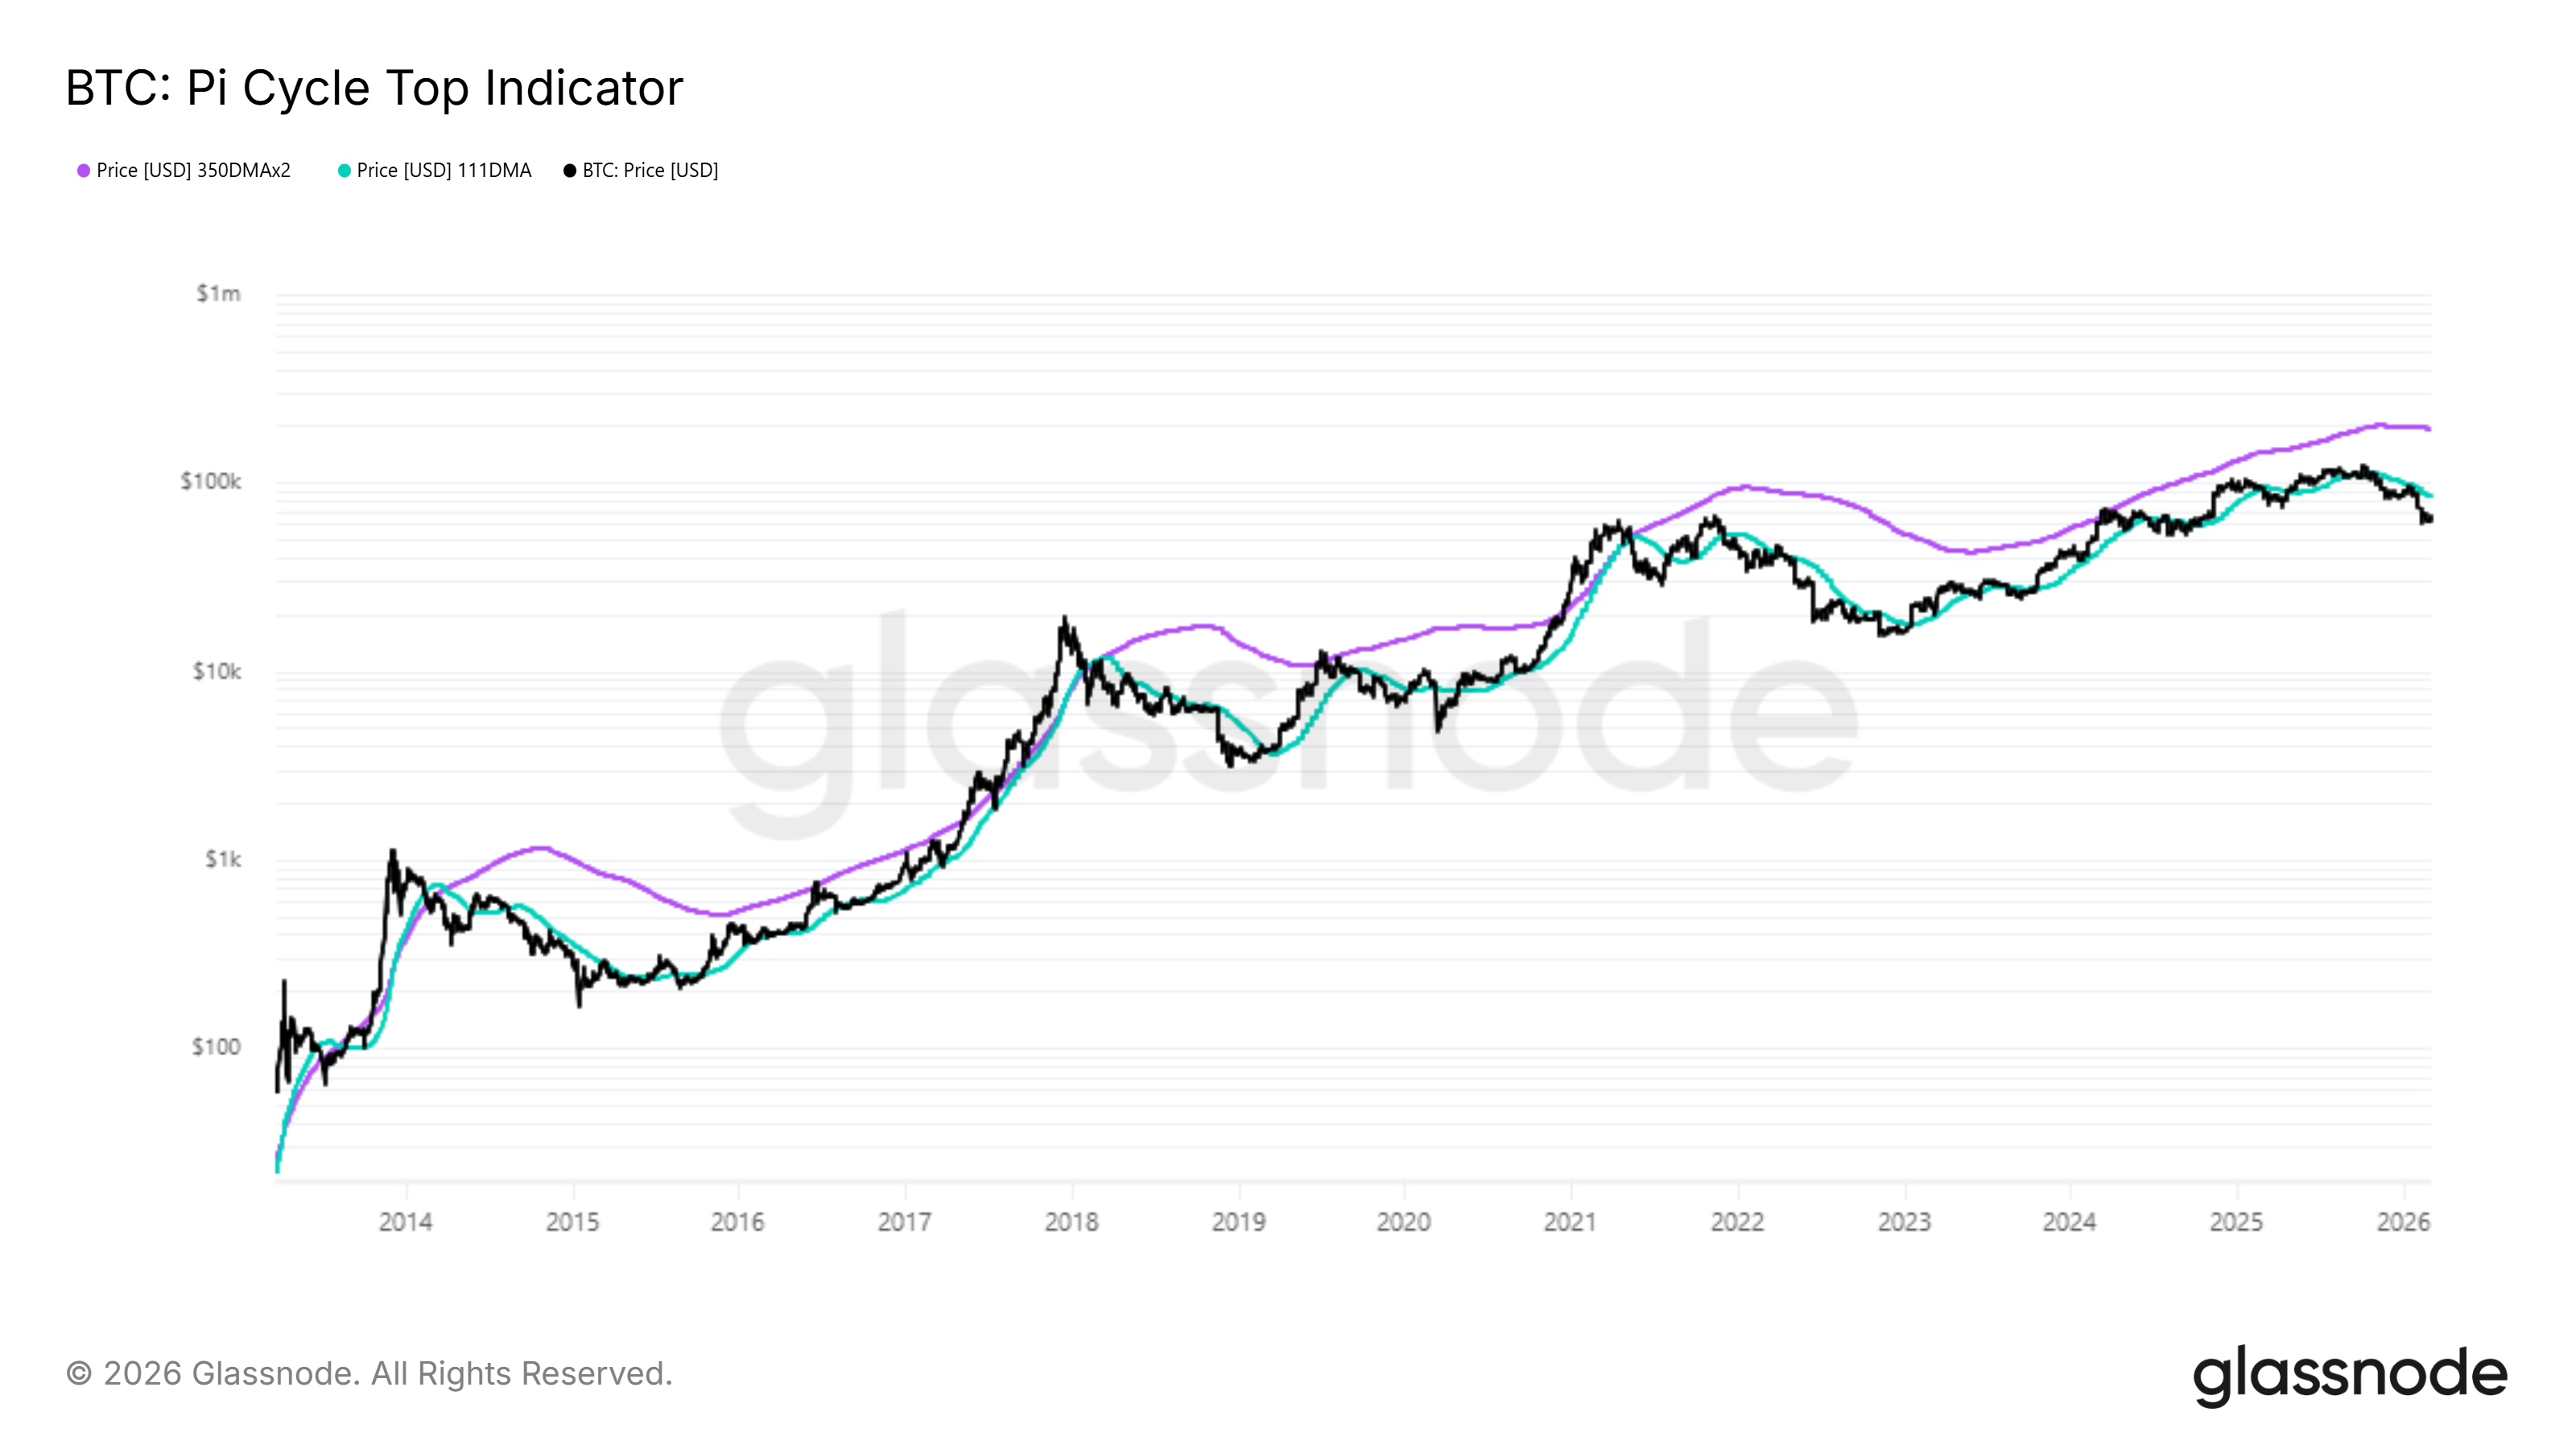
The Bitcoin bear market may worsen despite recent recovery
Bitcoin remains below $70,000 amid ongoing downward pressure.
The Pi Cycle indicator indicates a bearish accumulation phase in the middle of the cycle.
The Bitcoin SOPR indicator below 1 shows investors are selling at a loss.
Promo
$BTC
#BTC
$BTC
Bitcoin remains below $70,000 amid ongoing downward pressure.
The Pi Cycle indicator indicates a bearish accumulation phase in the middle of the cycle.
The Bitcoin SOPR indicator below 1 shows investors are selling at a loss.
Promo
$BTC
#BTC
$BTC
BTC-1,84%
- Reward
- like
- Comment
- Repost
- Share
- Reward
- like
- Comment
- Repost
- Share
🔹 Morgan Stanley seeks National Trust Bank charter for crypto custody.
1.329
- Reward
- 1
- Comment
- Repost
- Share
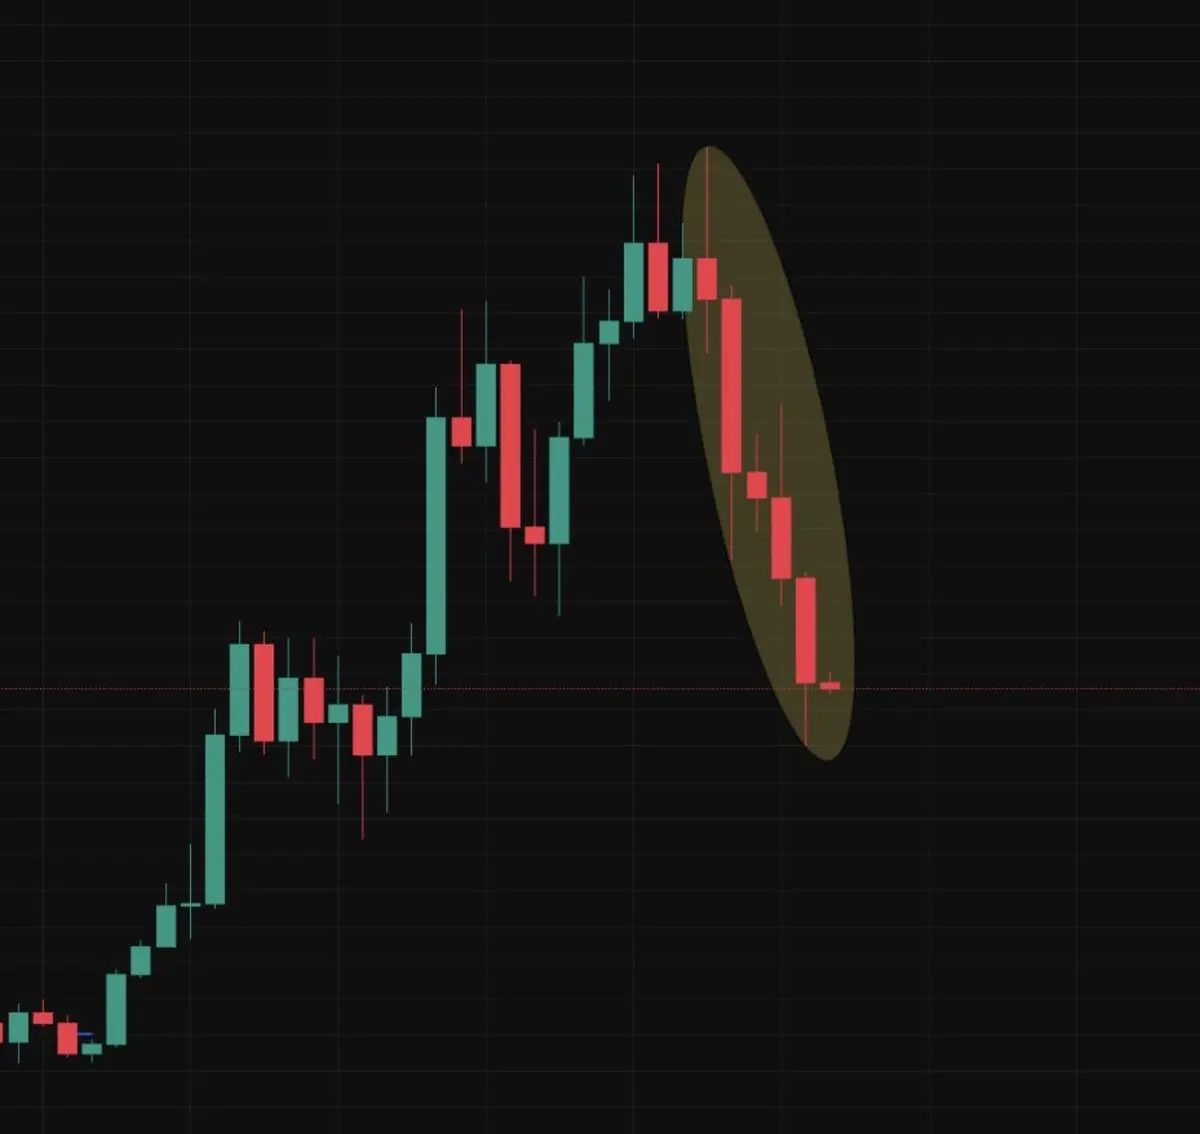
This was arguably the most painful drawdown in Bitcoin history. 6 straight months of blood with no blow off top.
Absolute carnage in the market.
Absolute carnage in the market.
BTC-1,84%
- Reward
- like
- Comment
- Repost
- Share
Load More
Join 40M users in our growing community
⚡️ Join 40M users in the crypto craze discussion
💬 Engage with your favorite top creators
👍 See what interests you
Trending Topics
View More42.47M Popularity
167.31K Popularity
148.97K Popularity
1.68M Popularity
531.98K Popularity
Hot Gate Fun
View More- MC:$2.37KHolders:10.00%
- MC:$0.1Holders:10.00%
- MC:$2.38KHolders:10.00%
- MC:$2.43KHolders:20.14%
- MC:$2.38KHolders:10.00%
News
View MoreBitcoin treasury company EmperyDigital's third-largest shareholder requests to sell 3,723 BTC and return cash
2 m
SlovakBitcoin developer releases a proof-of-concept transaction embedding a 66kB image, challenging the BIP-110 data size limit proposal
3 m
War-time Verification: Hyperliquid is the first choice for hedging during crises, with 24/7 trading being its biggest advantage
3 m
Vitalik outlines the Ethereum execution layer roadmap, focusing on changes to the state tree and the virtual machine.
6 m
Platform X introduces "Paid Collaboration" tag feature to enhance content transparency
10 m
Pin