Trade
Basic
Futures
Futures
Hundreds of contracts settled in USDT or BTC
Options
HOT
Trade European-style vanilla options
Unified Account
Maximize your capital efficiency
Demo Trading
Futures Kickoff
Get prepared for your futures trading
Futures Events
Futures Mall
Participate in events to win generous rewards
Demo Trading
Use virtual funds to experience risk-free trading
Earn
Launch
CandyDrop
Collect candies to earn airdrops
Launchpool
Quick staking, earn potential new tokens
HODLer Airdrop
Hold GT and get massive airdrops for free
Launchpad
Be early to the next big token project
Alpha Points
NEW
Trade on-chain assets and enjoy airdrop rewards!
Futures Points
NEW
Earn futures points and claim airdrop rewards
Investment
Simple Earn
Earn interests with idle tokens
Auto-Invest
Auto-invest on a regular basis
Dual Investment
Buy low and sell high to take profits from price fluctuations
Soft Staking
Earn rewards with flexible staking
Crypto Loan
0 Fees
Pledge one crypto to borrow another
Lending Center
One-stop lending hub
VIP Wealth Hub
Customized wealth management empowers your assets growth
Private Wealth Management
Customized asset management to grow your digital assets
Quant Fund
Top asset management team helps you profit without hassle
Staking
Stake cryptos to earn in PoS products
Smart Leverage
NEW
No forced liquidation before maturity, worry-free leveraged gains
GUSD Minting
Use USDT/USDC to mint GUSD for treasury-level yields
More
Goodsman
On January 23, Delphi Digital published an article stating, "Bitcoin prices are stagnating while gold continues to rise. The reason may lie in Japanese government bonds. Typically, rising yields increase the opportunity cost of holding yieldless assets, thereby putting pressure on gold. But when gold and yields rise together, the market is actually pricing in policy pressures and balance sheet vulnerabilities rather than economic growth.
The yield on the 10-year Japanese government bond is currently about 3.65 standard deviations above its long-term average. The Bank of Japan structurally hold
The yield on the 10-year Japanese government bond is currently about 3.65 standard deviations above its long-term average. The Bank of Japan structurally hold
BTC0,61%


- Reward
- like
- Comment
- Repost
- Share
Check out Gate and join me in the hottest event! https://www.gate.com/campaigns/3871?ref=VLIWBLOKUW&ref_type=132
- Reward
- 2
- 1
- Repost
- Share
Discovery:
2026 GOGOGO 👊nether
冥币
Created By@SecondDimension炒BI人
Listing Progress
0.00%
MC:
$3.42K
Create My Token
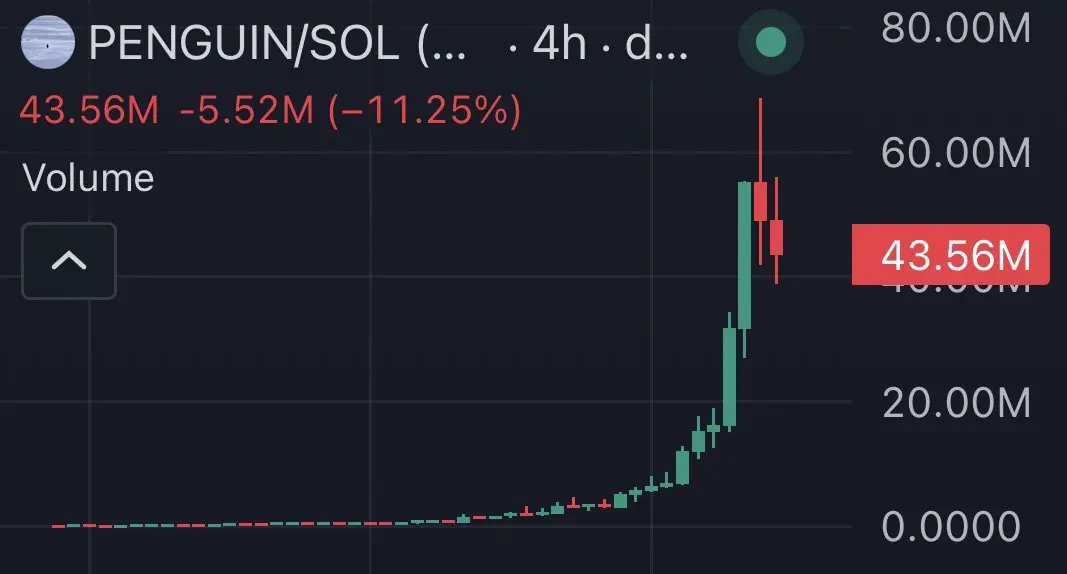
47m$ volume on memeLast time we saw this was $PNUTIt went to a 2.5BHigher
- Reward
- like
- Comment
- Repost
- Share
What is Shandong Xue? Is it Yixue? What does 😈 mean?
View Original
- Reward
- like
- Comment
- Repost
- Share
One wordWOW!!!$PENGUIN is going CrAZy!!!
- Reward
- like
- Comment
- Repost
- Share

- Reward
- 3
- Comment
- Repost
- Share
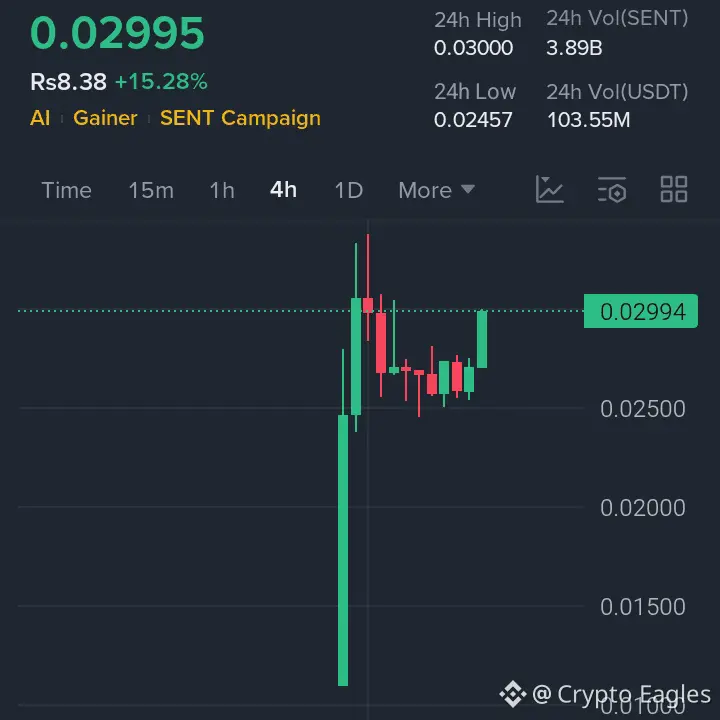
$SENT Explosive Breakout AI Bulls Hunting New Highs🔥
Entry Zone: 0.0285 – 0.0300
Bullish Above: 0.0265
TP1: 0.0335
TP2: 0.0400
TP3: 0.0520
Stop Loss: 0.0245
Entry Zone: 0.0285 – 0.0300
Bullish Above: 0.0265
TP1: 0.0335
TP2: 0.0400
TP3: 0.0520
Stop Loss: 0.0245
- Reward
- like
- Comment
- Repost
- Share
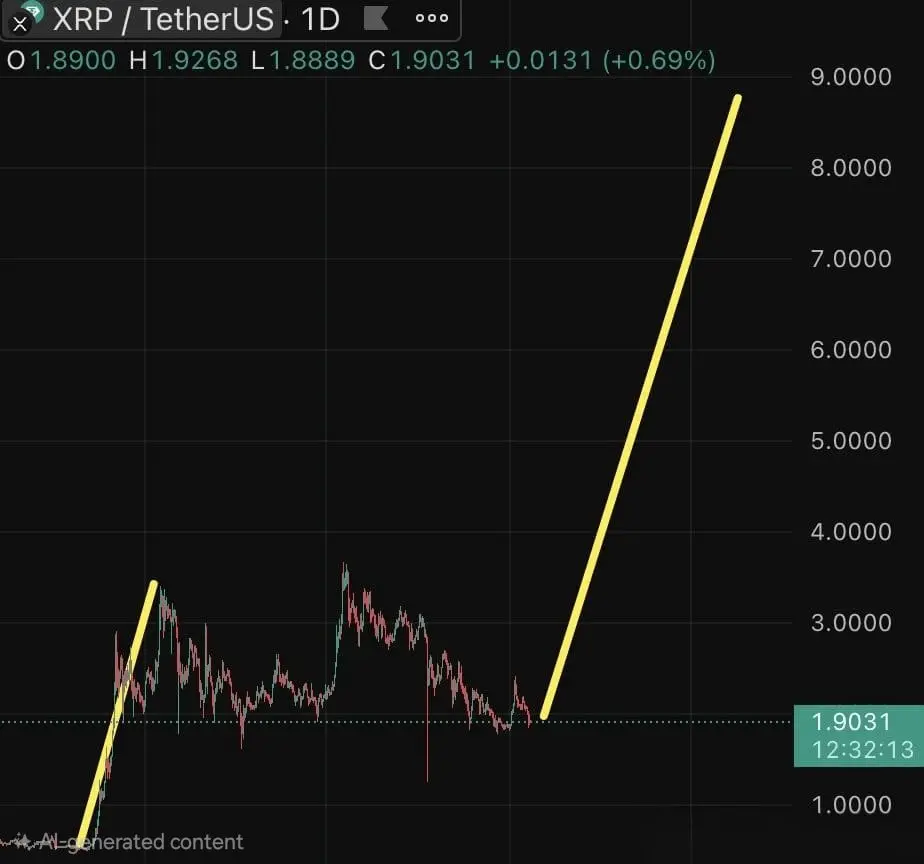
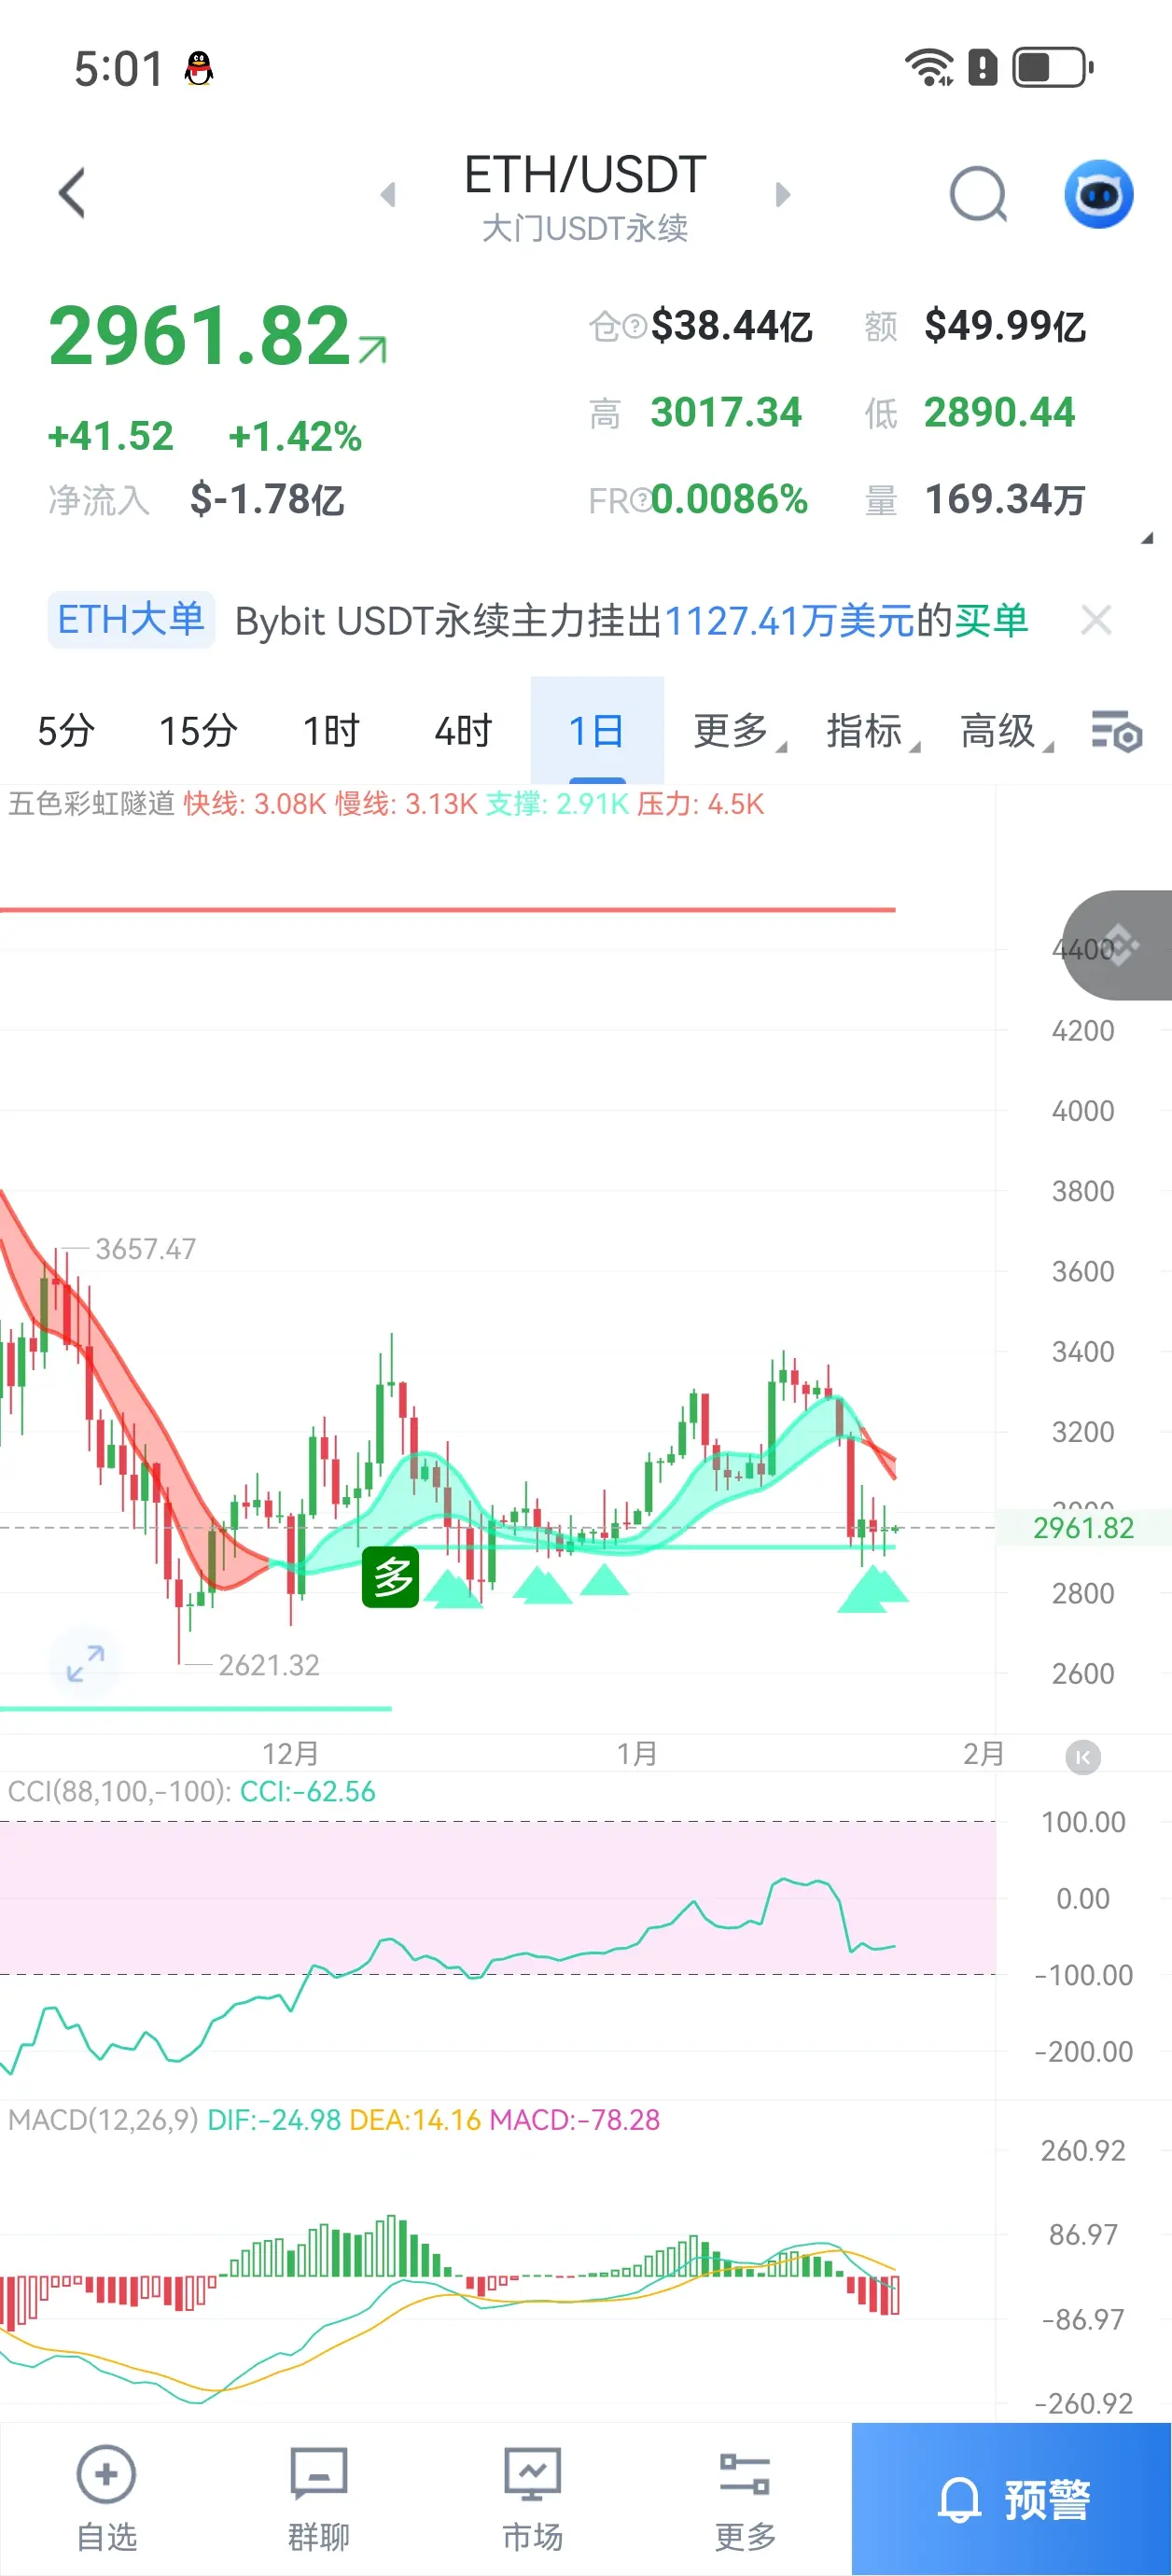
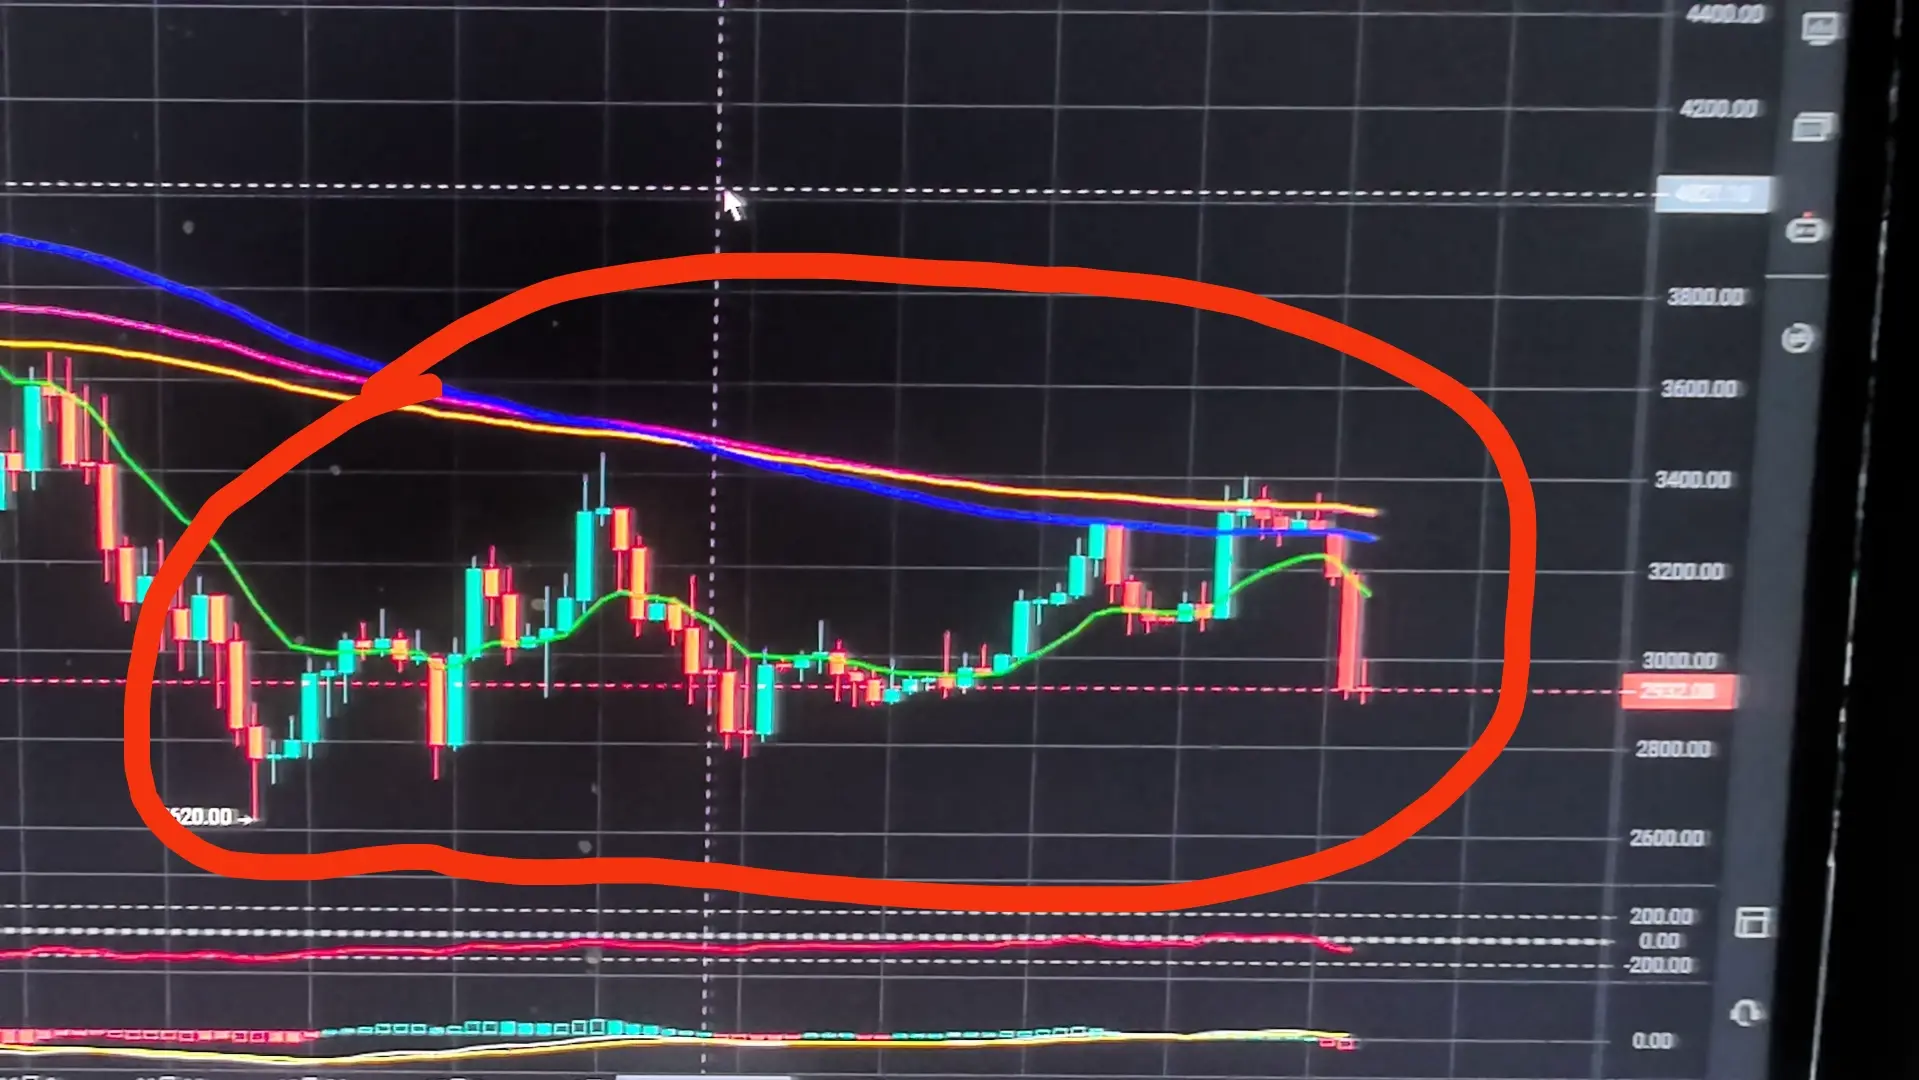
Price Trend Analysis
1. Candlestick Patterns:
- Recent prices have been oscillating around 3000 points, failing to break through the previous high of 3038, with support levels around 2900.
- Daily candlesticks show a series of small rebounds, but overall remain in the recovery phase after a previous sharp decline, with limited volatility.
2. Technical Indicators:
- MACD: In the 4-hour cycle, both DIF and DEA are below the zero line, with the MACD histogram gradually shortening, indicating weakening bearish momentum but not yet turning bullish.
- RSI: The RSI(14) value hovers around 40, n
View Original1. Candlestick Patterns:
- Recent prices have been oscillating around 3000 points, failing to break through the previous high of 3038, with support levels around 2900.
- Daily candlesticks show a series of small rebounds, but overall remain in the recovery phase after a previous sharp decline, with limited volatility.
2. Technical Indicators:
- MACD: In the 4-hour cycle, both DIF and DEA are below the zero line, with the MACD histogram gradually shortening, indicating weakening bearish momentum but not yet turning bullish.
- RSI: The RSI(14) value hovers around 40, n
- Reward
- like
- Comment
- Repost
- Share
I am calling the next $PENGUIN todayI need five new twitter subscribers todayI will print for the subscribers todayI love all my subscribers, I am gonna make them so much money today.Don’t ever fade me.

- Reward
- like
- Comment
- Repost
- Share

- Reward
- like
- Comment
- Repost
- Share
The above warning was not triggered; the one below was triggered first. Let's迎接the final drop together.
View Original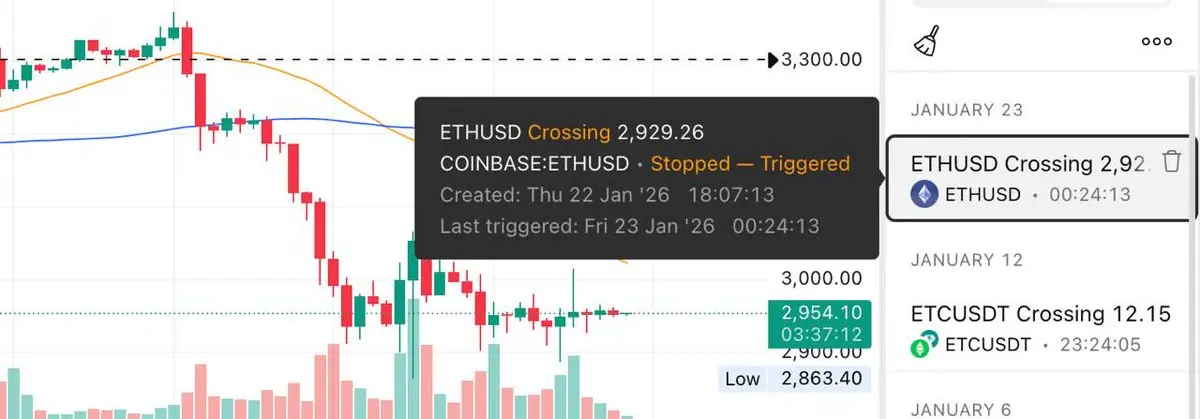
- Reward
- like
- Comment
- Repost
- Share
# Trading Bot #我正在 Gate uses Snowball USDT Contract Martingale Bot, with a total return since creation of +131.95%
#btc #黄金白银再创新高 #特朗普取消对欧关税威胁 #比特币相对黄金进入深度弱势
#btc #黄金白银再创新高 #特朗普取消对欧关税威胁 #比特币相对黄金进入深度弱势
BTC0,61%
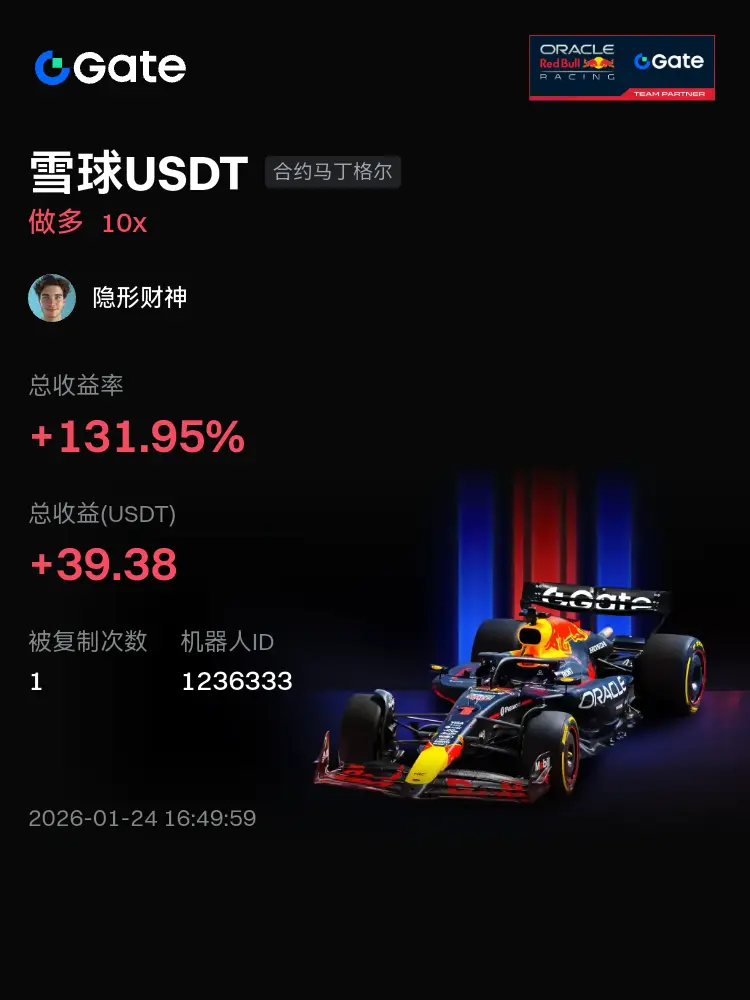
[The user has shared his/her trading data. Go to the App to view more.]
- Reward
- 1
- Comment
- Repost
- Share
hjsd
黄金时代
Created By@FinancialFreedomTrading
Listing Progress
0.00%
MC:
$3.42K
Create My Token

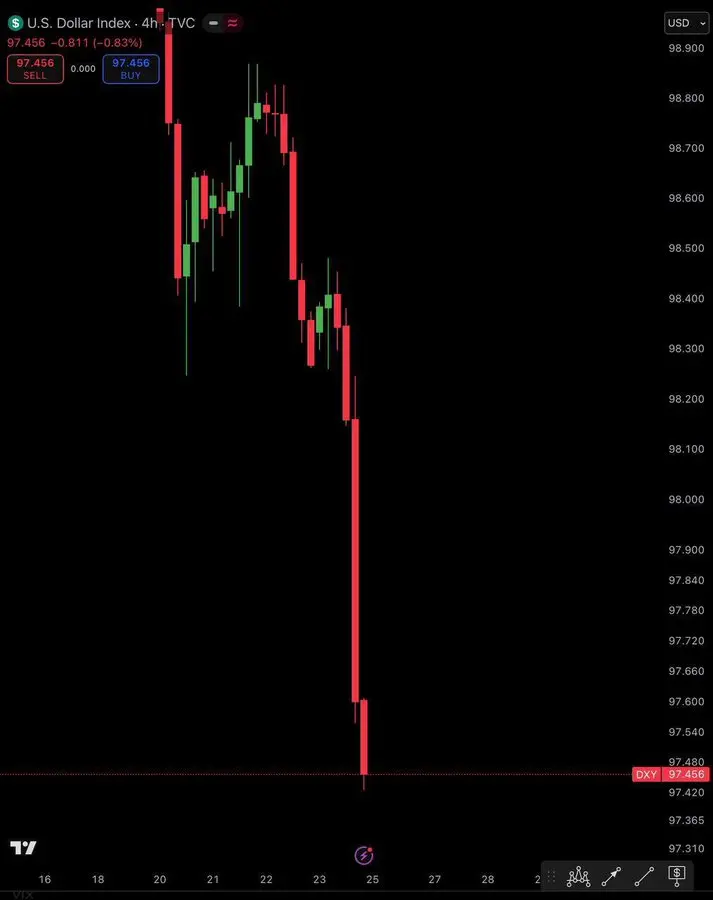
The U.S. dollar index fell below the 98 level down 0.30percent intraday.
355
- Reward
- 1
- Comment
- Repost
- Share

- Reward
- 1
- 3
- Repost
- Share
GateUser-4284a16e :
:
Exchange data manipulationView More
I feed the current Zama data into ChatGPT and then tell it that the most appropriate bidding range is between 0.03-0.04. What do you think Zama should bid appropriately? Data:
View Original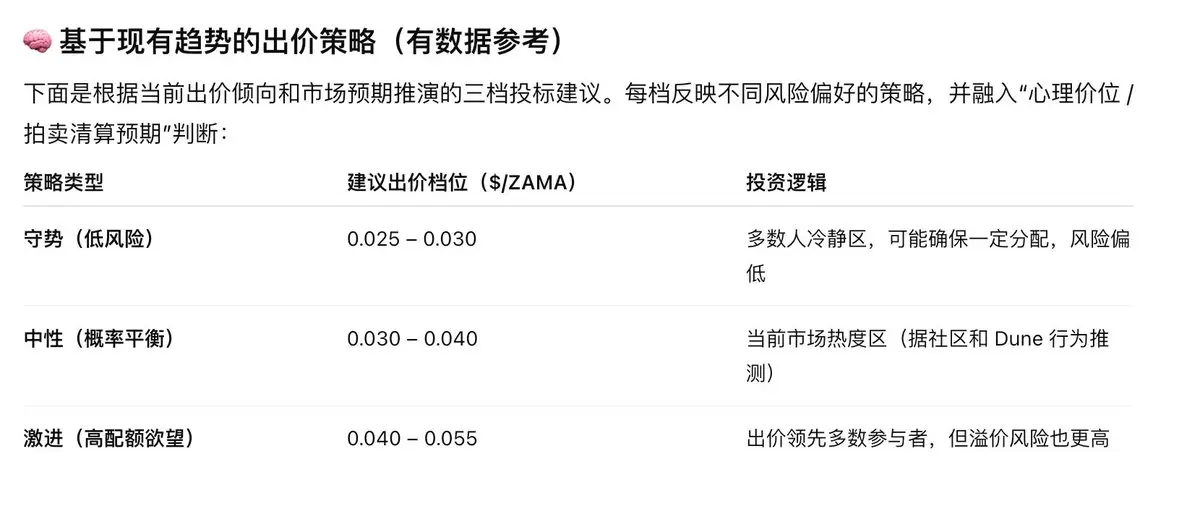
- Reward
- 1
- Comment
- Repost
- Share
Breaking news: The dollar crashes, bullish Bitcoin surge is imminent. The decline may be temporary, and key signals to watch include: Will DXY break below 97.00? This would be the technical confirmation of the dollar entering a bear market. Can Bitcoin hold steady at $91,000? This is the dividing line between short-term bullish and bearish forces.
BTC0,61%
- Reward
- like
- Comment
- Repost
- Share
Hey, I'm just trying this out now, hahaha. I don't know what to type, even up to 50 characters, so bored. After this, I want to go back to work. That's all, hehe.
View Original

- Reward
- like
- Comment
- Repost
- Share
Load More
Join 40M users in our growing community
⚡️ Join 40M users in the crypto craze discussion
💬 Engage with your favorite top creators
👍 See what interests you
Trending Topics
View More43.05K Popularity
25.56K Popularity
18.6K Popularity
4.33K Popularity
12.77K Popularity
Hot Gate Fun
View More- MC:$3.85KHolders:23.65%
- MC:$3.44KHolders:20.00%
- MC:$3.47KHolders:20.00%
- MC:$3.42KHolders:10.00%
- MC:$3.47KHolders:20.09%
News
View MoreBiyaPay Analyst: The US's two major regulators rarely join forces, with the SEC and CFTC accelerating "pro-crypto" regulatory integration
3 m
Community users call on the X product team to strengthen the cleanup of scam accounts; the relevant team has already intervened.
44 m
Analysis: Bitcoin developers are accelerating efforts to address quantum risks
52 m
SOMI breaks above 0.25 USDT, 24H increase of 44.61%
1 h
MGBX is about to launch "Snowball Life" spot trading
1 h
Pin