Trade
Basic
Futures
Futures
Hundreds of contracts settled in USDT or BTC
TradFi
Gold
Trade global traditional assets with USDT in one place
Options
Hot
Trade European-style vanilla options
Unified Account
Maximize your capital efficiency
Demo Trading
Futures Kickoff
Get prepared for your futures trading
Futures Events
Participate in events to win generous rewards
Demo Trading
Use virtual funds to experience risk-free trading
Earn
Launch
CandyDrop
Collect candies to earn airdrops
Launchpool
Quick staking, earn potential new tokens
HODLer Airdrop
Hold GT and get massive airdrops for free
Launchpad
Be early to the next big token project
Alpha Points
Trade on-chain assets and enjoy airdrop rewards!
Futures Points
Earn futures points and claim airdrop rewards
Investment
Simple Earn
Earn interests with idle tokens
Auto-Invest
Auto-invest on a regular basis
Dual Investment
Buy low and sell high to take profits from price fluctuations
Soft Staking
Earn rewards with flexible staking
Crypto Loan
0 Fees
Pledge one crypto to borrow another
Lending Center
One-stop lending hub
VIP Wealth Hub
Customized wealth management empowers your assets growth
Private Wealth Management
Customized asset management to grow your digital assets
Quant Fund
Top asset management team helps you profit without hassle
Staking
Stake cryptos to earn in PoS products
Smart Leverage
New
No forced liquidation before maturity, worry-free leveraged gains
GUSD Minting
Use USDT/USDC to mint GUSD for treasury-level yields
More
别当我財
No content yet
别当我財
Yesterday's market was affected by the macro asset storm, and the market once again experienced a "dive." Currently, in terms of Ethereum trend, the price bottomed out at 2673 and then oscillated to recover. On the hourly level, the trend remains weak. The price faced resistance at 2770 and pulled back. According to the attached indicator, the KDJ lines have turned downward again. My personal view for the day is to maintain a bearish outlook. Ethereum: Short at 2742, target 2662. Stop loss 40 points. #BTC #ETH
View Original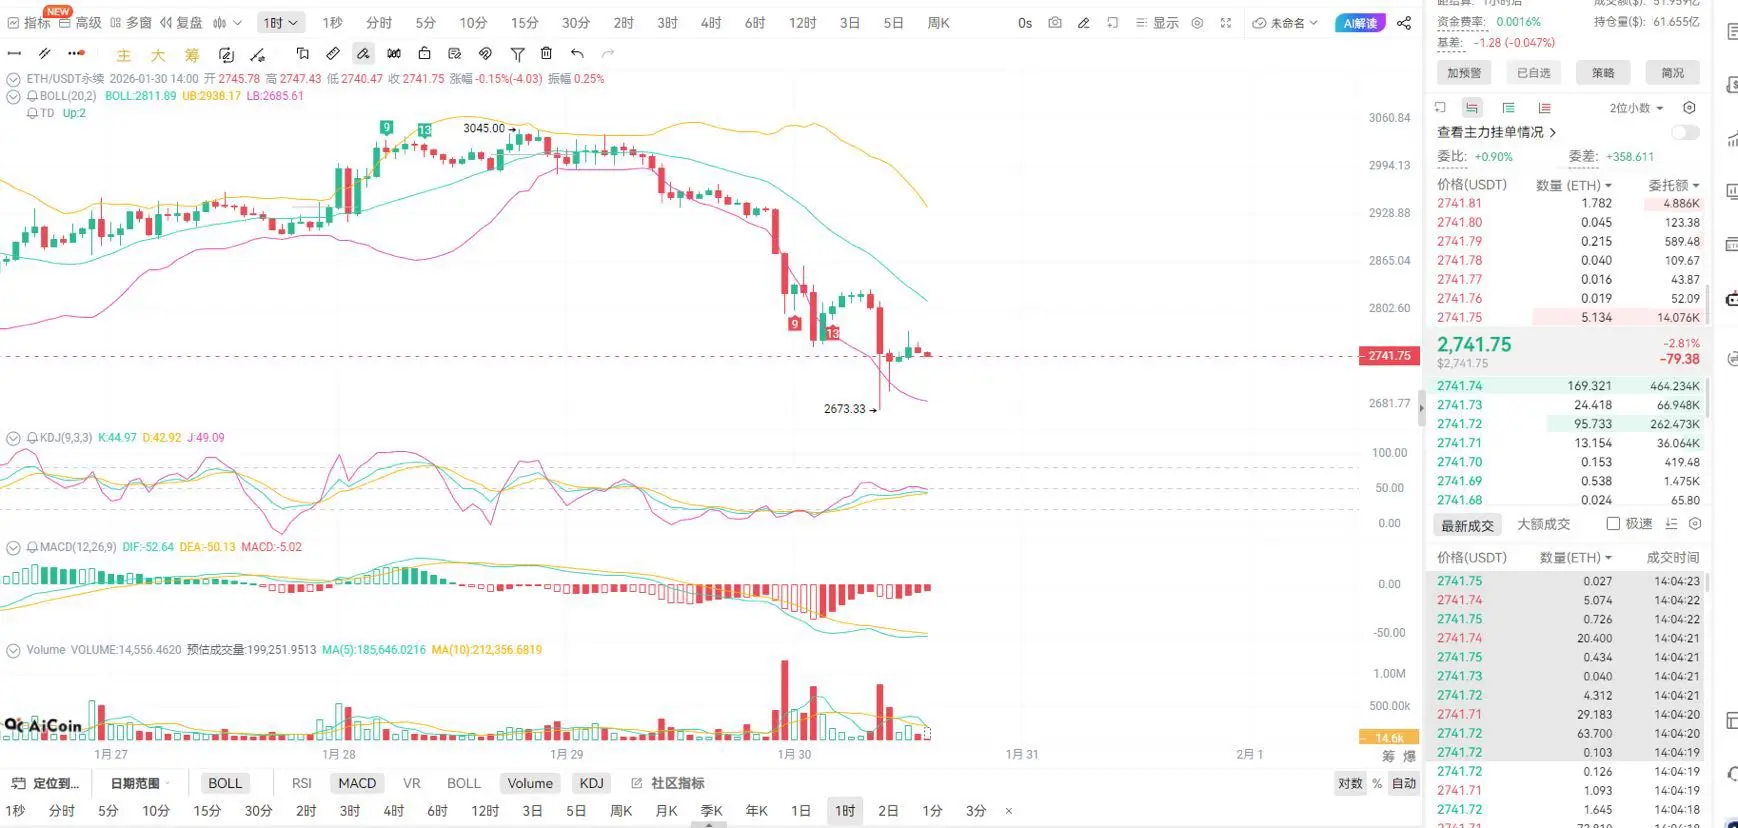
- Reward
- 1
- 1
- Repost
- Share
Korean_Girl :
:
Good brother 👍☺️ Iam a Streamer I hope you join my live streamHundred U Challenge, Ten Thousand U Day 11
2.745 views
2026-01-12 01:22
- Reward
- like
- Comment
- Repost
- Share
Follow the big, oppose the small
4.714 views
2026-01-10 02:11
- Reward
- like
- Comment
- Repost
- Share
#ETH
Conclusion: Slightly small-range rebound in a sideways decline
Warm reminder: Both resistance and support levels can serve as entry points (averaging down points)
eth#加密市场观察
Upper resistance: 3300/3380/3450
Lower support: 3220/3170/3080
Trading strategies:
Long position strategy: If the rebound fails to firmly hold around 3300, establish a short position at the initial entry, with a re-entry point near 3450. Stop loss above 3450 after a breakout and stabilization.
First take profit: 3220 / Second take profit: 3170
Short position strategy: If the pullback fails to break below around 3240
ETH3,33%
- Reward
- 1
- 1
- Repost
- Share
Thynk:
2026 GOGOGO 👊New Year Market
689 views
2026-01-05 15:26
- Reward
- like
- Comment
- Repost
- Share
1.6BTC/ETH Market Outlook:
Bitcoin has been steadily rebounding, testing the previous high of 94,500, with a peak at 94,700 before pulling back. Currently, the price is oscillating around 93,700. The strategy remains unchanged this week: primarily look for long entries on dips to anticipate rebounds. Today, 94,500 will be tested again as a recent high, serving as a confidence point for the bears, a defensive level, and a key entry point for many short positions. The battle for lower prices will inevitably be intense, and this level also attracts many longs to sell. A pullback is normal, and re
View OriginalBitcoin has been steadily rebounding, testing the previous high of 94,500, with a peak at 94,700 before pulling back. Currently, the price is oscillating around 93,700. The strategy remains unchanged this week: primarily look for long entries on dips to anticipate rebounds. Today, 94,500 will be tested again as a recent high, serving as a confidence point for the bears, a defensive level, and a key entry point for many short positions. The battle for lower prices will inevitably be intense, and this level also attracts many longs to sell. A pullback is normal, and re
- Reward
- like
- Comment
- Repost
- Share
2026 1.6SOL
Review on January 5th, yesterday SOL surged to a high of 137.7 in the morning, touching the 4-hour upper band, then rebounded from the top and declined to the middle Bollinger Band at 133. Last night, the price rose above the 4-hour upper band to a high of 139.8, then pulled back to 137. Currently, it is in a downward correction phase. As long as it does not break the MA5, it will continue to rise.
The current 4-hour chart is in a downward correction after an uptrend. If the upward movement does not stabilize, the 4-hour MA5 will continue to decline. The Bollinger Bands are opening
SOL4,42%

- Reward
- like
- Comment
- Repost
- Share
2025.12.31
Review of December 30: Yesterday, SOL was in a continuous oscillating upward trend during the daytime. Last night, the market pulled back to the 4-hour Bollinger Band middle line at 122, rebounded to the current 125, and is now in a zone of oscillating upward movement.
The current 4-hour chart is in a rebound phase after a decline. If the upward movement does not stabilize, the 4-hour MA5 will continue to decline. The Bollinger Bands are opening, with the upper band trending upward, the middle band rising, and the lower band rising—all three lines are trending upward.
The three line
SOL4,42%
- Reward
- like
- Comment
- Repost
- Share
#ETH
Upper resistance: 3060/3120/3180
Lower support: 2990/2960/2900
Warm reminder: Both resistance and support levels can serve as entry points (averaging down points)
Recommended trading strategies:
Long position strategy: If the rebound fails to establish a solid position around 3060, open a short position, with additional entries around 3180. Break above 3180 to confirm, then set stop-loss above 3180.
First take profit: 2990 / Second take profit: 2960
Long position on dips strategy: If the pullback does not break below 2990, establish a long position, with additional entries around 2900. B
ETH3,33%
- Reward
- 3
- Comment
- 1
- Share
The current 4-hour chart is in a retracement phase after a decline. If the price fails to stabilize during the upward move, the 4-hour MA5 will continue to decline. The Bollinger Bands are opening up, with the upper band turning downward, the middle band trending downward, and the lower band moving upward.
The three lines correspond to prices 125, 122, 120.
On the 4-hour timeframe, bullish volume is increasing, indicating a possible continued upward trend.
On the 1-hour timeframe, bullish volume is beginning to strengthen, suggesting a potential upward trend.
Moving Averages: The 4-hou
View OriginalThe three lines correspond to prices 125, 122, 120.
On the 4-hour timeframe, bullish volume is increasing, indicating a possible continued upward trend.
On the 1-hour timeframe, bullish volume is beginning to strengthen, suggesting a potential upward trend.
Moving Averages: The 4-hou
- Reward
- 1
- Comment
- Repost
- Share
The Bollinger Bands on the 4-hour chart are opening downward at prices 125, 122, 120, with the middle band trending downward. The Bollinger Bands on the 1-hour chart are opening upward at prices 124, 122, 120, with the middle band trending downward.
MA Moving Averages: On the 1-hour chart, the price is below MA5, above the lower band, with MA5 crossing above MA10, the middle band, MA30, and MA60 from below. The SOL is trending downward without breaking the middle band, and upward without breaking MA5. On the 4-hour chart, the price is below MA5, above the middle band, with MA5 turning upward a
MA Moving Averages: On the 1-hour chart, the price is below MA5, above the lower band, with MA5 crossing above MA10, the middle band, MA30, and MA60 from below. The SOL is trending downward without breaking the middle band, and upward without breaking MA5. On the 4-hour chart, the price is below MA5, above the middle band, with MA5 turning upward a
SOL4,42%
- Reward
- 1
- 1
- Repost
- Share
Hermann11:
GoETH
On December 23, reflecting on yesterday, the overall trend was a volatile decline. Looking at the four-hour chart, it did not effectively stabilize above the short-term resistance level of ma30. The one-hour chart had several pullbacks without effectively breaking through ma5 and ma10, leading to a volatile decline.
The ETH 1-hour indicator shows that the Bollinger Bands open and close corresponds to the range of 2989-2919. The upward midline corresponds to a price of 2969, while the ETH corresponding price is 2962.
Moving Average Indicator. The MA5 and MA10 dual lines going upwards corres
ETH3,33%
- Reward
- 1
- Comment
- 1
- Share
The current 4-hour chart is in the pullback phase after a pump. If it does not hold above during the fall, the 4-hour ma5 will continue to fall. The Bollinger Bands are opening up, with the upper band moving up, the middle band moving down, and the lower band moving down.
The three lines correspond to prices 127, 125, 124.
The bearish volume has increased on the 4-hour level, indicating a potential downtrend.
Short selling volume is beginning to strengthen in the 1-hour timeframe, which may indicate a downtrend.
Moving Average: The 4-hour chart shows a death cross between ma5 and ma10, with th
View OriginalThe three lines correspond to prices 127, 125, 124.
The bearish volume has increased on the 4-hour level, indicating a potential downtrend.
Short selling volume is beginning to strengthen in the 1-hour timeframe, which may indicate a downtrend.
Moving Average: The 4-hour chart shows a death cross between ma5 and ma10, with th
- Reward
- 1
- Comment
- 1
- Share
December 23 sol analysis
Looking back at yesterday's review, the overall trend of sol has shown relatively strong performance compared to BTC. After hitting the resistance at 130 and failing to break through, it fell back to a low of 124, then rebounded all the way up to 126 this morning.
sol analysis
The 4-hour Bollinger Bands show three parallel lines corresponding to prices of 127, 125, and 124. The middle band of the 4-hour Bollinger Bands is trending upwards. The 1-hour Bollinger Bands show three parallel lines corresponding to prices of 128, 126, and 124, with the middle band of the
View OriginalLooking back at yesterday's review, the overall trend of sol has shown relatively strong performance compared to BTC. After hitting the resistance at 130 and failing to break through, it fell back to a low of 124, then rebounded all the way up to 126 this morning.
sol analysis
The 4-hour Bollinger Bands show three parallel lines corresponding to prices of 127, 125, and 124. The middle band of the 4-hour Bollinger Bands is trending upwards. The 1-hour Bollinger Bands show three parallel lines corresponding to prices of 128, 126, and 124, with the middle band of the
- Reward
- like
- Comment
- 1
- Share
SOL12.22
On December 21, the overall volatility of SOL was relatively small, fluctuating within about 4 points. Currently, after the market failed to break the resistance at 128.6, there is a trend of correction.
Technical Analysis
The Bollinger Bands are narrowing on the 4-hour chart, with the middle line moving upward. The corresponding prices for the three lines are: 128.6-125.2-121.8. The market is rising, and it is currently attempting to break through the upper Bollinger Band line but has not touched it, leading to a pullback and fluctuation. The MA moving averages indicate that the shor
SOL4,42%
- Reward
- like
- Comment
- Repost
- Share
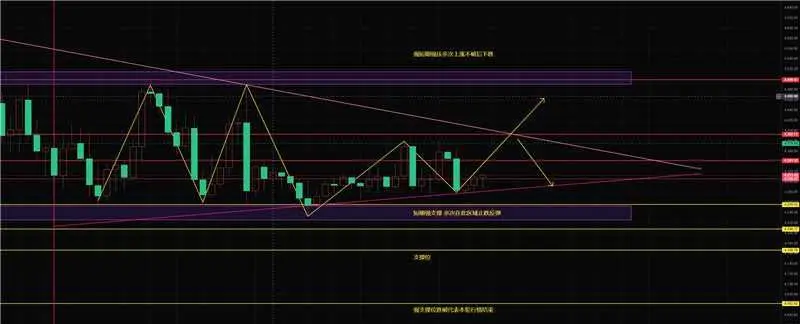
From the 4-hour chart, it is currently experiencing a technical Rebound after piercing the lower band of the Bollinger Bands, with the three lines opening outward and trending downward, corresponding to prices of 4767-4618-4470.
2. MA Moving Average Indicator Performance
From the 4-hour chart, it is currently experiencing a technical Rebound after breaking through the lower band of the Bollinger Bands. The three lines are opening outward, showing a trend of opening downward, corresponding to prices of 4767-4618-4470.
3. MACD and RSI Indicator Analysis
In the 4-hour MACD chart, the fast line ha
View Original2. MA Moving Average Indicator Performance
From the 4-hour chart, it is currently experiencing a technical Rebound after breaking through the lower band of the Bollinger Bands. The three lines are opening outward, showing a trend of opening downward, corresponding to prices of 4767-4618-4470.
3. MACD and RSI Indicator Analysis
In the 4-hour MACD chart, the fast line ha
- Reward
- like
- Comment
- 1
- Share
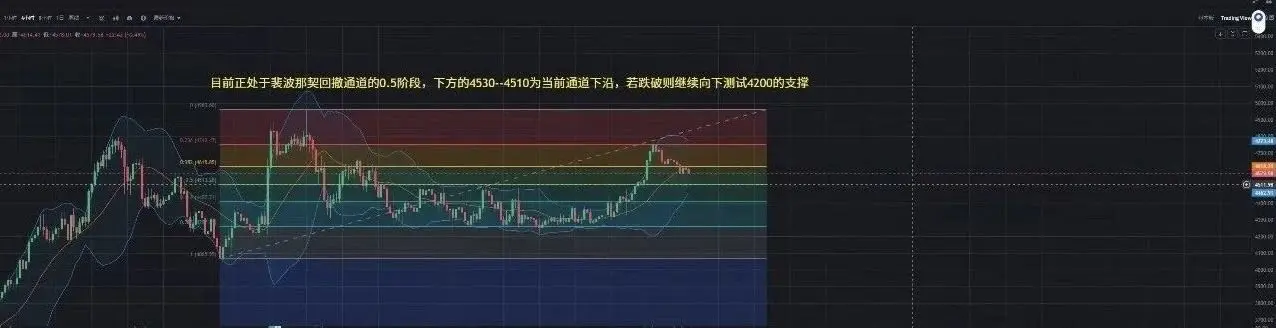
First, let's look at the daily chart. Currently, the market is experiencing a technical pullback after piercing the upper band of the Bollinger Bands. It is currently above the support at the MA5 corresponding price of 4605, with support concentrated between 4450 and 4420 below. On the hourly chart, it is in a state of oscillating decline, about to pierce the lower band of the hourly Bollinger Bands, with the market oscillating downward. The MA moving average indicators are currently showing a transition from long positions to short positions. If the short-term moving average crosses down
ETH3,33%
- Reward
- like
- Comment
- Repost
- Share
Ethereum yesterday review
Yesterday during the day, Ethereum showed an overall decline, rebounding after hitting the lower Bollinger Band and stabilizing at the middle band, then rebounding again. In the evening, the market was influenced by the opening of the US stock market and the US non-farm payroll data. Ethereum attempted to rise to 4360 but quickly fell over 100 points to 4270, indicating strong bearish momentum in the market. According to the latest data from Coinglass, if Ethereum breaks through 4524 USD, the cumulative liquidation strength of short positions on mainstream CEXs will r
View OriginalYesterday during the day, Ethereum showed an overall decline, rebounding after hitting the lower Bollinger Band and stabilizing at the middle band, then rebounding again. In the evening, the market was influenced by the opening of the US stock market and the US non-farm payroll data. Ethereum attempted to rise to 4360 but quickly fell over 100 points to 4270, indicating strong bearish momentum in the market. According to the latest data from Coinglass, if Ethereum breaks through 4524 USD, the cumulative liquidation strength of short positions on mainstream CEXs will r
- Reward
- like
- Comment
- Repost
- Share
Trending Topics
View More344.1K Popularity
96.1K Popularity
175.34K Popularity
10.95M Popularity
14.57K Popularity
Pin