The cryptocurrency industry related to AI has recently recorded an impressive performance. According to data from CoinMarketCap, the total market capitalization of this sector has grown by 16% in just one week. Many top tokens in this category have also achieved significant gains, attracting investor attention.
Among them, the most notable are Bittensor (TAO) and Render (RENDER), with weekly increases of 54% and 42%, respectively. Additionally, the Artificial Superintelligence Alliance (FET) has also performed well, with an impressive growth of 35.8%.
These positive signals have helped FET begin to shift its long-term trend toward an upward movement, while also challenging an important resistance level. If the dominant trend in the AI cryptocurrency sector continues, these gains could extend further.
Potential for Trend Reversal of FET
From November to the end of January, the $0.195 price level served as a key support. However, after breaking below it, this level is now being tested as a resistance. FET’s reaction at the local resistance of $0.185 has shown promising signs.
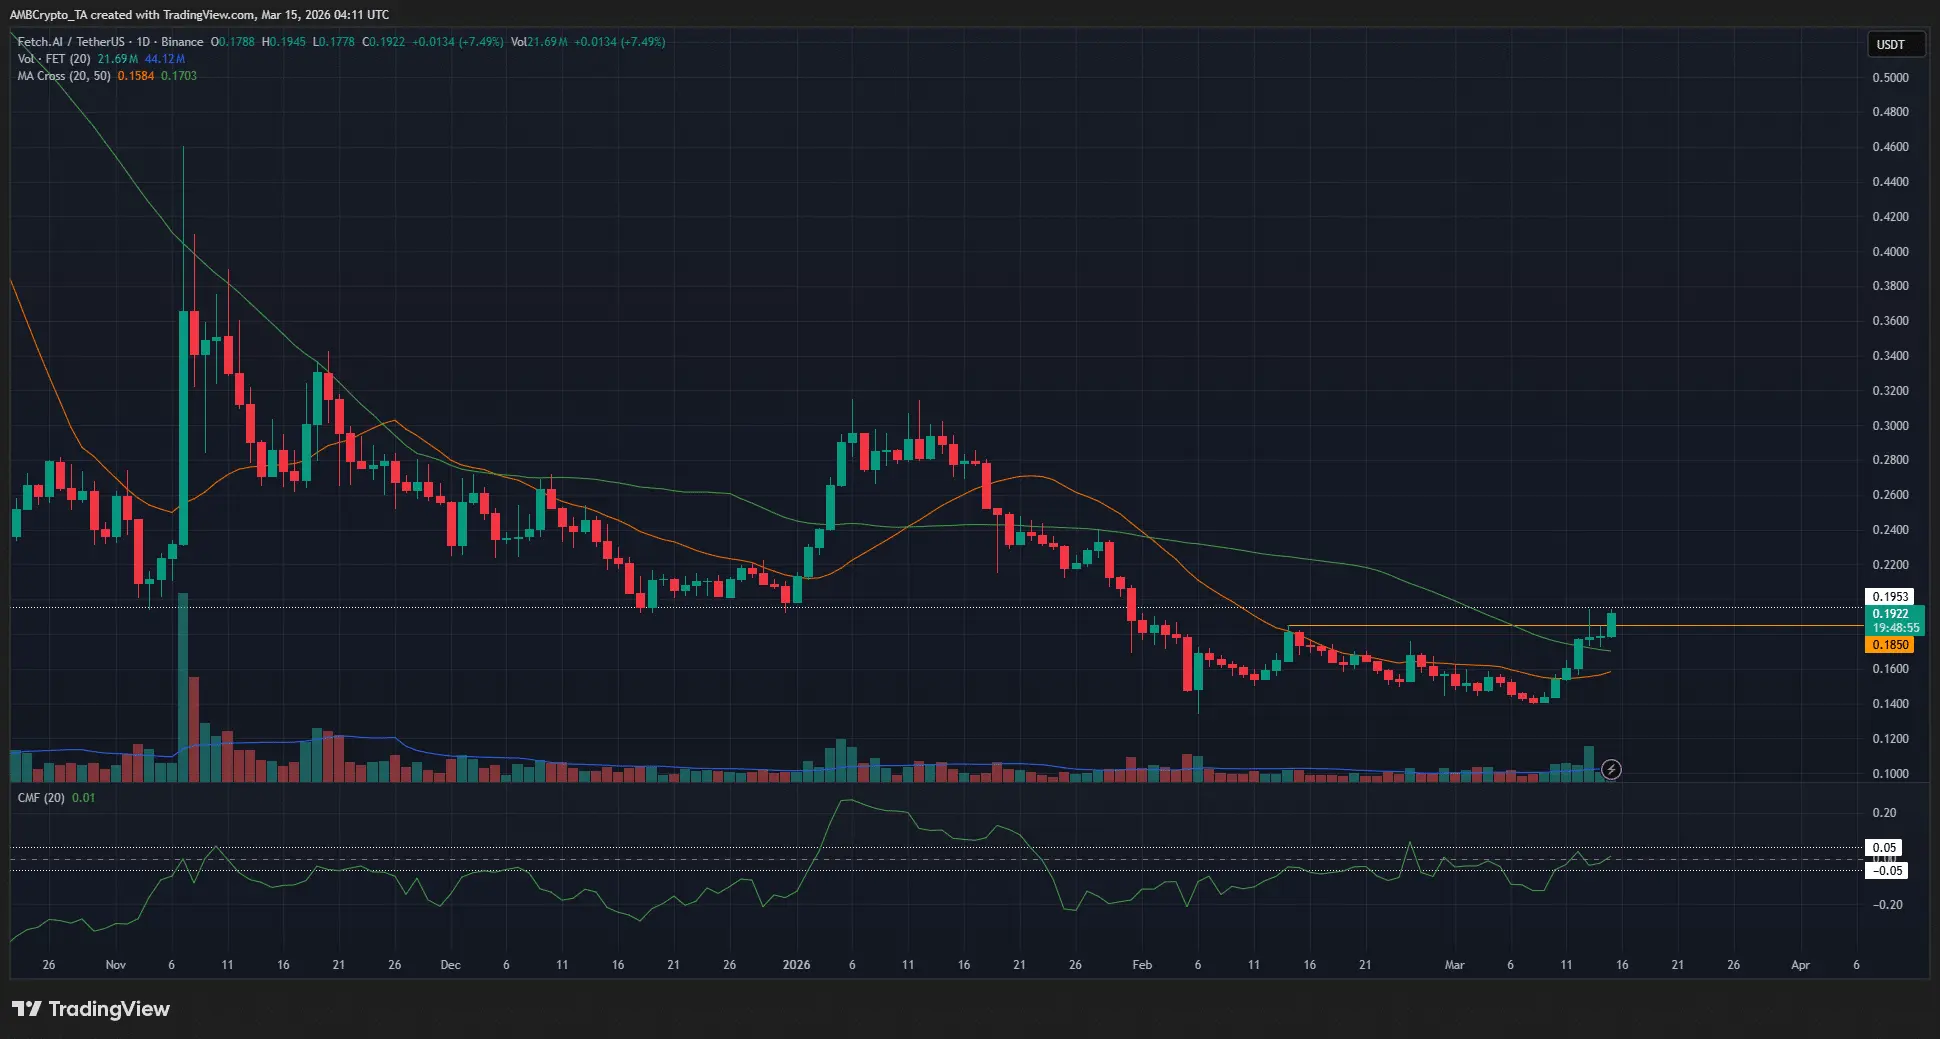 Source: TradingView Over the past two days, buyers have struggled to push the price above this level. However, in recent trading hours, selling pressure appears to have eased, allowing buyers to gain the upper hand and potentially retake the $0.195 resistance.
Moving averages (MA) indicate that bearish momentum has dominated recently. However, the Chaikin Money Flow (CMF) indicator has recently crossed above zero, reflecting capital inflows returning to the FET market.
Increased demand could be the catalyst for a strong rally in this AI altcoin. Nonetheless, traders should note that FET’s trend structure remains bearish. Breaking the $0.185 level is only a local change and not enough to confirm a complete reversal.
The $0.24 peak— which triggered a sharp decline to $0.134 in February— is now considered an important resistance level that buyers need to surpass to establish a long-term bullish trend.
Short-term Opportunities for FET
Liquidity heatmap analysis shows that the $0.195-$0.205 zone is an area attracting notable liquidity. Meanwhile, the $0.240-$0.254 zone is identified as the next liquidity cluster above.
 Source: CoinGlass In the coming days, if FET can break out and sustain above $0.205, it would be a strong signal for continued upward movement. Conversely, if the price is quickly rejected at the upper liquidity cluster, it indicates selling pressure still dominates.
To strengthen confidence in a further rally, traders should monitor whether the price can stabilize above $0.20. If successful, the next target will be the $0.24 area— corresponding to the high points on the daily chart and a key factor in confirming a long-term bullish trend.
Disclaimer: The information on this page may come from third parties and does not represent the views or opinions of Gate. The content displayed on this page is for reference only and does not constitute any financial, investment, or legal advice. Gate does not guarantee the accuracy or completeness of the information and shall not be liable for any losses arising from the use of this information. Virtual asset investments carry high risks and are subject to significant price volatility. You may lose all of your invested principal. Please fully understand the relevant risks and make prudent decisions based on your own financial situation and risk tolerance. For details, please refer to
Disclaimer.