fear & greed index crypto
What Is the Crypto Fear & Greed Index?
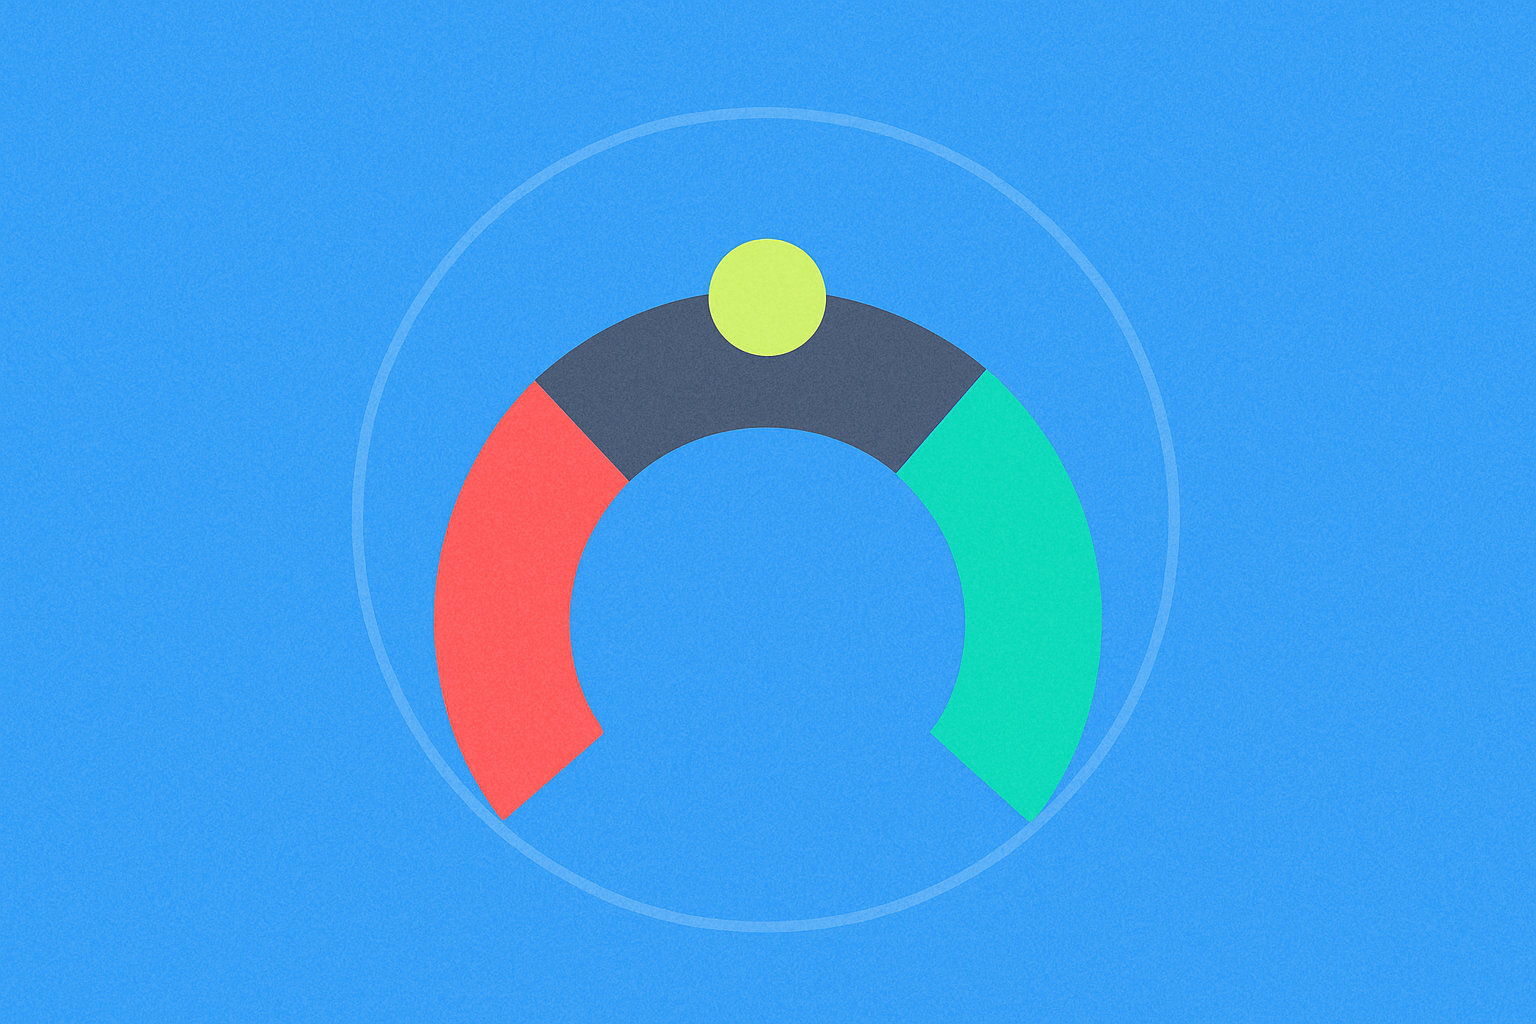
The Crypto Fear & Greed Index is a quantitative metric ranging from 0 to 100 that gauges overall market sentiment in the cryptocurrency space.
A lower score signals heightened fear, while a higher score indicates increasing greed. The typical ranges are: 0-24 for Extreme Fear, 25-49 for Fear, 50 for Neutral, 51-74 for Greed, and 75-100 for Extreme Greed. By mapping investor sentiment onto a numerical scale, the index offers a rapid snapshot of where the market’s emotions stand.
The most widely cited version is calculated by Alternative.me and primarily tracks Bitcoin, given Bitcoin’s significant influence over the broader crypto market. Think of it as an “emotional traffic light” for traders and investors.
Why Should You Pay Attention to the Crypto Fear & Greed Index?
The index helps you avoid emotionally driven trading and enhances your execution discipline.
During periods of high volatility, investors are prone to chasing rallies or panic selling. The index provides direct feedback: a low score cautions against impulsive decisions driven by fear, while a high score reminds you not to get swept up in market euphoria. Used as an auxiliary signal, it encourages a more rational approach to entering, scaling into, or exiting positions.
For long-term holders, it serves as a timing tool. For example, you might increase dollar-cost averaging during Extreme Fear, and take partial profits during Extreme Greed—allowing for balanced risk-reward over time.
How Does the Crypto Fear & Greed Index Work?
The index synthesizes multiple sentiment signals into a single daily score.
Key components include:
- Price volatility and drawdowns: The more dramatic the price swings, the greater the emotional response. Intense volatility often corresponds to extreme scores.
- Trading volume and momentum: Surging volumes on price increases typically signal greed; heavy selling volumes indicate fear. Volume-price dynamics offer real-time clues about market strength.
- Social media buzz: The frequency and tone of discussions on social platforms influence the score. High engagement tends to drive greed higher, while concentrated negativity suppresses it.
- Search trends: Spikes in searches for keywords like “Bitcoin”, “altcoin”, or “market trends” often accompany emotional extremes.
- Bitcoin dominance: Changes in Bitcoin’s share of total market capitalization reflect risk appetite—rising dominance may signal risk aversion, while falling dominance can indicate increased risk tolerance.
Each signal is weighted and combined into a daily score. Rather than calculate each component yourself, recognize that the index distills five key dimensions—volatility, trading activity, social buzz, search interest, and market structure. The more extreme the score, the more one-sided the market sentiment.
Where Is the Crypto Fear & Greed Index Used in Crypto?
The index influences entry points and position sizing across spot trading, derivatives (contracts), DeFi, and NFT markets.
In spot trading on exchanges, high scores often precede short-term overheating and corrections; low scores can follow panic selling and stabilization. For instance, on Gate, you might adjust your dollar-cost averaging based on the score: increase buys below 25, maintain normal frequency around 50, reduce buying and set profit targets above 75.
In contract trading, extreme scores mean greater volatility and slippage risk. When greed prevails, it’s wise to lower leverage (using borrowed funds to amplify positions); during fearful periods, avoid blind bottom-fishing and wait for confirmation signals.
During DeFi or NFT launches, social and search trends have a direct impact on the index. Surging interest drives up greed and increases the likelihood of sharp price reversals; when things are quiet and scores are low (with no fundamental issues), small test positions may be suitable rather than aggressive allocations.
How Can You Mitigate Risks Associated with the Crypto Fear & Greed Index?
Use systematic strategies to minimize emotional bias.
Step one: Set predefined actions for score ranges. Treat scores as triggers—for example, allow small dollar-cost averaging below 25, take partial profits above 75, and stay neutral around 50. Write these actions down and stick to them.
Step two: Control position sizes and leverage. In extreme zones, avoid oversized spot positions; in contracts, reduce leverage or open fewer new positions to protect your capital.
Step three: Diversify timing and assets. Spread buys and sells over multiple days to avoid making all-in decisions during single-day extremes; diversify across major coins and quality projects to lower single asset risk.
Step four: Execute these strategies on Gate. Use Gate’s dollar-cost averaging (DCA) and grid trading tools: activate small DCA or low-density grids during low scores; tighten profit-taking levels and grid upper limits during high scores. On the contracts side, gradually reduce exposure and set stop-losses—avoid increasing leverage during periods of high greed.
What Recent Trends or Data Should You Watch in the Crypto Fear & Greed Index?
Over the past year, pay attention to score distributions and frequency of extremes.
Data source & timing: Using Alternative.me’s BTC version as an example, scores ranged from roughly 10-90 throughout 2024. During Bitcoin’s record highs in March 2024, the index stayed in the 80-90 Extreme Greed zone for several days; in Q4 market pullbacks, it repeatedly dropped below 30 into Fear territory. Always refer to daily updates for exact numbers.
In 2025 (projected), expect more oscillation with fewer extremes—most months see scores between 20-80; extreme values occur less often. Weekly swings over 15 points are common and often linked to macro rate shifts, major regulatory news, or significant capital inflows/outflows.
Interpretation tips:
- If the score remains above 75 for three consecutive days, short-term correction risk rises—consider gradual profit-taking instead of full liquidation.
- If the score stays below 25 for three days, panic selling typically subsides—small incremental buys are preferable to large bets.
- The pace of score changes matters too; rapid moves across ranges within a day or week signal heightened volatility—reduce leverage and tighten risk controls accordingly.
Common Misconceptions About the Crypto Fear & Greed Index
Treating it as a “buy/sell signal generator” is a major mistake.
It’s an emotional thermometer—not a trend predictor. High scores don’t guarantee immediate downturns; low scores don’t ensure instant rebounds. The best approach is using it as a tool for risk management and position adjustments.
Ignoring fundamentals is another pitfall. Even with high scores, strong new capital inflows or positive developments can sustain trends; low scores can persist if systemic risks remain unresolved—bottom-fishing too early can be costly.
Neglecting timeframes is problematic as well. Single-day extremes have limited value; weekly averages or consecutive days offer better reliability. Integrate it with your strategy—define when to add or reduce positions and by how much—to maximize its usefulness.
Key Terms
- Market Sentiment: Investors’ psychological outlook on market prospects—categorized as fear, neutral, or greed.
- Volatility: The degree of price fluctuation in crypto assets over a given period, indicating risk levels.
- Technical Analysis: Methods using price and volume data to predict market trends.
- Fundamentals: Factors impacting long-term value such as project development progress, team strength, and real-world adoption.
- Risk Management: Strategies including diversification and stop-losses to reduce potential investment losses.
FAQ
What is the range of values for the Fear & Greed Index? How should I interpret it?
The index ranges from 0 to 100—0 means Extreme Fear, 100 means Extreme Greed, and 50 is Neutral. Generally, lower values reflect pessimistic sentiment with investors inclined to sell; higher values signal optimism with a tendency to buy. The index helps beginners quickly assess overall market psychology.
Where can I view real-time readings of the Fear & Greed Index?
Major platforms for checking live Fear & Greed Index data include Alternative.me and the official Crypto Fear and Greed Index website. Exchanges like Gate also display sentiment data in their market analysis sections for easy reference during trading. Regularly monitor these metrics but do not rely solely on them for investment decisions.
Does a high Fear reading mean I should immediately buy?
A high Fear score typically suggests potential bottoming opportunities but should not be your only buy signal. The index reflects sentiment but does not account for fundamentals, technical factors, or macroeconomic conditions. The correct approach is to combine multiple forms of analysis—including technicals and project fundamentals—and conduct thorough research on reputable platforms like Gate before trading.
What data sources are included in the Fear & Greed Index?
The index aggregates various dimensions such as market volatility, trading volume, social media buzz, Google search trends, and market dominance indicators. Algorithms weigh these factors to produce the final score. Understanding these components provides deeper insight into underlying market dynamics.
How does the Fear & Greed Index behave in bull vs bear markets?
During bull markets, the index typically stays high (60-100), reflecting optimism; in bear markets it remains low (20-40), indicating pessimism. Both extremes warrant caution: excessive greed may signal a market top while extreme fear could present buying opportunities. Recognizing these signals is crucial when trading on platforms like Gate.
References & Further Reading
Related Articles

Exploring 8 Major DEX Aggregators: Engines Driving Efficiency and Liquidity in the Crypto Market

What Is Copy Trading And How To Use It?
