#MyGateTradeStory
Bitcoin Technical Analysis & Trading Strategy
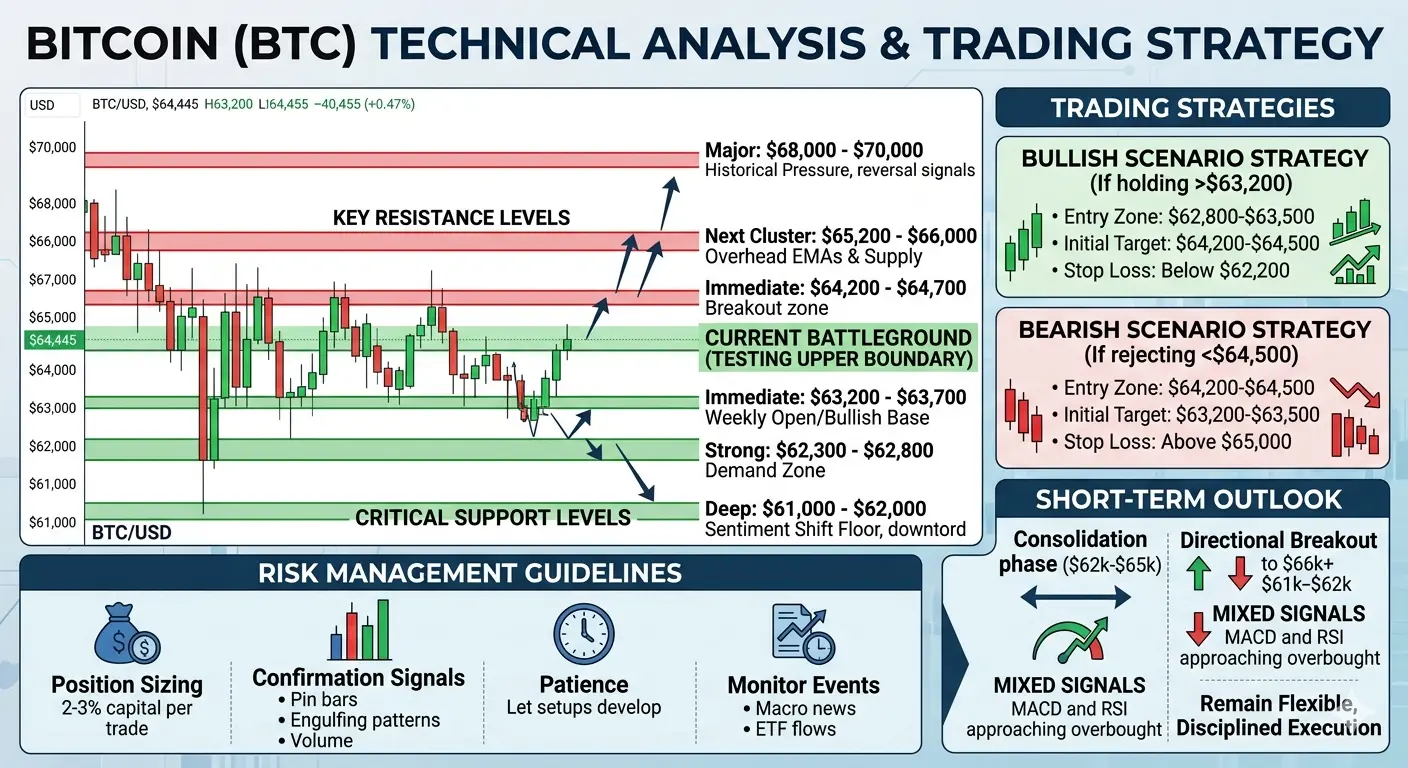
BTC is currently trading around **$64,445**, positioned in a critical zone where multiple technical factors converge. This analysis provides detailed support and resistance levels with actionable trading insights for informed decision-making.
Current Market Structure
Bitcoin has established a trading range between approximately **$62,300 and $64,500**. The price is testing the upper boundary of this range, which represents a key decision point for traders. The current level sits near recent highs and aligns with the upper Bollinger Band, indicating potential resistance pressure.
Key Resistance Levels
**Immediate Resistance: $64,200 - $64,700**
This zone represents the current battleground where sellers are actively defending. A decisive breakout above this level with strong volume could trigger momentum toward higher targets. Traders should watch for sustained closes above $64,500 as confirmation of bullish continuation.
Next Resistance Cluster: $65,200 - $66,000
This area contains overhead EMAs and represents short-term supply where profit-taking typically occurs. Breaking through this cluster would open the path toward the psychological $67,000 level and potentially $68,000-$70,000.
Major Resistance: $68,000 - $70,000
Historical price action shows significant selling pressure in this region. A clean breakout above $70,000 would signal a potential trend reversal with targets extending toward $72,000-$75,000.
Critical Support Levels
Immediate Support: $63,200 - $63,700
This zone aligns with recent consolidation areas and the weekly open. Holding above this level maintains the bullish structure and provides a foundation for potential upside moves.
Strong Support: $62,300 - $62,800
This represents a demand zone where buyers have previously stepped in. A bounce from this area with bullish reversal candles would present favorable long entry opportunities.
Deep Support: $61,000 - $62,000
Breaking below this psychological floor would shift market sentiment bearish, with potential downside extension toward $59,000-$60,000. This level acts as a safety net for the current structure.
Trading Strategy Recommendations
Bullish Scenario Strategy
If BTC holds above $63,200 and shows bullish reversal patterns, consider long positions with the following parameters:
Entry Zone: $62,800 - $63,500 on confirmed bullish candles
Initial Target: $64,200 - $64,500
Extended Target: $65,200 - $66,000
Stop Loss: Below $62,200
Look for confirmation signals including bullish engulfing patterns, pin bars, or morning star formations on hourly and four-hour timeframes. Volume expansion during the bounce adds conviction to the setup.
Bearish Scenario Strategy
If BTC rejects from $64,500 and forms bearish reversal patterns, consider short positions:
Entry Zone: $64,200 - $64,500 on rejection candles
Initial Target: $63,200 - $63,500
Extended Target: $62,300 - $62,800
Stop Loss: Above $65,000
Bearish signals include shooting stars, bearish engulfing patterns, or breakdowns below rising trendlines with increased selling volume.
Risk Management Guidelines
Position sizing remains crucial for sustainable trading. Consider allocating only 2-3 percent of capital per trade to manage downside exposure effectively. Use stop losses religiously and avoid moving them against your position once established.
Wait for clear confirmation before entering trades. Avoid chasing prices during volatile spikes. Patience in letting setups develop according to your plan typically yields better results than impulsive entries.
Monitor macroeconomic events and Bitcoin-specific news that could trigger sudden volatility. ETF flows, regulatory developments, and large institutional movements can rapidly shift market sentiment.
Short-Term Outlook
The current price action suggests a consolidation phase within the $62,000-$65,000 range. The direction of the breakout from this range will likely determine the next significant move. A sustained break above $64,700 targets $66,000+ while failure to hold $63,200 risks a retest of $61,000-$62,000.
Technical indicators show mixed signals with MACD and RSI indicating momentum building but approaching overbought conditions on shorter timeframes. This suggests caution and the importance of waiting for confirmation rather than anticipating moves.
Traders should remain flexible and ready to adapt as price action unfolds. The current environment rewards disciplined execution of predefined strategies rather than emotional reactions to price fluctuations.
@Gate_Square
Bitcoin Technical Analysis & Trading Strategy
BTC is currently trading around **$64,445**, positioned in a critical zone where multiple technical factors converge. This analysis provides detailed support and resistance levels with actionable trading insights for informed decision-making.
Current Market Structure
Bitcoin has established a trading range between approximately **$62,300 and $64,500**. The price is testing the upper boundary of this range, which represents a key decision point for traders. The current level sits near recent highs and aligns with the upper Bollinger Band, indicating potential resistance pressure.
Key Resistance Levels
**Immediate Resistance: $64,200 - $64,700**
This zone represents the current battleground where sellers are actively defending. A decisive breakout above this level with strong volume could trigger momentum toward higher targets. Traders should watch for sustained closes above $64,500 as confirmation of bullish continuation.
Next Resistance Cluster: $65,200 - $66,000
This area contains overhead EMAs and represents short-term supply where profit-taking typically occurs. Breaking through this cluster would open the path toward the psychological $67,000 level and potentially $68,000-$70,000.
Major Resistance: $68,000 - $70,000
Historical price action shows significant selling pressure in this region. A clean breakout above $70,000 would signal a potential trend reversal with targets extending toward $72,000-$75,000.
Critical Support Levels
Immediate Support: $63,200 - $63,700
This zone aligns with recent consolidation areas and the weekly open. Holding above this level maintains the bullish structure and provides a foundation for potential upside moves.
Strong Support: $62,300 - $62,800
This represents a demand zone where buyers have previously stepped in. A bounce from this area with bullish reversal candles would present favorable long entry opportunities.
Deep Support: $61,000 - $62,000
Breaking below this psychological floor would shift market sentiment bearish, with potential downside extension toward $59,000-$60,000. This level acts as a safety net for the current structure.
Trading Strategy Recommendations
Bullish Scenario Strategy
If BTC holds above $63,200 and shows bullish reversal patterns, consider long positions with the following parameters:
Entry Zone: $62,800 - $63,500 on confirmed bullish candles
Initial Target: $64,200 - $64,500
Extended Target: $65,200 - $66,000
Stop Loss: Below $62,200
Look for confirmation signals including bullish engulfing patterns, pin bars, or morning star formations on hourly and four-hour timeframes. Volume expansion during the bounce adds conviction to the setup.
Bearish Scenario Strategy
If BTC rejects from $64,500 and forms bearish reversal patterns, consider short positions:
Entry Zone: $64,200 - $64,500 on rejection candles
Initial Target: $63,200 - $63,500
Extended Target: $62,300 - $62,800
Stop Loss: Above $65,000
Bearish signals include shooting stars, bearish engulfing patterns, or breakdowns below rising trendlines with increased selling volume.
Risk Management Guidelines
Position sizing remains crucial for sustainable trading. Consider allocating only 2-3 percent of capital per trade to manage downside exposure effectively. Use stop losses religiously and avoid moving them against your position once established.
Wait for clear confirmation before entering trades. Avoid chasing prices during volatile spikes. Patience in letting setups develop according to your plan typically yields better results than impulsive entries.
Monitor macroeconomic events and Bitcoin-specific news that could trigger sudden volatility. ETF flows, regulatory developments, and large institutional movements can rapidly shift market sentiment.
Short-Term Outlook
The current price action suggests a consolidation phase within the $62,000-$65,000 range. The direction of the breakout from this range will likely determine the next significant move. A sustained break above $64,700 targets $66,000+ while failure to hold $63,200 risks a retest of $61,000-$62,000.
Technical indicators show mixed signals with MACD and RSI indicating momentum building but approaching overbought conditions on shorter timeframes. This suggests caution and the importance of waiting for confirmation rather than anticipating moves.
Traders should remain flexible and ready to adapt as price action unfolds. The current environment rewards disciplined execution of predefined strategies rather than emotional reactions to price fluctuations.
@Gate_Square