Trade
Basic
Futures
Futures
Hundreds of contracts settled in USDT or BTC
TradFi
Gold
Trade global traditional assets with USDT in one place
Options
Hot
Trade European-style vanilla options
Unified Account
Maximize your capital efficiency
Demo Trading
Futures Kickoff
Get prepared for your futures trading
Futures Events
Participate in events to win generous rewards
Demo Trading
Use virtual funds to experience risk-free trading
Earn
Launch
CandyDrop
Collect candies to earn airdrops
Launchpool
Quick staking, earn potential new tokens
HODLer Airdrop
Hold GT and get massive airdrops for free
Launchpad
Be early to the next big token project
Alpha Points
Trade on-chain assets and enjoy airdrop rewards!
Futures Points
Earn futures points and claim airdrop rewards
Investment
Simple Earn
Earn interests with idle tokens
Auto-Invest
Auto-invest on a regular basis
Dual Investment
Buy low and sell high to take profits from price fluctuations
Soft Staking
Earn rewards with flexible staking
Crypto Loan
0 Fees
Pledge one crypto to borrow another
Lending Center
One-stop lending hub
VIP Wealth Hub
Customized wealth management empowers your assets growth
Private Wealth Management
Customized asset management to grow your digital assets
Quant Fund
Top asset management team helps you profit without hassle
Staking
Stake cryptos to earn in PoS products
Smart Leverage
New
No forced liquidation before maturity, worry-free leveraged gains
GUSD Minting
Use USDT/USDC to mint GUSD for treasury-level yields
More
KnowTheOrder
No content yet
KnowTheOrder
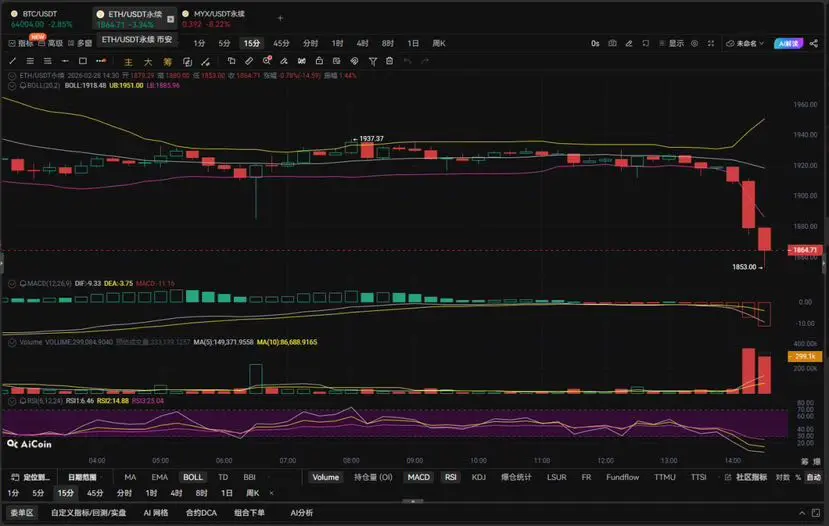
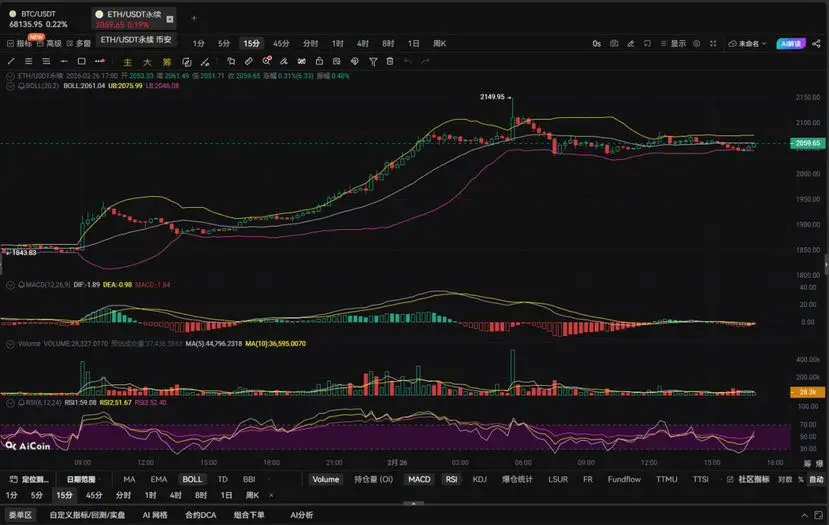
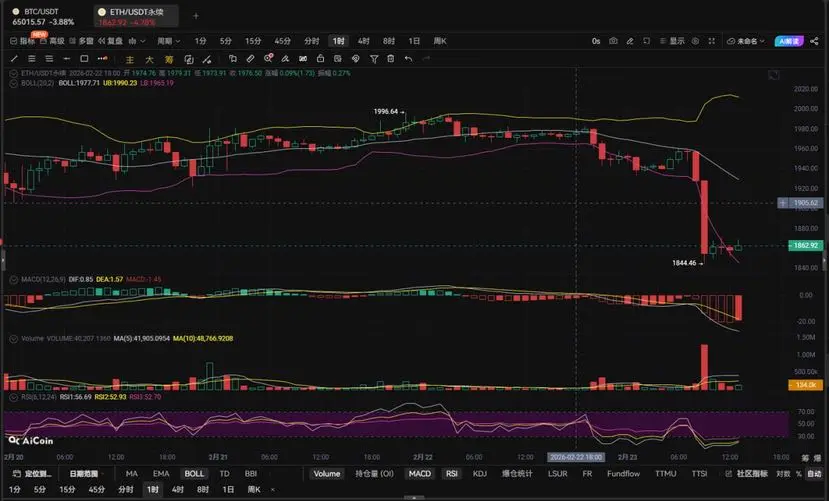
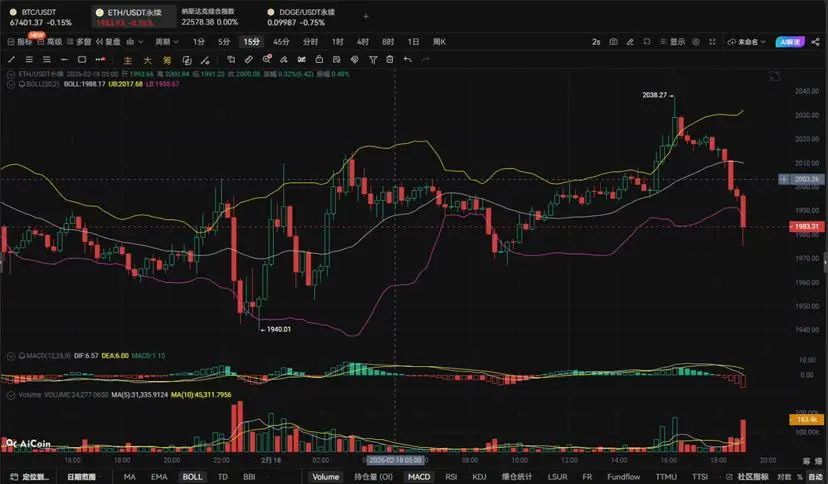
ETH Wave Structure (1H)
Trend Judgment
After the high point of 2149, the structure weakens,
ETH experiences increased volume and breaks below the platform,
Price rapidly drops to 1853.
Current Operation:
1850 — 1870 Range
Overall belongs to:
👉 Bearish trend reactivation phase
👉 Rebound ends → New round of decline
Not a shakeout.
Reasons (Core Structure)
① Structural Breakdown (Most Critical)
1900 platform is directly broken through
1H highs and lows shift downward
Sideways consolidation structure invalidated
= Trend shifts downward again
② BOLL
Middle band turns downward
Lower band reopens
C
ETH-1,53%
- Reward
- 1
- Comment
- Repost
- Share
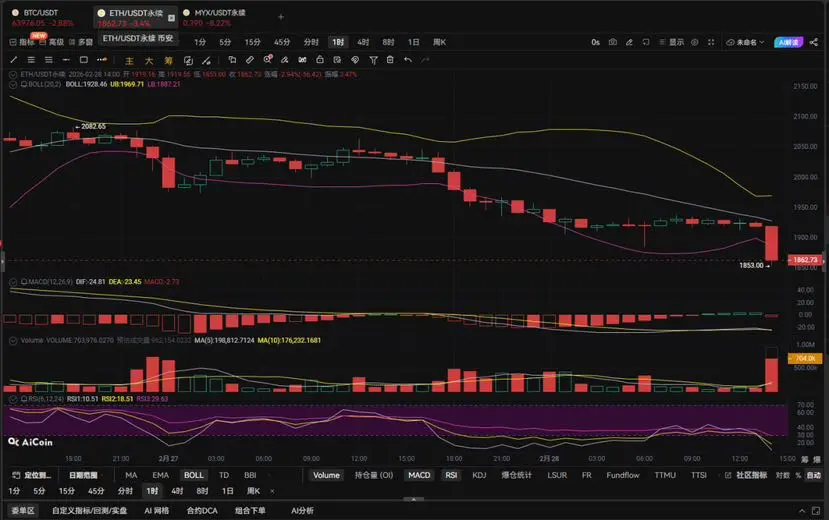
ETH Wave Structure (1H)
Trend Analysis
After reaching the high point at 2149
The market completed a round of accelerated decline
Rebounding to a low of 1973
Currently operating within:
2030 — 2045 range
Overall belongs to:
A retracement and consolidation phase within a bullish trend
Not the start of a new bearish cycle
The trend has not reversed, but momentum is clearly weakening.
Structural Analysis (Core)
2149 surge high
Volume increase
Followed by continuous decline
The upper band begins to flatten or even press downward
This is a typical pattern:
End of the main upward wave → Entering a co
ETH-1,53%
- Reward
- like
- Comment
- Repost
- Share
ETH Wave Structure (1H)
Trend Judgment
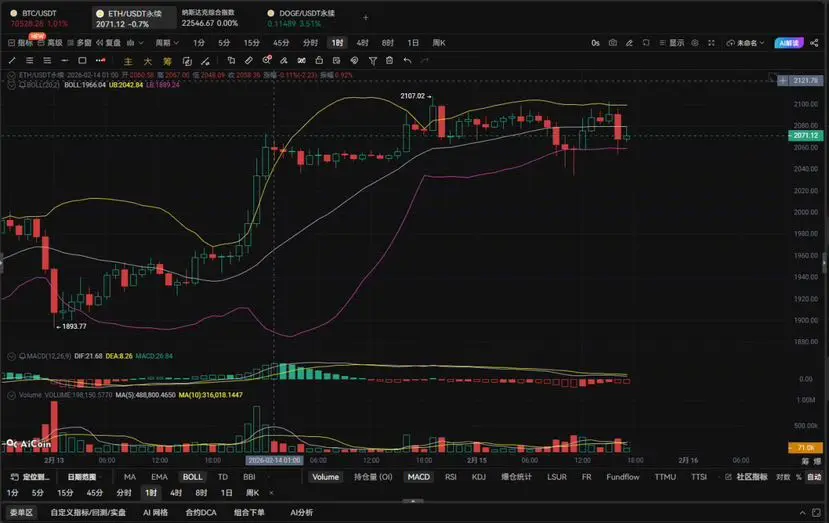
After the 1796 low, the market has completed a true structural reversal.
Currently trading between 2050 and 2065.
Overall it belongs to:
✅ End of Bearish Phase → Bullish Trend Initiation Stage
✅ Not a rebound, but a trend continuation upward
👉 Upward consolidation, not a top
Market Real State (Institutional Rhythm)
Current stage:
Initiation → Acceleration → Sideways Lock-in
What you are seeing now is:
👉 Institutional Lock-in Zone
Not distribution.
Institutional True Rhythm:
Sharp decline to shake out (1796)
↓
Rapid rally to break away from cost basis
↓
Trend Judgment
After the 1796 low, the market has completed a true structural reversal.
Currently trading between 2050 and 2065.
Overall it belongs to:
✅ End of Bearish Phase → Bullish Trend Initiation Stage
✅ Not a rebound, but a trend continuation upward
👉 Upward consolidation, not a top
Market Real State (Institutional Rhythm)
Current stage:
Initiation → Acceleration → Sideways Lock-in
What you are seeing now is:
👉 Institutional Lock-in Zone
Not distribution.
Institutional True Rhythm:
Sharp decline to shake out (1796)
↓
Rapid rally to break away from cost basis
↓
ETH-1,53%
- Reward
- 2
- Comment
- Repost
- Share
ETH Wave Structure (1H)
Trend Judgment
1796: After a rebound from the low point, a rapid surge occurs,
Price reclaims above 1900,
Currently trading in the 1890–1910 range.
Overall:
A rebound phase within a bearish trend
Not a trend reversal.
Reasons:
1H structure still has not broken through previous highs
Lower highs and lower lows structure remains unchanged
BOLL middle band has just been reclaimed but upper band remains under pressure
Price still within a downward channel
MACD has turned red but momentum is slowing
The rally appears more like a short covering rebound in a bear market
Market
ETH-1,53%

- Reward
- like
- Comment
- Repost
- Share
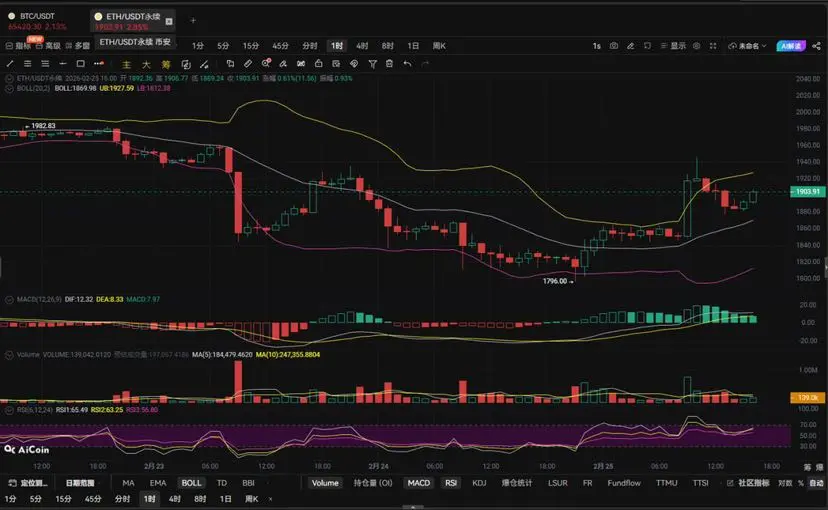
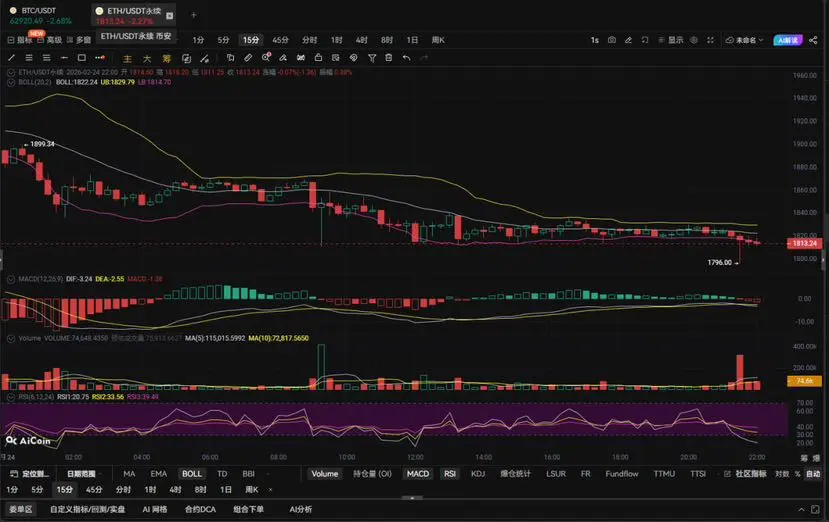
ETH Wave Structure (1H)
Trend Analysis
After reaching a high of 1996, the market continued to weaken,
completing a second decline,
and probing a new low at 1796.
Currently, the price is trading within
the 1800 — 1820 range.
Overall:
Continuation of a bearish trend
not a bottoming structure.
Reasons:
1H high and low points are continuously moving lower
Moving averages remain in a bearish alignment
BOLL lower band continues to diverge downward
Price has been operating near the lower band for a long time
MACD remains below the zero line
Rebound momentum is clearly insufficient
Market Status:
Weak
ETH-1,53%
- Reward
- 5
- 2
- Repost
- Share
CryptoLittleBillion:
wwuuuuuuhgggggfffgyuuuuuuiiView More
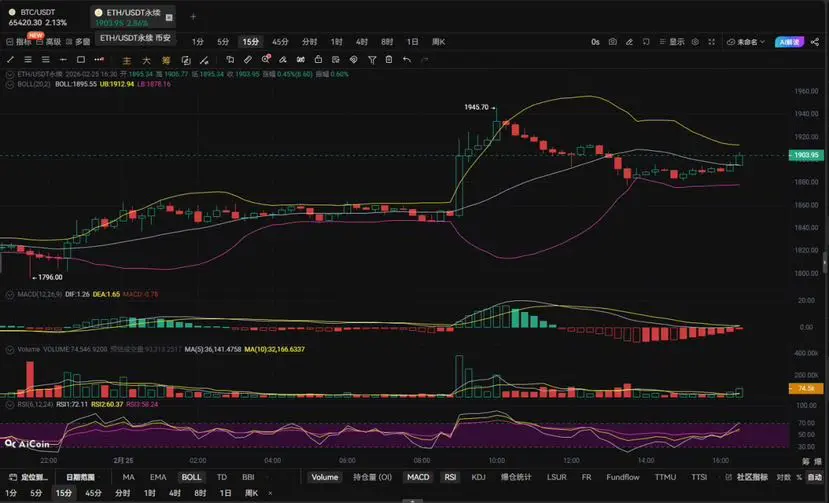
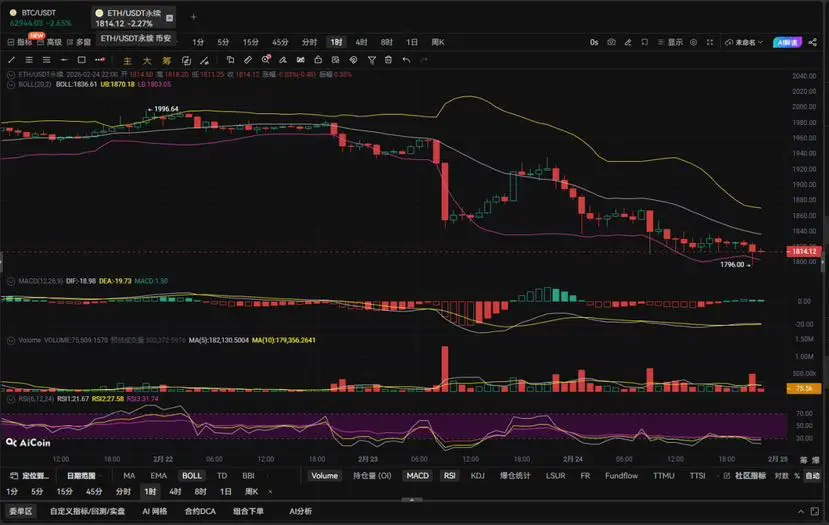
ETH Swing Structure (1H)
Trend Judgment
Previous high 1996, after a decline
Continuous formation of lower lows,
Bottomed out near 1810.
Current price remains
1820 — 1835 with weak oscillation.
Overall:
Bottom consolidation within a bearish trend
No reversal signals yet.
Reasons:
Daily chart continues downward momentum
1H moving averages are in a bearish alignment
Price has been trading near the lower band of BOLL for a long time
Rebound heights are continuously decreasing
MACD is weakly oscillating around zero
Funds are clearly on the sidelines
Market Status:
Unable to fall further ≠ Ready to
ETH-1,53%
- Reward
- like
- Comment
- Repost
- Share
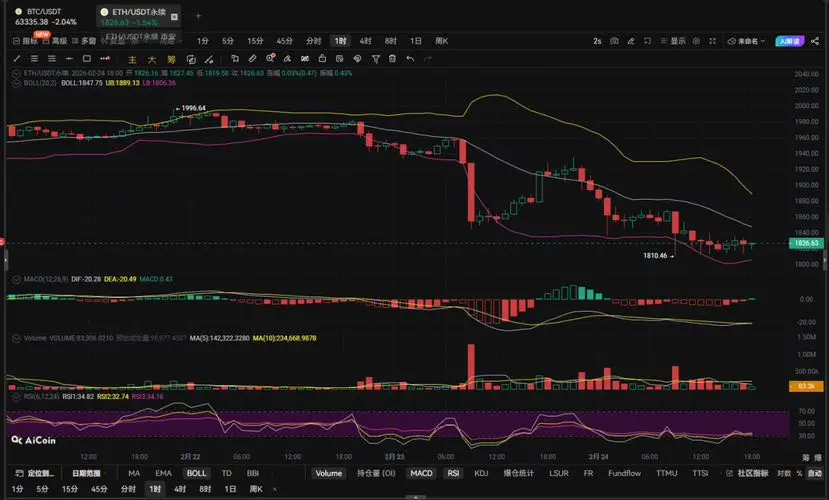
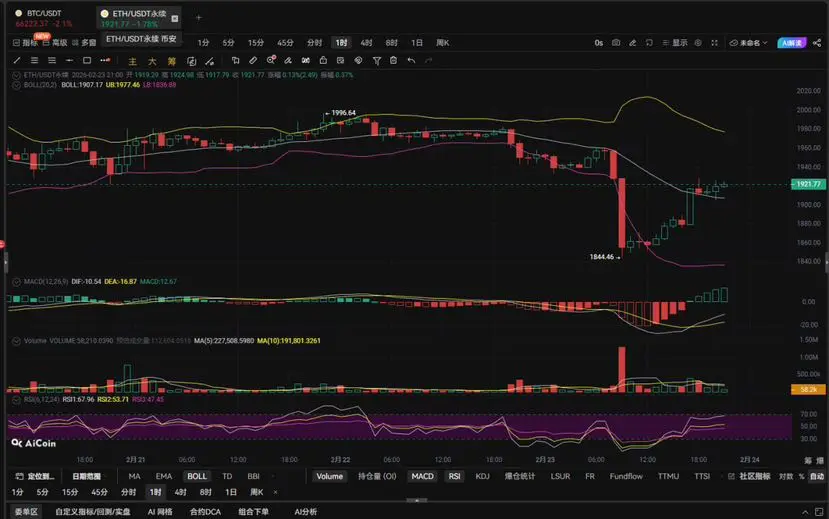
ETH Wave Structure (1H)
Trend Judgment
1844 sharp decline followed by a technical rebound,
Currently operating within the 1915 — 1925 range.
Overall:
A rebound phase within a bearish trend
Not a trend reversal.
Market Essence:
Downtrend → Correction → Waiting for a secondary direction choice.
Reasons:
1H remains in a downward structure
High points continue to shift lower
Price is still below the moving averages
BOLL middle band shows clear resistance
Rebound volume is weaker than decline volume
MACD has turned red but momentum is slowing
Key Levels
Resistance Zone
1935: First rebound resistanc
ETH-1,53%
- Reward
- 2
- Comment
- Repost
- Share
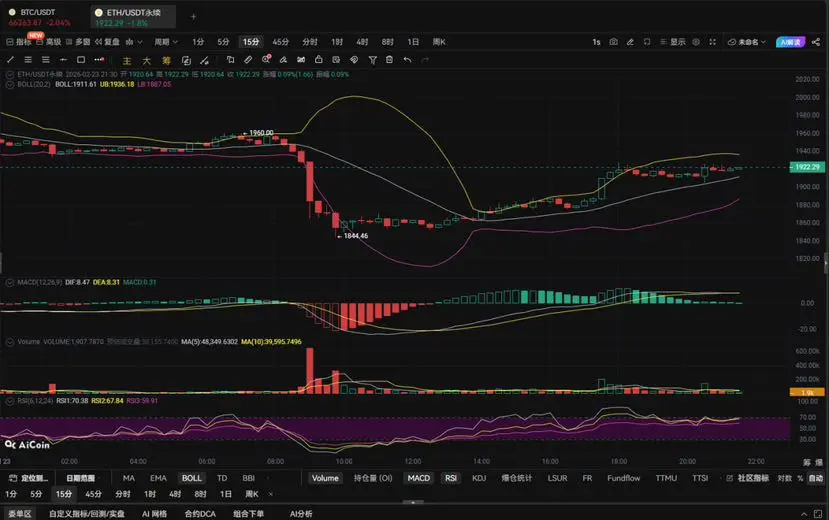
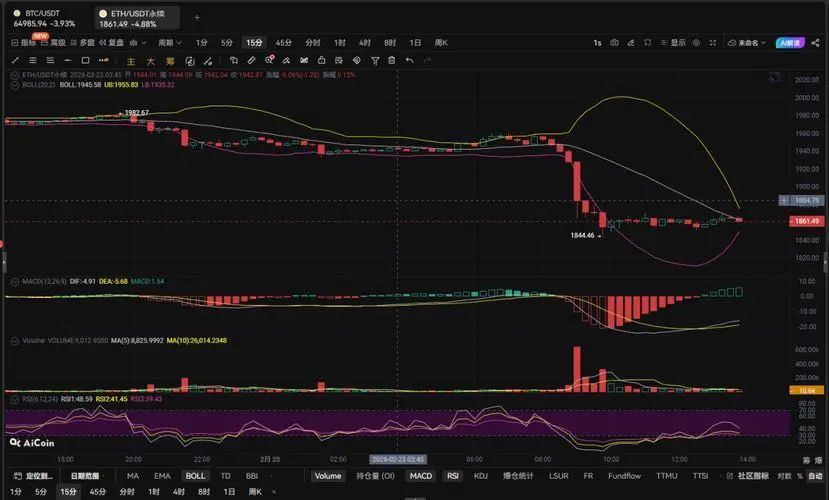
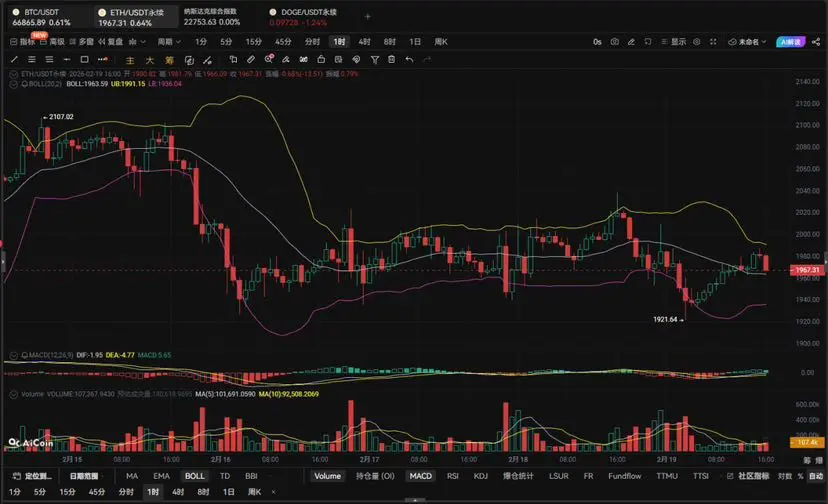
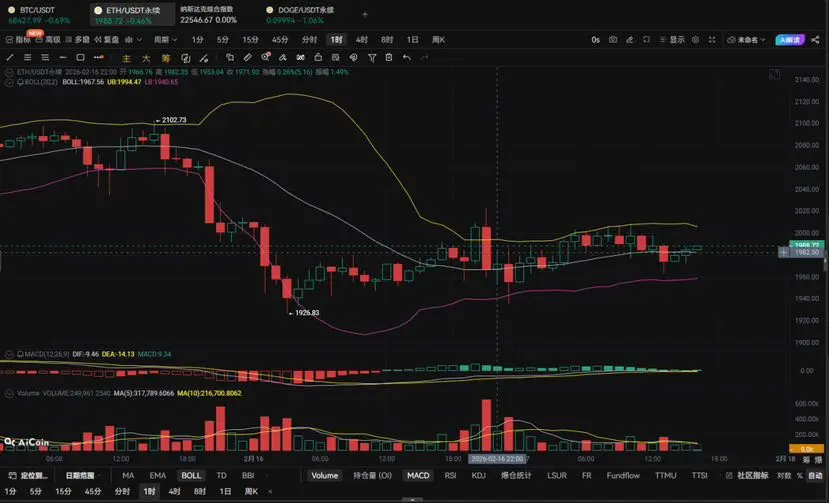
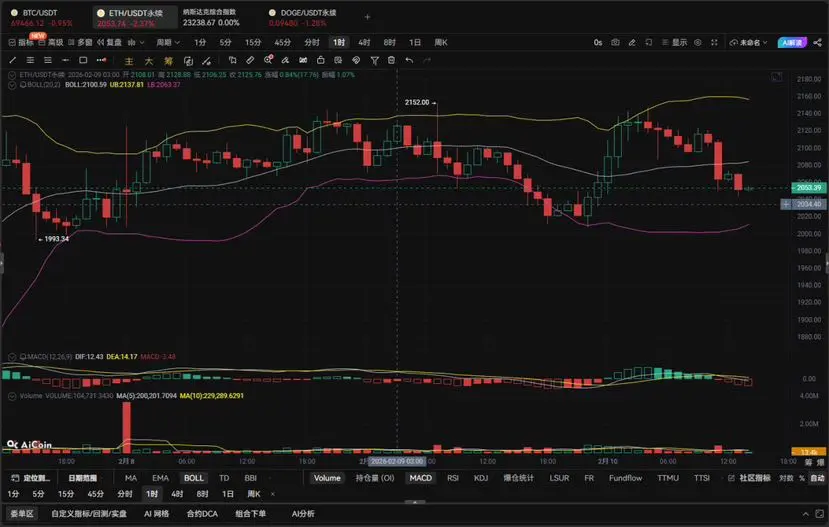
ETH Wave Structure (1H)
Trend Judgment
After failing to hold above 2000,
a surge in volume led to a rapid decline,
bottoming out near 1844.
Currently trading within
1850 — 1870 range.
Overall:
A weak rebound phase after a trend reversal to bearish,
has transitioned from a consolidation pattern
into a predominantly bearish market.
Reasons:
1H structure broke below the previous support at 1900,
BOLL bands opening downward,
price consistently near the lower band,
all moving averages turning downward,
MACD showing increased volume in the deep water zone,
bearish momentum dominating,
rebound with n
ETH-1,53%
- Reward
- 3
- Comment
- Repost
- Share
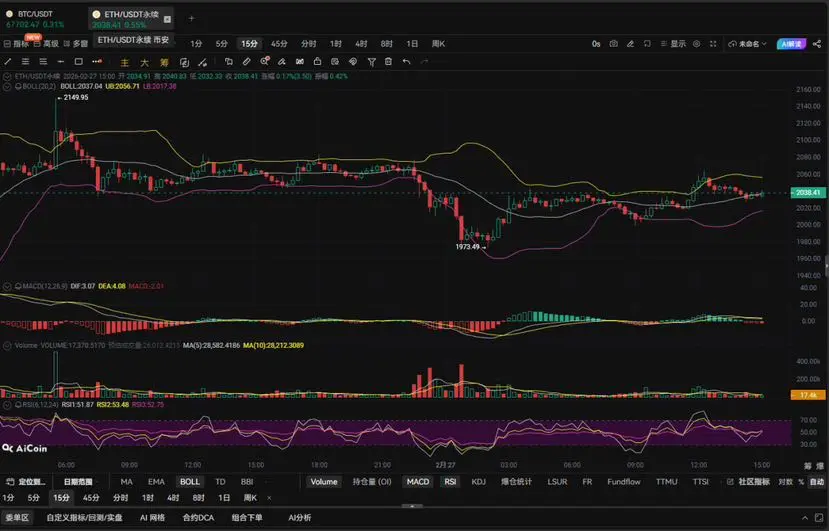
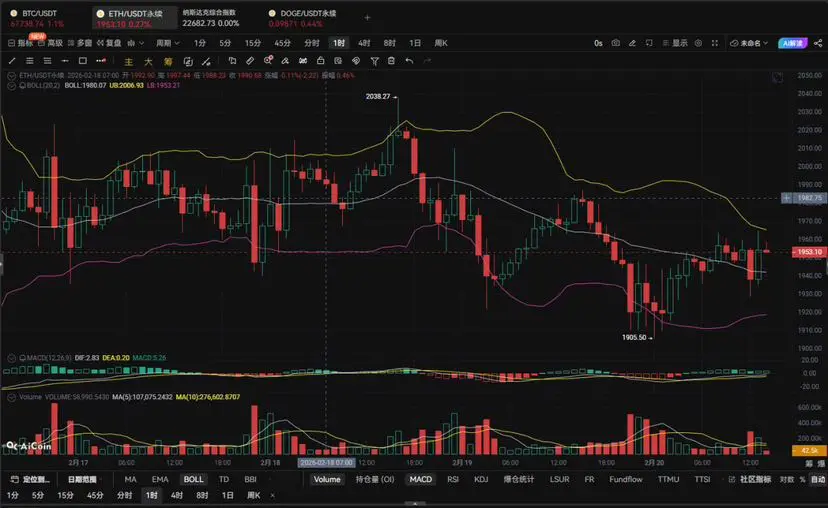
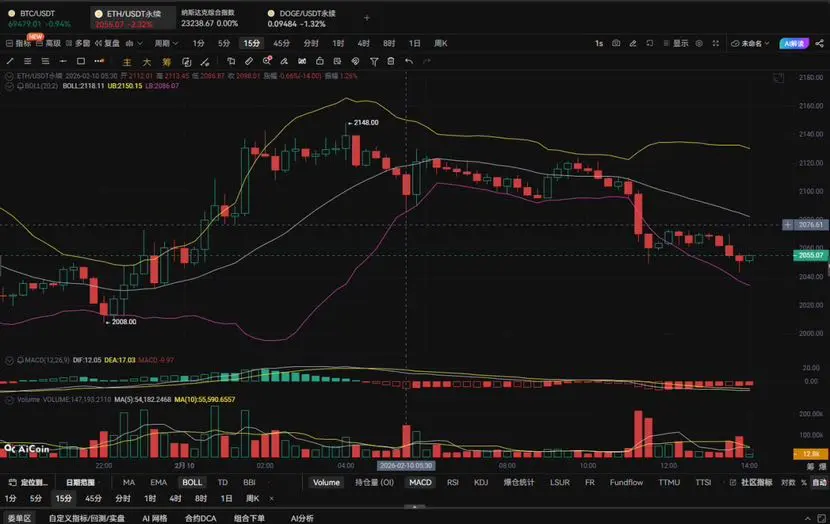
ETH Structural Strategy (15m + 1H)
Main Path
Rebound Failure → Continued Pullback → Re-Engagement
Current Structural Judgment
ETH shows a peak at 2038:
Failed to Break Higher
Continuous Decline Below Moving Averages
Returns to the 1950 level
Currently:
👉 Second correction phase after an upward move
👉 1H level weak oscillating structure
Not a trend reversal bullish phase.
Technical Structural Features
BOLL
15m
Upper Band Pressed Down
Middle Band Flattening and Turning Down
Price repeatedly pressured at the middle band
➡️ Short-term bears control the rhythm
1H
Middle Band beginning to flatten
ETH-1,53%
- Reward
- 2
- 1
- Repost
- Share
ToLife :
:
Wishing you great wealth in the Year of the Horse 🐴2026 * 2 * 19
Main Path
Range Oscillation → Upper Boundary Resistance → Rebound Test
ETH Current Structure (15m + 1H)
Price rebounded from 1920
Entering a 1950 — 2000 range oscillation
Closest rebound near 1985
Then falls back to around 1960
Belongs to:
Weak correction oscillation after decline
Not a trend reversal.
Technical Structural Features
BOLL
15m:
Middle band flat
Upper and lower bands converging
Price repeatedly crossing the middle band
Typical oscillation structure
1H:
Middle band horizontal
Upper band continuously pressing down
Overall still a weak consolidation zone
MACD
15m: Momen
ETH-1,53%
- Reward
- 1
- Comment
- Repost
- Share
ETH Wave Structure (1H)
Trend Judgment
After multiple rejections at the 2100 level, it has pulled back,
Currently at 1980 — 1990.
Overall:
A weakening structure after high-level oscillation
Short-term bearish dominance
Still operating within the range
This is not a one-sided trend.
Reasons:
1H repeatedly tested 2030–2050 without stabilization
Resistance formed near the high of 2038
BOLL middle band moving flat and downward
Price falling back into the middle-lower band area
MACD turning green again
Bars enlarging
Momentum weakening
Key Levels
Resistance Zone
2000–2010: Short-term rebound resist
ETH-1,53%
- Reward
- 3
- Comment
- Repost
- Share
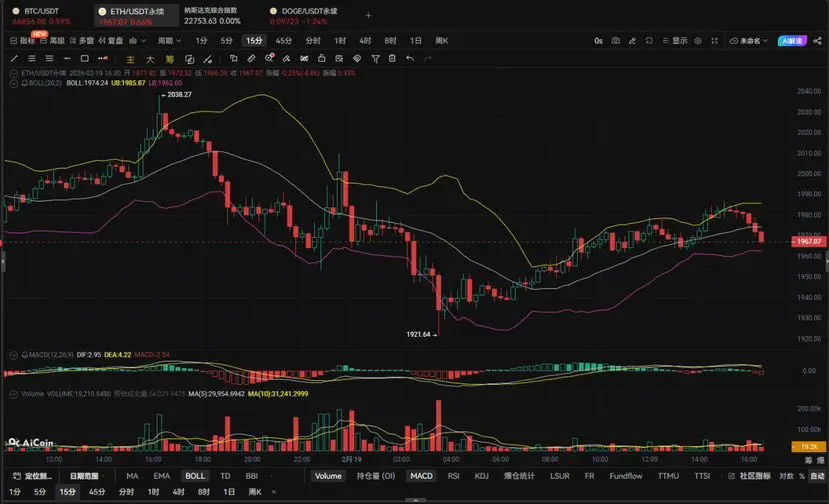
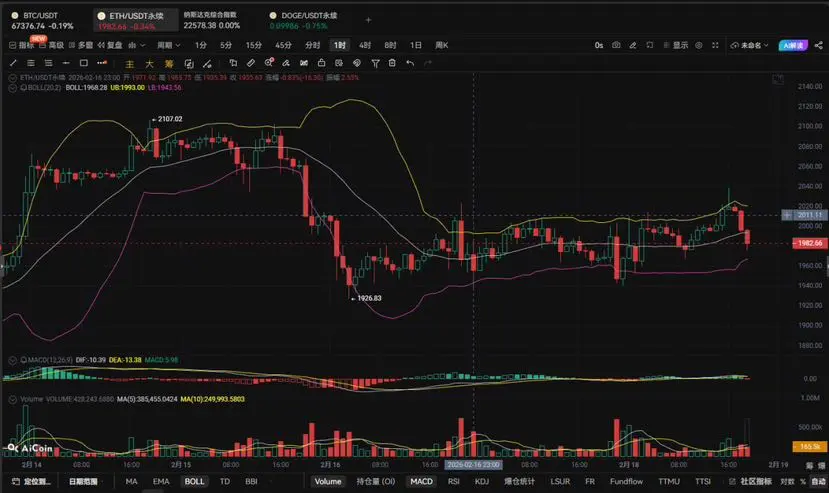
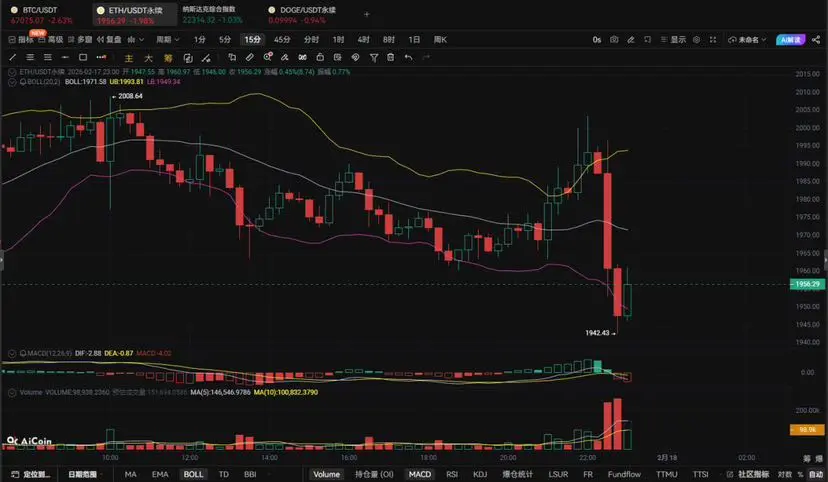
Main Path
Break below structure → Emotional release → Technical rebound
ETH current structure (15m + 1H)
Price oscillating above 2000
Volume surge breaks below 1975
Lowest touch at 1942
Currently trading in the 1950 — 1985 range
Type:
Weak rebound after breaking support
Not a trend reversal
Technical structural features:
BOLL
15m:
Lower band widening
Price accelerating along the lower band
Rebound near the middle band
Middle band still declining
Indicates a weak rebound structure
1H:
Middle band pressing down
Price returning below the middle band
Trend structure has weakened
Upper band beginni
ETH-1,53%
- Reward
- 1
- Comment
- Repost
- Share
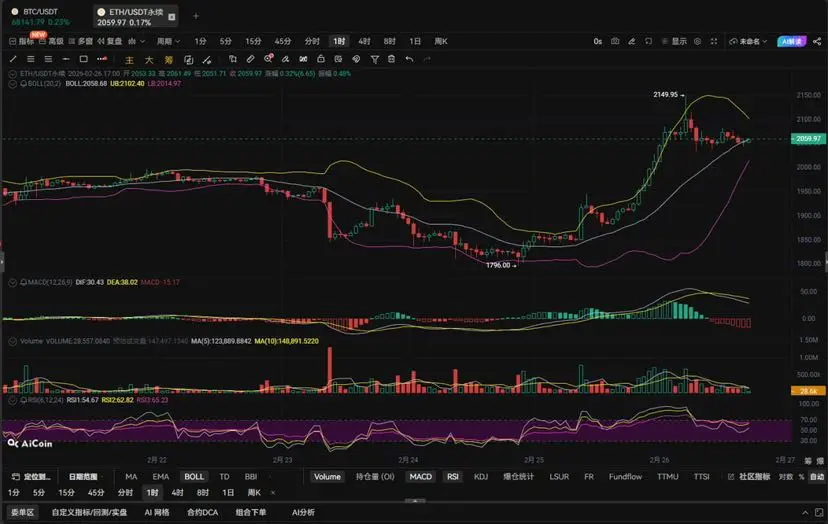
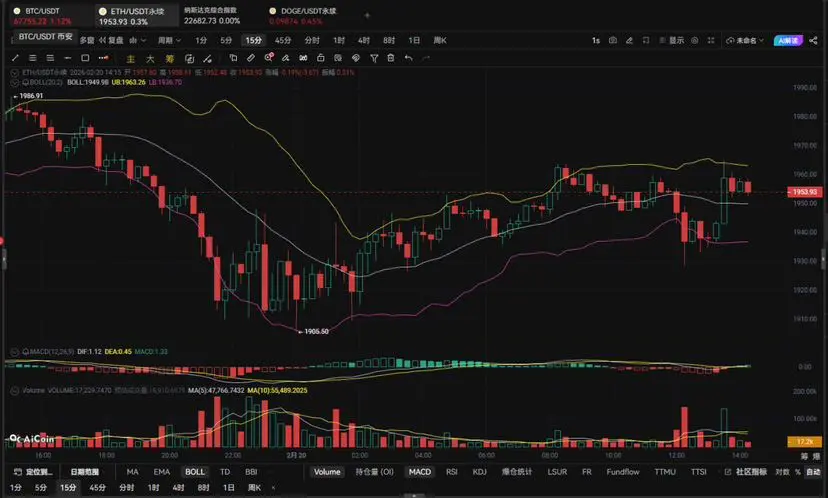
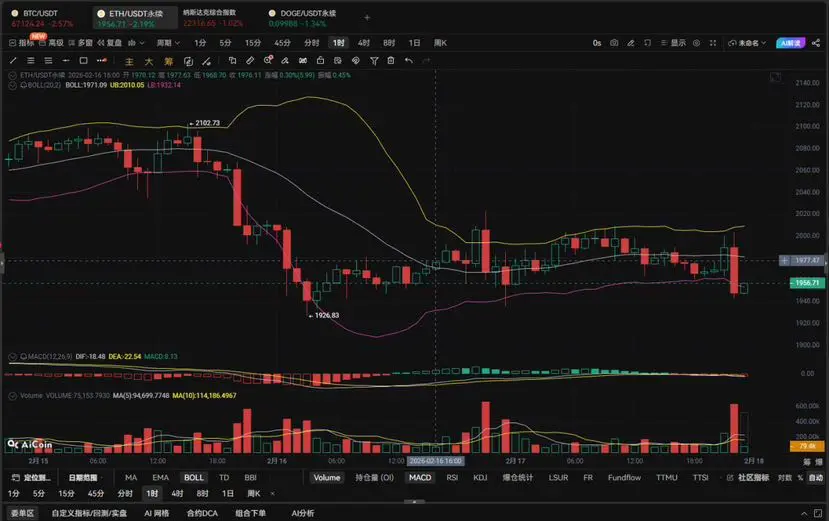
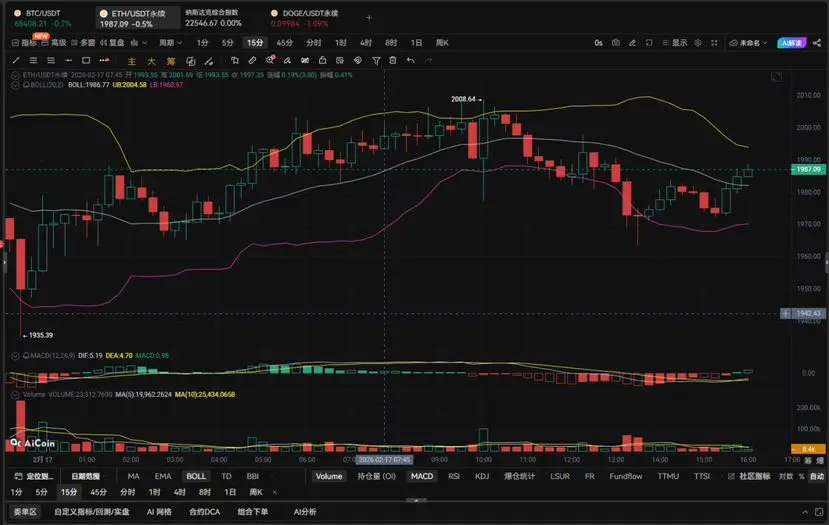
Time: 2026217
Cycle: 15m + 1H
Main Path
Oscillation correction → Key level selection → Volume increase determines direction
Current Structure (15m + 1H)
ETH rebounds from around 1926
Touches above 2008 at the highest
Then falls back to around 1970
Currently trading in the 1985 — 1995 range
It belongs to:
Rebound after range oscillation
Not a trend reversal
Technical Structural Features:
BOLL
15m:
Upper band begins to flatten
Middle band sideways
Price repeatedly around the middle band
Indicates an oscillation structure
1H:
Still within a downward channel overall
Significant middle band resista
ETH-1,53%
- Reward
- 2
- Comment
- Repost
- Share
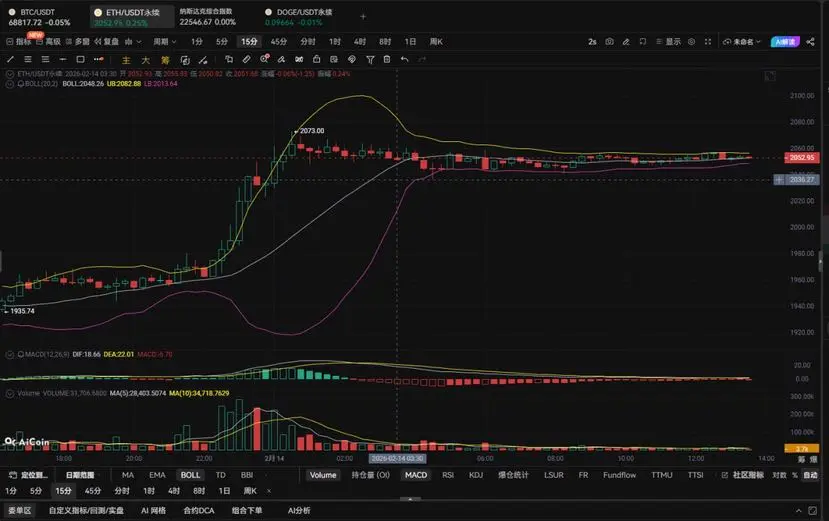
Main Path
“Rapid rise met with resistance → Momentum weakens → Pullback confirms rhythm”
ETH Current Structure (15m + 1H)
Completed a wave of rebound
Price rose from around 2034
Touched as high as 2107 — 2110 area
Currently pulling back to around 2070
Belongs to:
Pullback phase after encountering resistance during a rally
Not a trend reversal
Technical Structural Features:
BOLL
15m:
Rally peaks at the upper band then pulls back
Middle band flattens
Price pulls back near the middle band
A correction after strong momentum
1H:
Upper band flattens
Price falls back near the middle band
If the middl
ETH-1,53%
- Reward
- 1
- Comment
- 1
- Share
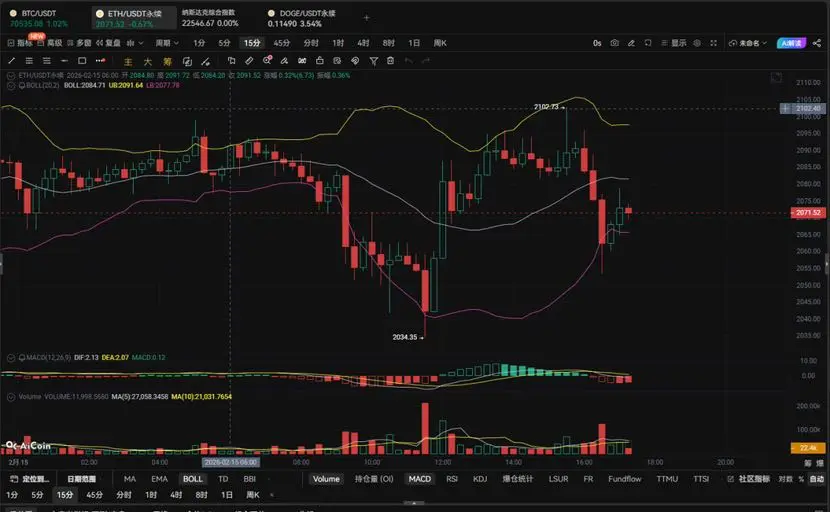
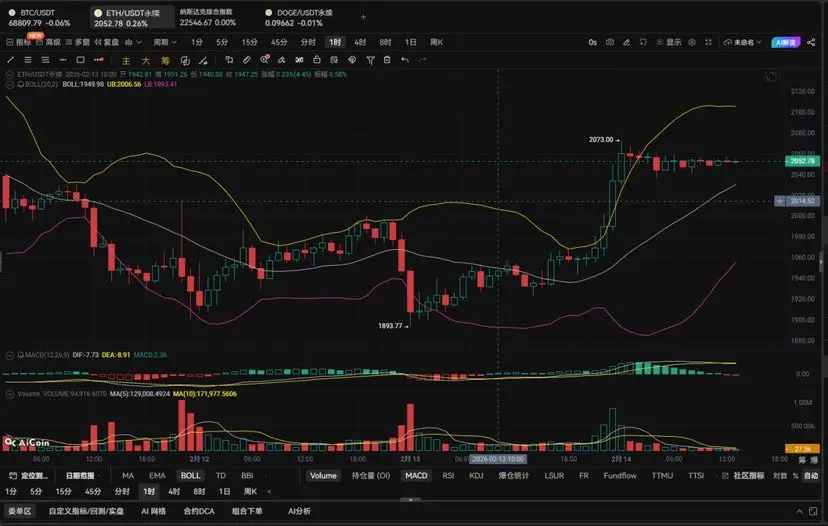
Main Path
"Breakout Complete → Momentum Release → Sideways Consolidation"
ETH Current Structure (15m + 1H)
A wave of rapid ascent has been completed
Price started around 1935
Volume breakthrough of the 2000 — 2020 resistance zone
Highest touch at 2073
Currently operating in the 2040 — 2060 range
It belongs to:
Post-breakout high-level consolidation
Not a bearish reversal structure
Technical Structural Features:
BOLL
15m:
Rallying up and running along the upper band
Upper band begins to flatten
Mid-band rapidly rising
Currently in strong sideways consolidation
1H:
Upper band opening
Mid-band co
ETH-1,53%
- Reward
- 2
- 1
- Repost
- Share
ABABBABA:
The analysis is very detailed, thank you!I've been posting for so long, and nobody even checks the homepage. I'll post again when I have free time later. #当前行情抄底还是观望?
View Original- Reward
- like
- Comment
- Repost
- Share
"Order One Disrupted, Why Prefer Not to Move"
View Original- Reward
- 7
- 1
- Repost
- Share
Jeremytrader :
:
What a good analysisWant a more detailed view of the personal homepage
ETH Swing Structure (1H)
Trend Judgment
1736 → 2152 Rapid rise followed by quick pullback,
Currently oscillating around 2050.
Overall still belongs to:
Pullback after rebound structure
Has not yet shifted into a new bullish trend.
Reasons:
Failure to break above 2150
Pullback and break below the key 2100 level
1H moving averages turning downward
MACD forming a death cross and declining
Volume unable to sustain after rebound
Key Levels
Resistance Zone
2100–2120: Rebound resistance
2150–2160: Strong previous high resistance
2200: Trend reversal
ETH-1,53%
- Reward
- 1
- 2
- Repost
- Share
Jeremytrader:
Very good, excellent analysisView More