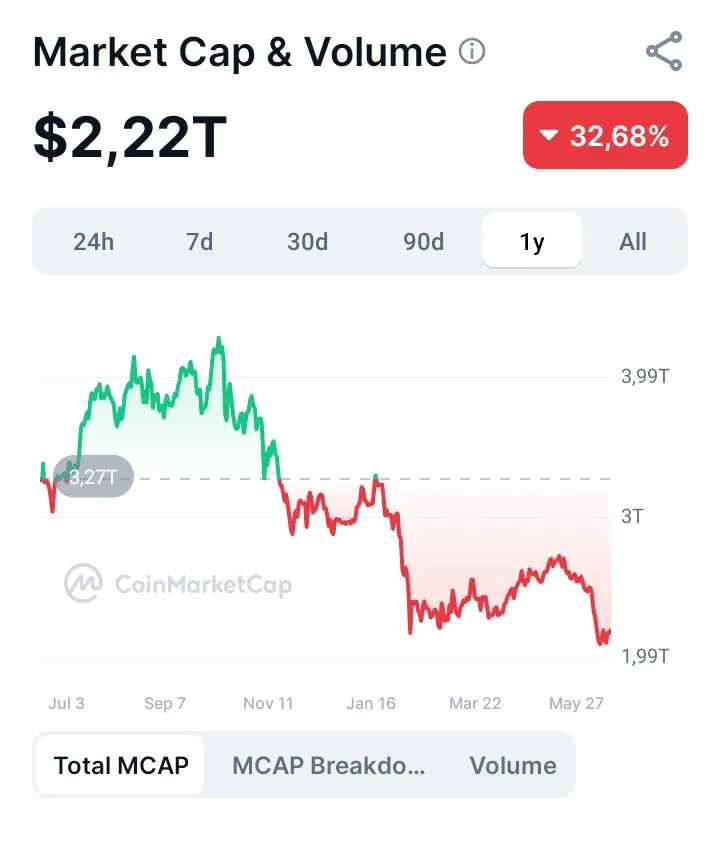
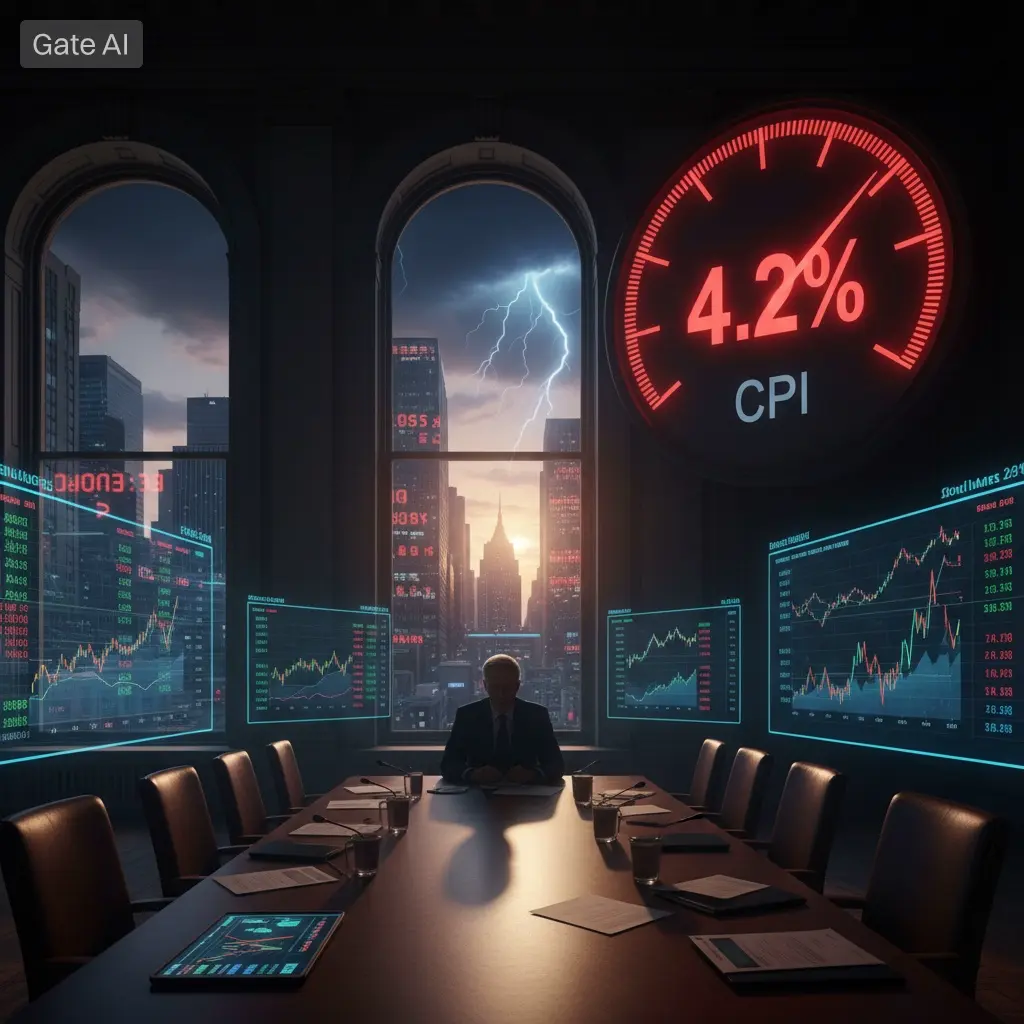
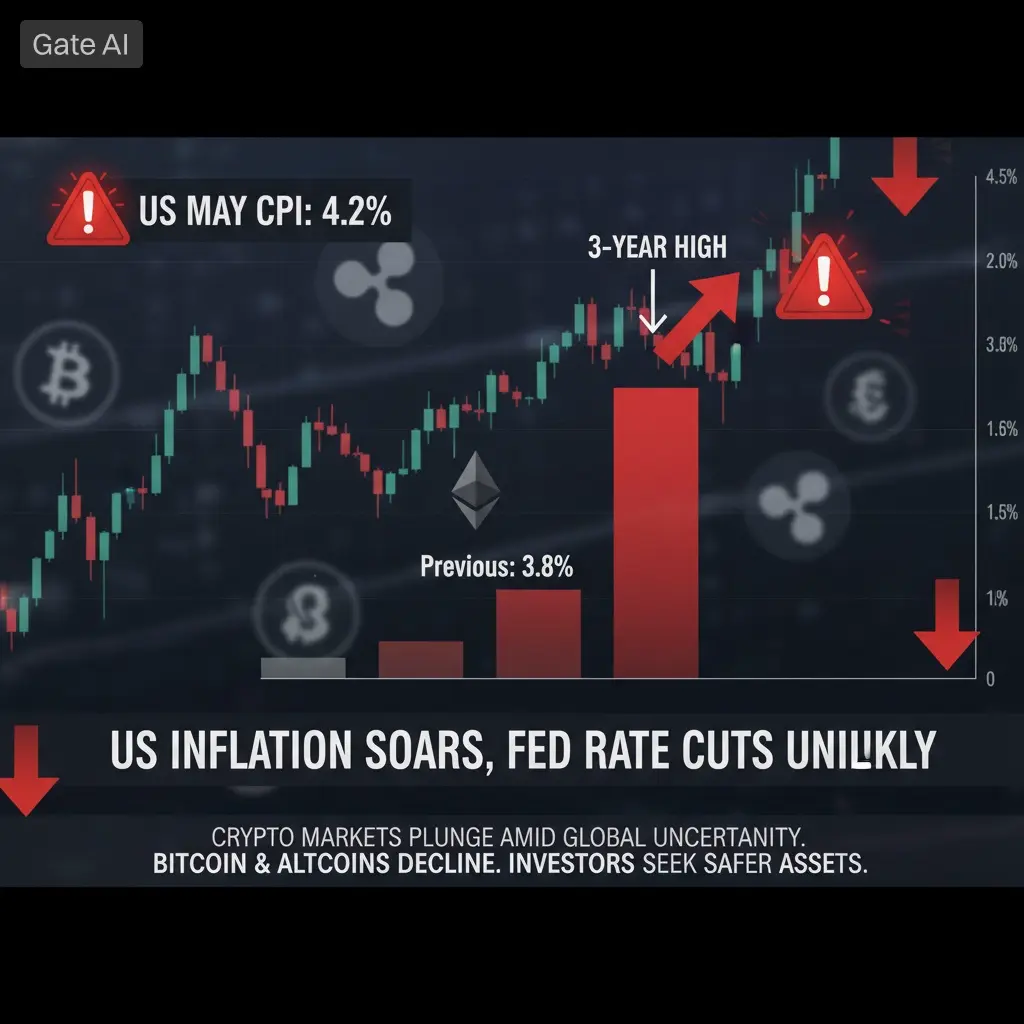
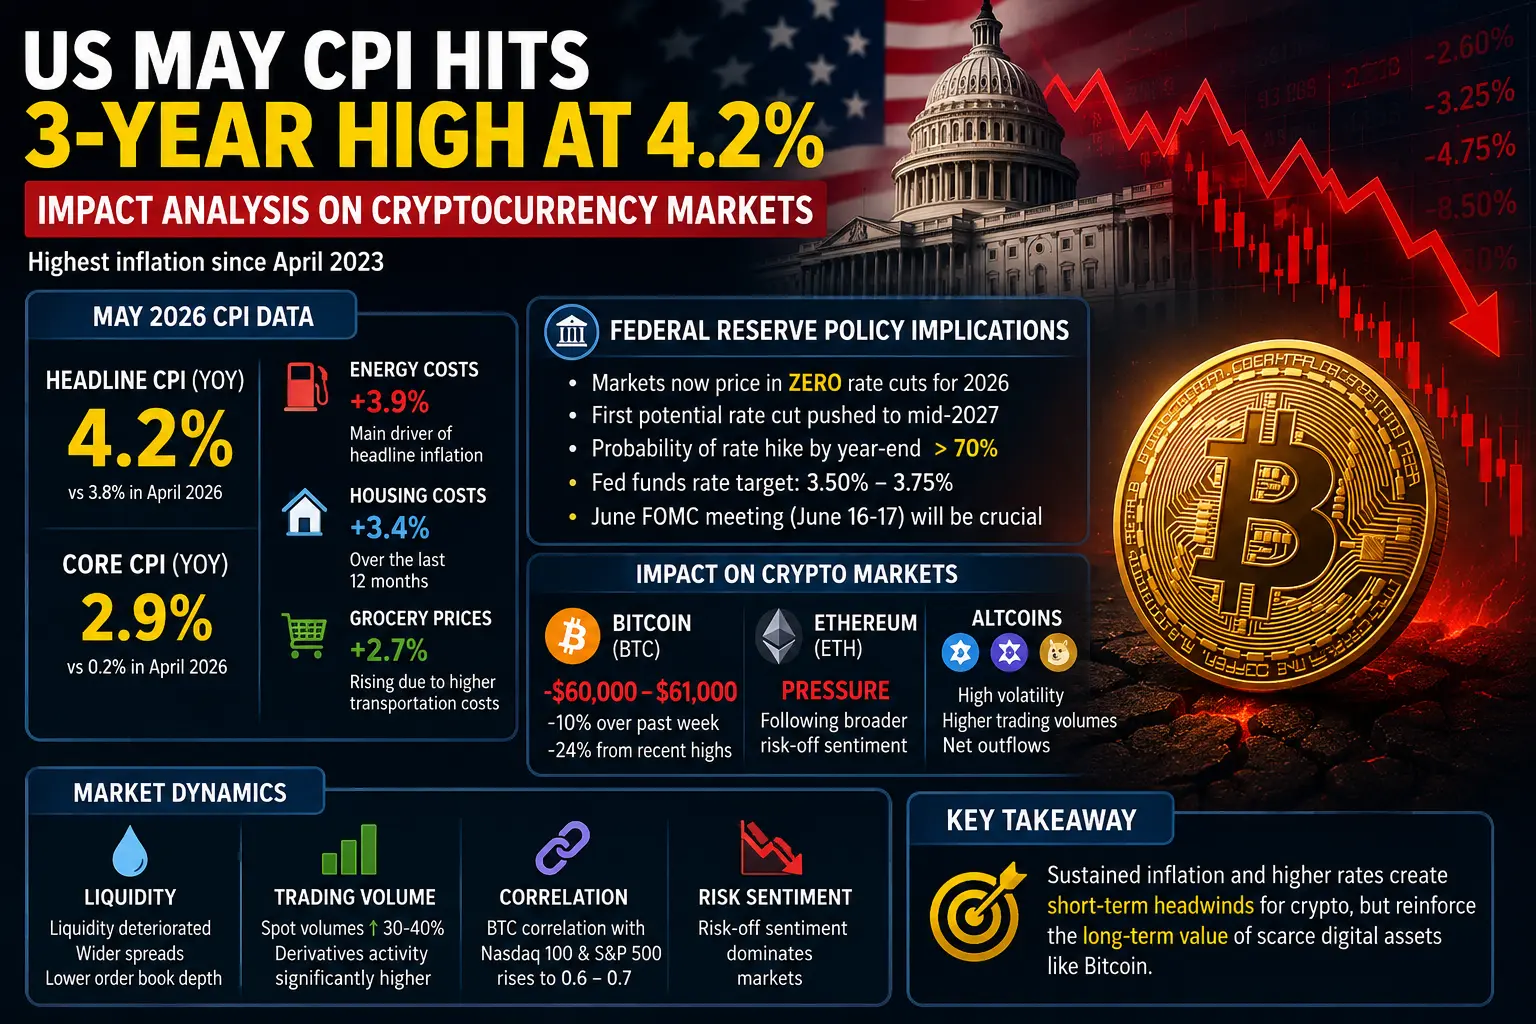
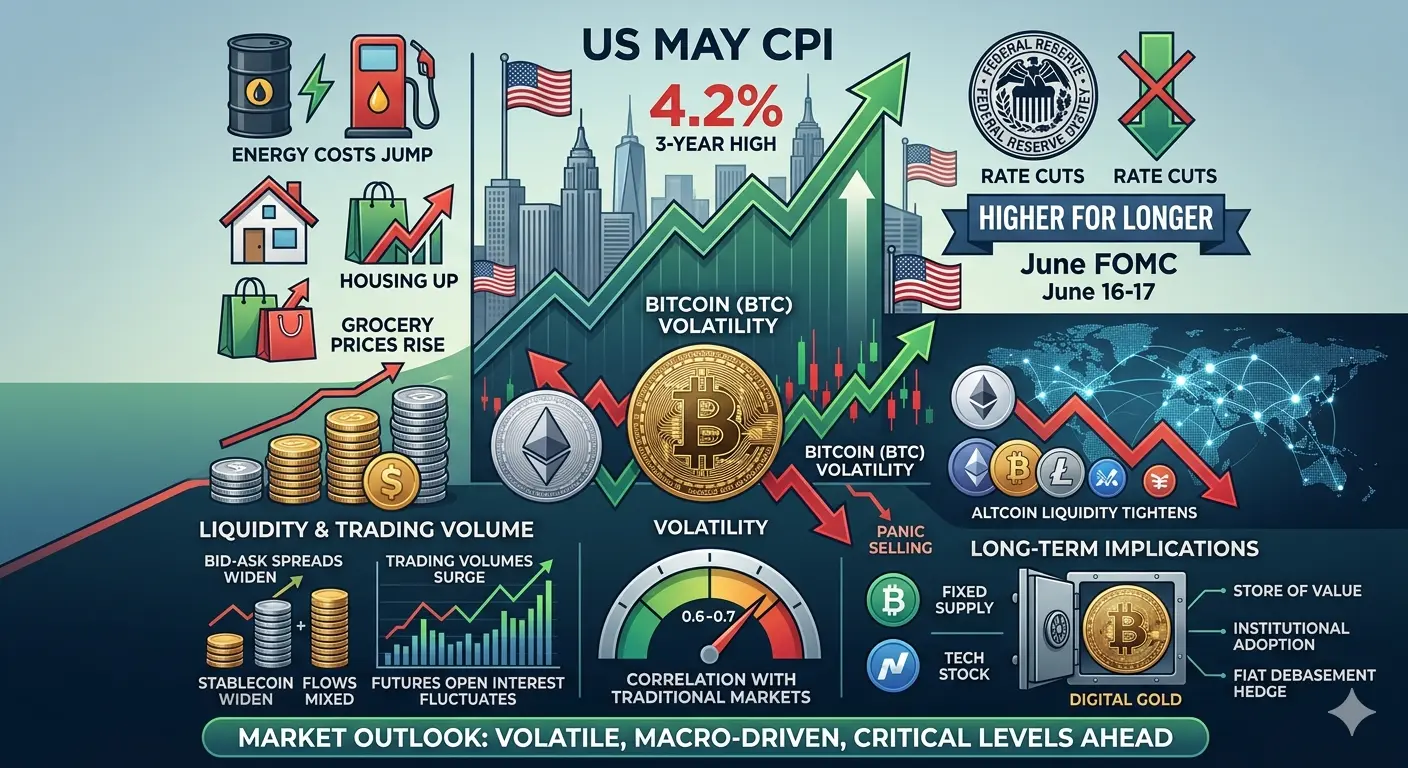
The total crypto market capitalization has fallen from $2.34 trillion to $2.16 trillion. That's a 26.29% loss since the beginning of the year. And these losses have accelerated in recent weeks. As someone writing this, let me say this: these numbers are frightening. But distinguishing between fear and reality is more important than ever. Let's first look at the anatomy of this decline. The crypto market peaked at $4.2 trillion in October 2025. It's currently at $2.16 trillion. That's about a 48% drop since the peak. That's a huge number. But in the winter of 2022, the same market fell by 78% and didn't collapse. It rebuilt. This historical context doesn't change everything, but it offers a framework. The reasons for this decline are documented. First, macroeconomic pressure. The conflict with Iran, which began on February 28, closed the Strait of Hormuz. 20% of global oil supply passes through this strait. Oil approached $110. The May CPI was announced at 4.2%. The Fed interest rate cut scenario has completely disappeared. Goldman Sachs has removed all expectations of rate cuts from its model for 2026. In this environment, risk assets always sell. Crypto also sold.
Secondly, ETF outflows. Since mid-May, there have been over $4 billion in outflows from Bitcoin ETFs. This mechanical selling pressure directly impacted the spot market. Net outflows were recorded for five consecutive weeks.
Thirdly, leverage liquidation. On June 4th, $1.6 billion was liquidated in a single day. Leveraged long positions were forcibly closed. This selling pressure pulled the price down further, triggered new liquidations, and the cycle fed itself. Fourthly, competition. The SpaceX IPO opened at $135, with a valuation of $1.75 trillion. Large-scale technology and AI opportunities drew capital away from crypto.
All of these happened simultaneously. That's why the decline accelerated. But now I'm evaluating each of these pressures individually.
The Iran agreement was signed. The Bosphorus was opened. Oil prices are falling. Energy-related inflationary pressure is decreasing. This eliminates the primary reason for the decline.
ETF flows began to stabilize on June 12. On that day, none of the 12 ETF products recorded outflows. A single day isn't a trend. But this appears to be the first signal of a change in direction.
The leverage system has been cleaned up. The June 4 liquidation zeroed out open interest. The accumulating leverage risk is largely gone. A clean market is paving the way for new positions to be established.
SpaceX's IPO is complete. It was announced that the company has $1.3 billion worth of Bitcoin on its balance sheet. This competing liquidity exceeded demand and unexpectedly became bullish news for crypto.
I'm looking at the technical chart.
2.16 trillion was formed after breaking multiple support levels. It is currently trading slightly above the lows of $2.05 trillion. $2.19 trillion was the breakout level at the beginning of June and is currently acting as resistance. The 20-day exponential moving average is $2.33 trillion. 50-day 2.44 trillion. 100-day 2.50 trillion. To rebuild the long-term structure, the 200-day 2.67 trillion level needs to be broken.
Breaking these levels is not easy. But the catalysts that make breaking these levels possible are currently in play. The Strait of Hormuz has opened. The Fed is meeting today. The CLARITY Act is pending in the Senate. Multiple institutional ETF applications, including Grayscale, are in the process.
At this point, the question is: Is this decline a structural collapse like the winter of 2022, or a macro correction triggered by external shocks?
2022 saw a crisis created by crypto itself. Terra collapsed. Large funds went bankrupt. Centralized institutions operated with fraudulent balance sheets. Trust was directed towards the crypto infrastructure itself.
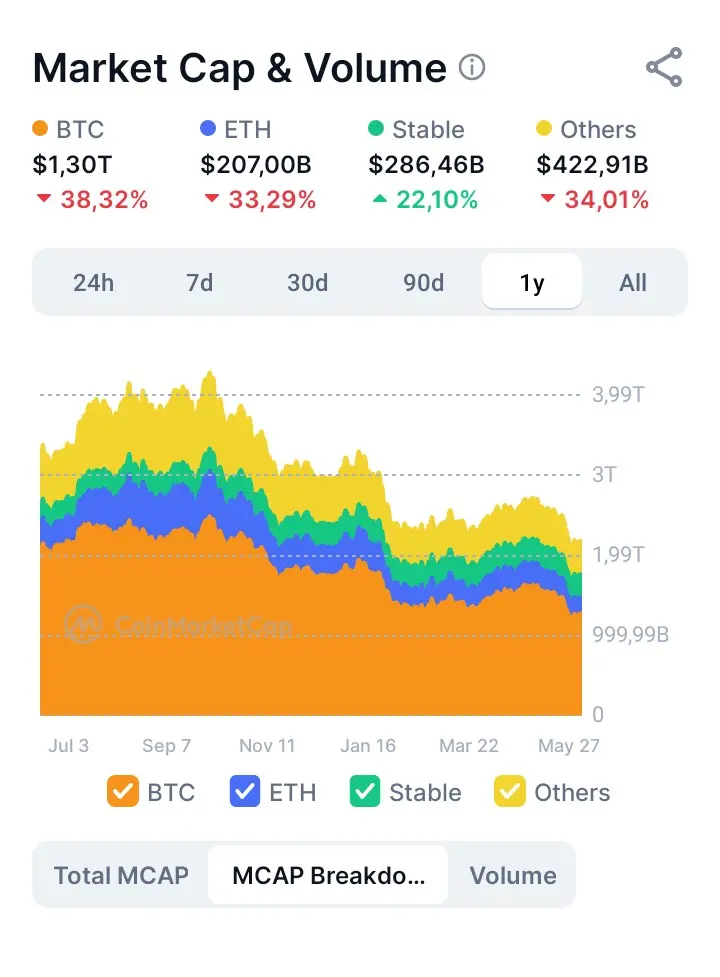
In 2026, this is gone. The Bitcoin ETF infrastructure is working. Institutional custody has matured. DTCC is at the table with Ripple. Central banks are holding crypto assets like gold on their balance sheets. SpaceX and dozens of companies are holding crypto reserves. The accumulation on the chain continues.
An external shock is very different from a system rotting from within.
I am holding my positions in Gate under this scenario. A 26% annual loss is a large number. But a number without context only generates fear. When read in context, it may indicate the end of one era and the beginning of a new one. I cannot know for sure. But I can be prepared.
This content is for informational purposes only and does not constitute financial advice.
#MyGateTradeStory
#USPPIHits2.5YearHigh
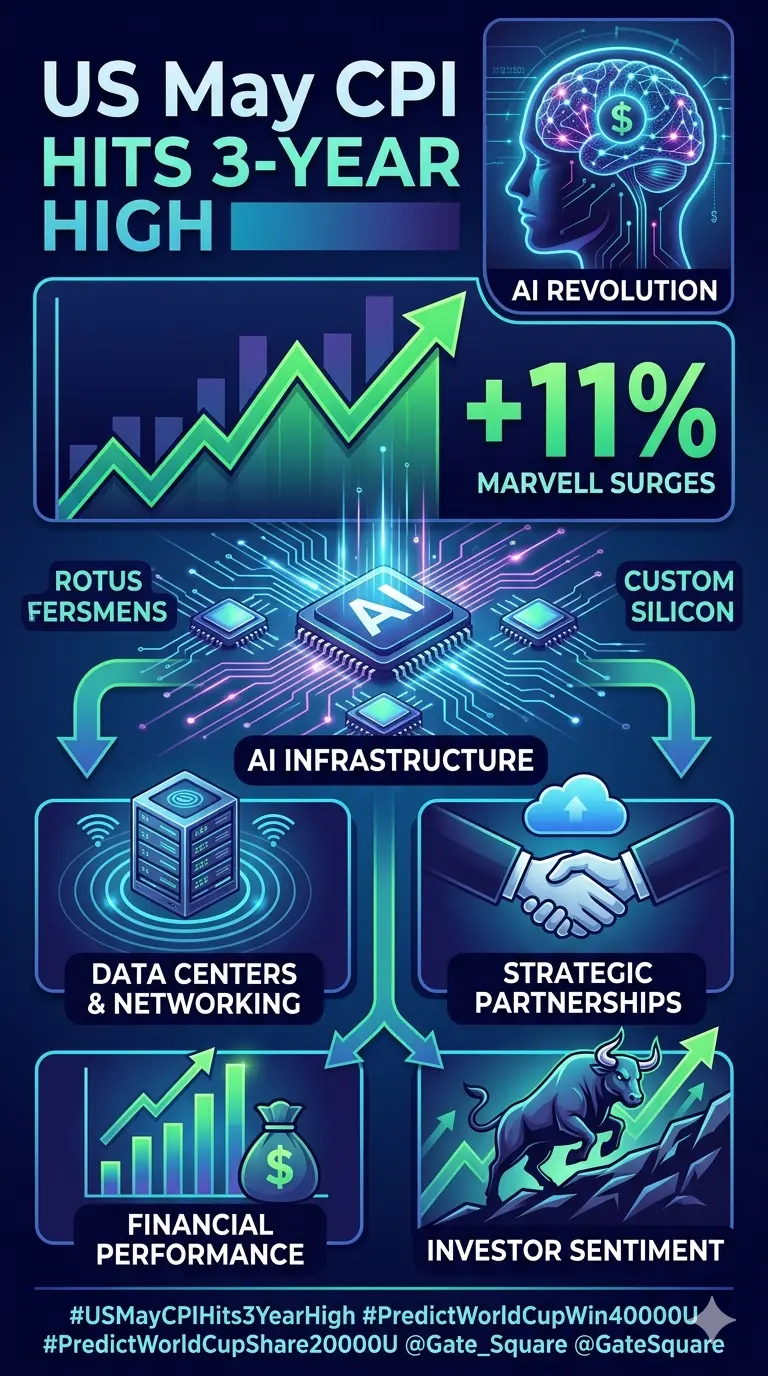
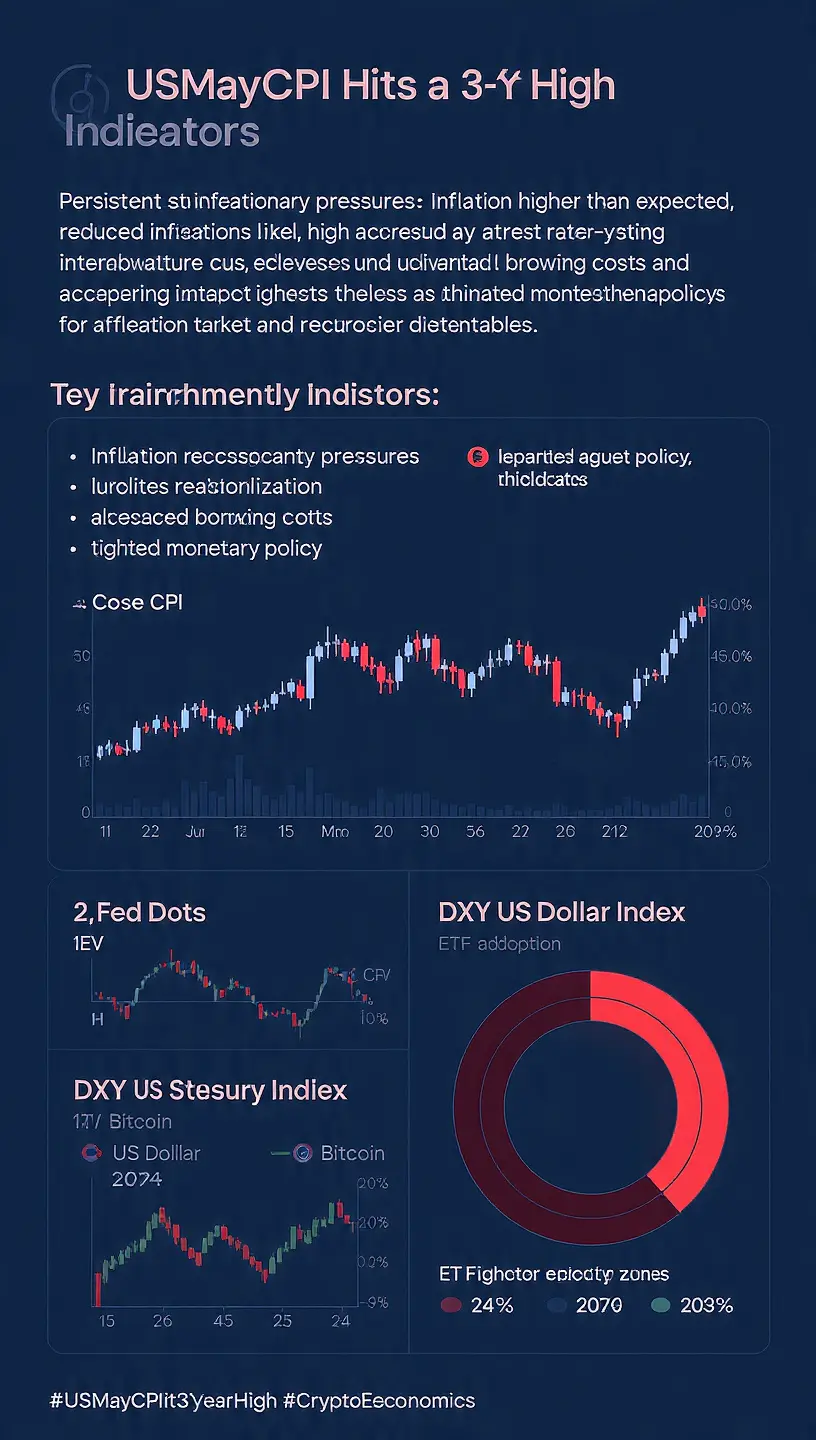
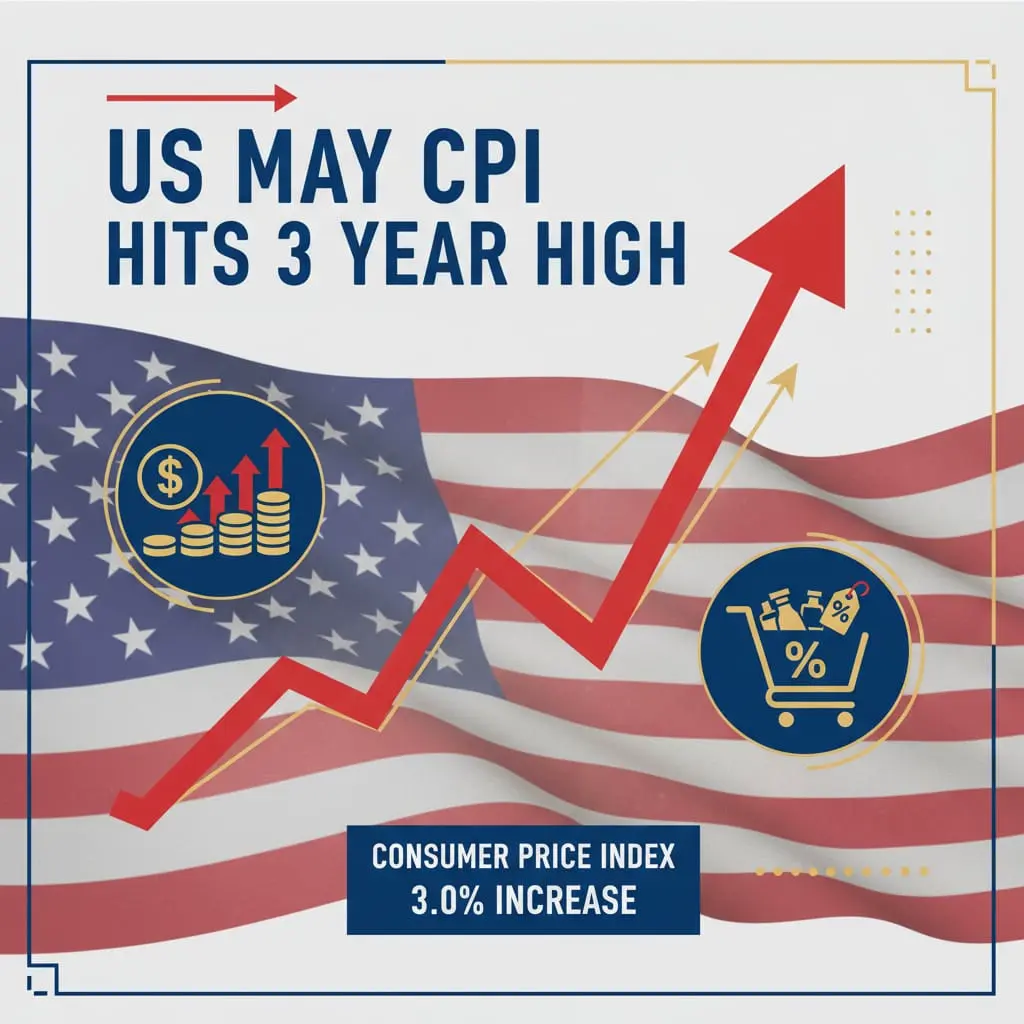
#USMayCPIHits3YearHigh
Secondly, ETF outflows. Since mid-May, there have been over $4 billion in outflows from Bitcoin ETFs. This mechanical selling pressure directly impacted the spot market. Net outflows were recorded for five consecutive weeks.
Thirdly, leverage liquidation. On June 4th, $1.6 billion was liquidated in a single day. Leveraged long positions were forcibly closed. This selling pressure pulled the price down further, triggered new liquidations, and the cycle fed itself. Fourthly, competition. The SpaceX IPO opened at $135, with a valuation of $1.75 trillion. Large-scale technology and AI opportunities drew capital away from crypto.
All of these happened simultaneously. That's why the decline accelerated. But now I'm evaluating each of these pressures individually.
The Iran agreement was signed. The Bosphorus was opened. Oil prices are falling. Energy-related inflationary pressure is decreasing. This eliminates the primary reason for the decline.
ETF flows began to stabilize on June 12. On that day, none of the 12 ETF products recorded outflows. A single day isn't a trend. But this appears to be the first signal of a change in direction.
The leverage system has been cleaned up. The June 4 liquidation zeroed out open interest. The accumulating leverage risk is largely gone. A clean market is paving the way for new positions to be established.
SpaceX's IPO is complete. It was announced that the company has $1.3 billion worth of Bitcoin on its balance sheet. This competing liquidity exceeded demand and unexpectedly became bullish news for crypto.
I'm looking at the technical chart.
2.16 trillion was formed after breaking multiple support levels. It is currently trading slightly above the lows of $2.05 trillion. $2.19 trillion was the breakout level at the beginning of June and is currently acting as resistance. The 20-day exponential moving average is $2.33 trillion. 50-day 2.44 trillion. 100-day 2.50 trillion. To rebuild the long-term structure, the 200-day 2.67 trillion level needs to be broken.
Breaking these levels is not easy. But the catalysts that make breaking these levels possible are currently in play. The Strait of Hormuz has opened. The Fed is meeting today. The CLARITY Act is pending in the Senate. Multiple institutional ETF applications, including Grayscale, are in the process.
At this point, the question is: Is this decline a structural collapse like the winter of 2022, or a macro correction triggered by external shocks?
2022 saw a crisis created by crypto itself. Terra collapsed. Large funds went bankrupt. Centralized institutions operated with fraudulent balance sheets. Trust was directed towards the crypto infrastructure itself.
In 2026, this is gone. The Bitcoin ETF infrastructure is working. Institutional custody has matured. DTCC is at the table with Ripple. Central banks are holding crypto assets like gold on their balance sheets. SpaceX and dozens of companies are holding crypto reserves. The accumulation on the chain continues.
An external shock is very different from a system rotting from within.
I am holding my positions in Gate under this scenario. A 26% annual loss is a large number. But a number without context only generates fear. When read in context, it may indicate the end of one era and the beginning of a new one. I cannot know for sure. But I can be prepared.
This content is for informational purposes only and does not constitute financial advice.
#MyGateTradeStory
#USPPIHits2.5YearHigh
#USMayCPIHits3YearHigh