


📢 Gate Plaza | 6/4 Hot Topic: #ETH跌幅超5%
The crypto market has suffered a devastating crash this week, with Ethereum dropping over 5% and falling below $1,800, while Bitcoin slid under $63,000 for the first time since February. Over $1.1 billion in leveraged positions were liquidated in 24 hours, predominantly hitting long traders who expected prices to rise. The Crypto Fear and Greed Index plunged to 12, signaling extreme fear across the market. This crash did not happen overnight; it was the culmination of multiple negative catalysts stacking together throughout the week, creating a cascading liquidation spiral that wiped out billions in capital.
The selling pressure on Bitcoin began on June 1 when Strategy, the largest publicly traded holder of Bitcoin, sold $2.5 million worth of BTC, shaking investor confidence in the institutional demand thesis. This was followed by 13 consecutive days of outflows from U.S.-listed spot Bitcoin ETFs totaling over $3.2 billion, signaling that institutional money was actively de-risking. On June 2, Mt. Gox moved $739 million to a new wallet, reviving fears of potential distribution-related selling. Meanwhile, stalled U.S.-Iran ceasefire negotiations pushed Brent crude oil higher for a third consecutive day on renewed Middle East fighting, fueling inflation concerns that further dampened risk appetite in crypto. As if that were not enough, traders were rotating capital out of crypto into high-flying AI stocks and IPOs, with SpaceX filing a confidential IPO and Anthropic reportedly preparing to go public, drawing speculative capital away from digital assets.
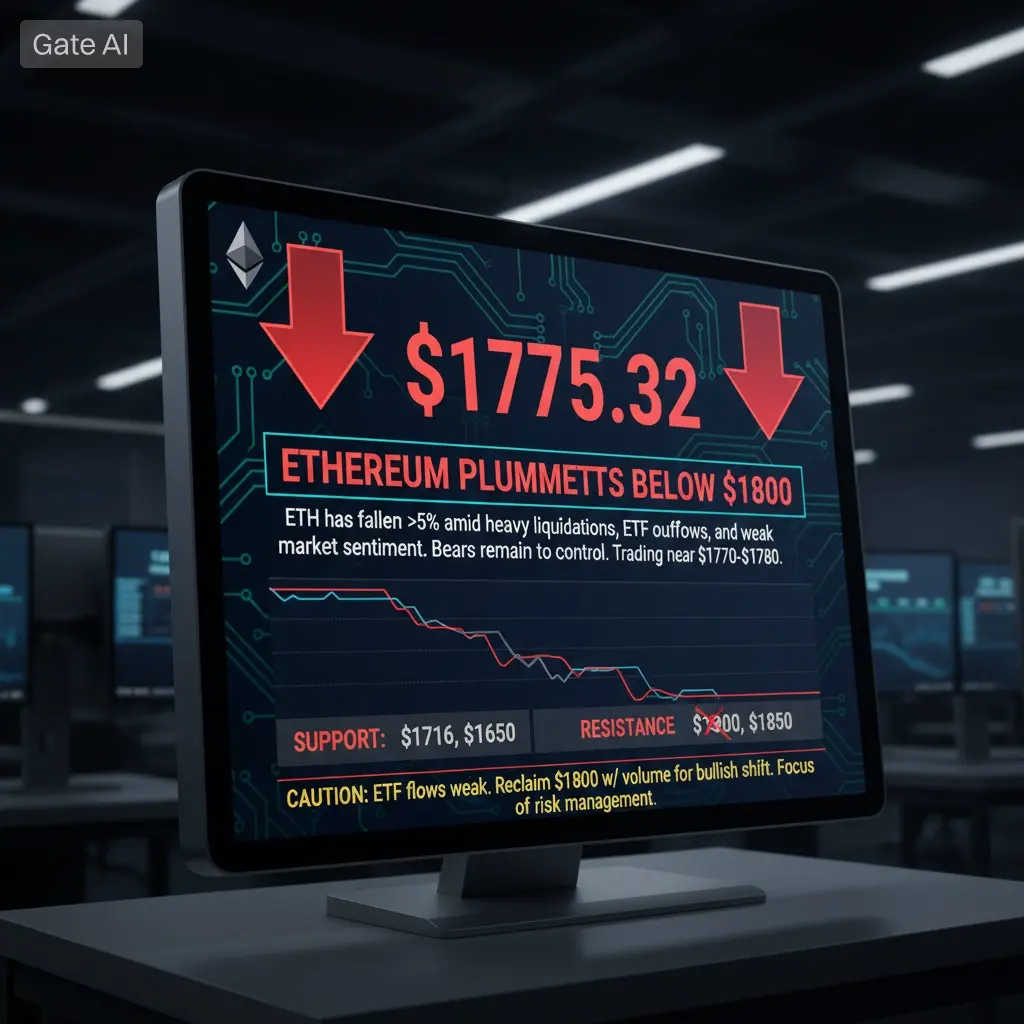
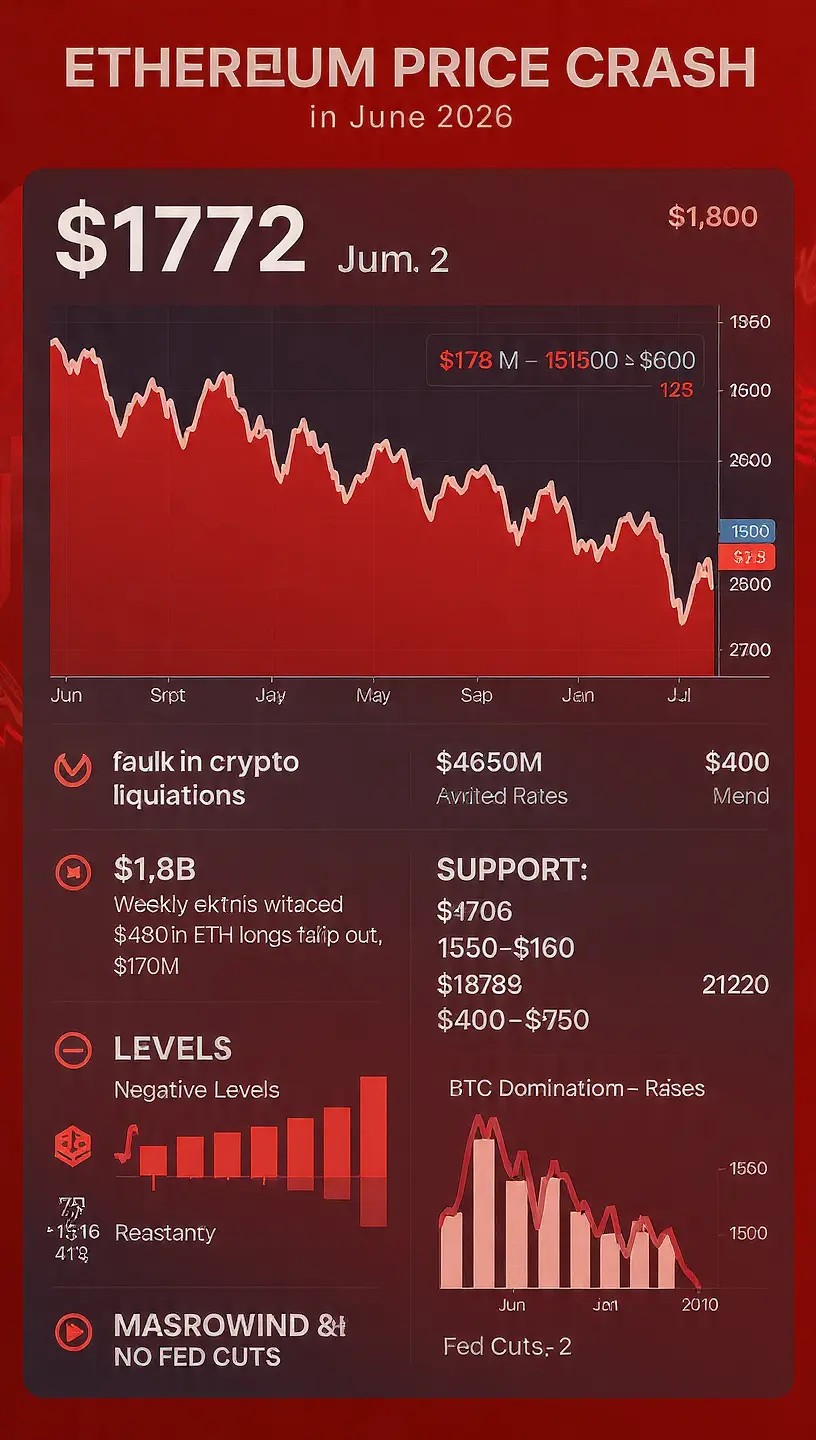
Bitcoin broke below $70,000 on June 2, then crashed below $63,000 on June 4, marking a decline of more than 14% this week and 21% over the past four weeks. The 30-day implied volatility index BVIV spiked to 53.17, its highest since early April, and protective put options at the $50,000 strike became the most traded bet on Deribit. Ethereum tracked Bitcoin's slide closely, dropping 5.52% on June 3 to $1,871.83, breaking below the critical $2,000 psychological support, and then sliding further to touch a low near $1,716 on June 4. The $2,000 zone has now flipped from a support floor into overhead resistance. From its late-May level near $2,400, ETH has lost approximately 25% in just two weeks, an extraordinary collapse for the second-largest cryptocurrency by market value. ETH trading volume surged dramatically, with daily volumes exceeding $870 million on June 4 alone, confirming aggressive panic selling rather than orderly position adjustment.
The liquidation data tells a brutal story. On June 2 alone, approximately $1.8 billion in leveraged positions were wiped out, with $1.57 billion from longs and only $215.7 million from shorts. BTC accounted for $833 million of those liquidations, and ETH contributed nearly $480 million. On June 3, another $1 billion-plus in liquidations occurred, with 91.3% of BTC liquidations on the long side. The total across the week easily exceeds $2.5 billion, making this one of the largest liquidation events in 2026. These forced closures amplified the downward spiral, as each liquidation wave pushed prices lower, triggering more liquidations in a self-reinforcing cascade that is characteristic of overleveraged markets.
Gate raised two important discussion questions for the community, and here are my detailed answers.
The first question asks about the trend analysis for BTC and ETH and future price predictions. For Bitcoin, the technical picture is deeply bearish in the short term. The daily RSI has registered around 10, approaching the February 5 low of 8.95, which is an extremely oversold reading. On-balance volume signals strong bearish pressure, and the 30-day moving average has been decisively broken. Key support lies at $60,000, which is the next major psychological and technical level. If that fails, analysts are watching $50,000 as a potential bottom, and the high volume of put options at that strike confirms that traders are hedging for precisely that scenario. The 200-day simple moving average sits near $100,887 for longer-term context, but that is far above current prices and irrelevant to immediate trading. Bitcoin dominance has fallen nearly 4% since mid-May, with its own RSI plunging to 5.56, meaning altcoins are suffering even more. In the medium term, BTC needs to reclaim $70,000 and hold it as support to signal any meaningful recovery. My prediction is that BTC will likely test $60,000 within the next week, and if macro headwinds persist, a drift toward $55,000 to $58,000 is plausible before a bottom forms. Recovery above $70,000 would require fresh positive catalysts such as resumed ETF inflows, regulatory clarity, or macroeconomic relief.
For Ethereum, the situation is even more precarious. ETH has lost the ascending trendline on the daily chart and is now trading within a descending parallel channel on the weekly chart. The $2,000 level has flipped from support to resistance, and the next defensive line is $1,800, which has already been breached. Below that, $1,700 is the immediate technical support, and if that fails, ETH could slide toward $1,500 to $1,600 based on historical support zones. The RSI on the daily chart has dipped to 11.48, marginally below its February trough, indicating deeply oversold conditions but not necessarily a reversal signal. However, there is one interesting signal: the ETH/BTC pair printed a bullish TBT divergence, hinting at relative strength versus Bitcoin. This means ETH may outperform BTC during the eventual recovery phase, even though both are falling now. My prediction is that ETH will likely continue declining toward $1,700 in the immediate term, with $1,500 as a worst-case scenario if BTC breaks below $60,000. For any meaningful rebound, ETH must first reclaim $2,000 as support, which would require BTC stabilizing above $65,000 and renewed buying interest.
The second question asks about asset allocation and risk management strategies during severe market volatility. When markets crash this violently, the first priority is capital preservation, not profit seeking. Here is how I approach it. First, reduce leverage immediately. The liquidation data proves that overleveraged long positions are the primary casualties in crashes. If you are using margin or futures, cut your position sizes to no more than 2% of total portfolio value per trade. Second, maintain a stablecoin reserve of at least 30% to 40% of your portfolio. This provides dry powder for buying opportunities and prevents you from being forced to sell at the worst possible time. Third, use stop-loss orders on every leveraged or actively managed position. Set stops at levels that limit losses to 5% to 10% per position, and do not move them wider when prices approach them. Fourth, diversify across asset classes. The current crash shows that crypto is falling while equities are hitting all-time highs driven by AI. Holding some exposure to traditional markets reduces correlation risk. Fifth, if you believe in the long-term value of BTC and ETH, consider scaling in gradually rather than buying the dip all at once. Divide your planned allocation into 4 to 6 equal purchases spaced over 2 to 4 weeks. This reduces the risk of catching a false bottom. Sixth, avoid chasing narrative-driven tokens during a crash. While some AI-related tokens like Near Protocol and Humanity Protocol have shown temporary gains, these are highly speculative and can reverse just as quickly. Stick to the top two assets, BTC and ETH, for your core holdings during high-volatility periods.
My personal view on the current situation is that this crash is primarily driven by macro and structural factors rather than fundamental deterioration in crypto itself. The combination of ETF outflows, Mt. Gox fears, geopolitical tension, and capital rotation into AI and IPOs created a perfect storm. However, oversold RSI readings near 10 on BTC and 11 on ETH suggest that a short-term bounce is likely within days, even if the broader downtrend continues. I would not rush to buy the dip aggressively. Instead, I would wait for signs of stabilization such as declining liquidation volumes, a bounce with follow-through buying, and BTC holding above $60,000 for at least 48 hours. Once those conditions appear, I would begin scaling into ETH and BTC positions gradually, because prices near $1,700 for ETH and $60,000 for BTC could represent significant value if the macro environment improves later in 2026. For now, caution and capital preservation should be the overriding priorities.@Gate_Square #ShareYourUSStocksWinNvidia #DailyPolymarketHotspot #TradeCFDWinGold
The crypto market has suffered a devastating crash this week, with Ethereum dropping over 5% and falling below $1,800, while Bitcoin slid under $63,000 for the first time since February. Over $1.1 billion in leveraged positions were liquidated in 24 hours, predominantly hitting long traders who expected prices to rise. The Crypto Fear and Greed Index plunged to 12, signaling extreme fear across the market. This crash did not happen overnight; it was the culmination of multiple negative catalysts stacking together throughout the week, creating a cascading liquidation spiral that wiped out billions in capital.
The selling pressure on Bitcoin began on June 1 when Strategy, the largest publicly traded holder of Bitcoin, sold $2.5 million worth of BTC, shaking investor confidence in the institutional demand thesis. This was followed by 13 consecutive days of outflows from U.S.-listed spot Bitcoin ETFs totaling over $3.2 billion, signaling that institutional money was actively de-risking. On June 2, Mt. Gox moved $739 million to a new wallet, reviving fears of potential distribution-related selling. Meanwhile, stalled U.S.-Iran ceasefire negotiations pushed Brent crude oil higher for a third consecutive day on renewed Middle East fighting, fueling inflation concerns that further dampened risk appetite in crypto. As if that were not enough, traders were rotating capital out of crypto into high-flying AI stocks and IPOs, with SpaceX filing a confidential IPO and Anthropic reportedly preparing to go public, drawing speculative capital away from digital assets.
Bitcoin broke below $70,000 on June 2, then crashed below $63,000 on June 4, marking a decline of more than 14% this week and 21% over the past four weeks. The 30-day implied volatility index BVIV spiked to 53.17, its highest since early April, and protective put options at the $50,000 strike became the most traded bet on Deribit. Ethereum tracked Bitcoin's slide closely, dropping 5.52% on June 3 to $1,871.83, breaking below the critical $2,000 psychological support, and then sliding further to touch a low near $1,716 on June 4. The $2,000 zone has now flipped from a support floor into overhead resistance. From its late-May level near $2,400, ETH has lost approximately 25% in just two weeks, an extraordinary collapse for the second-largest cryptocurrency by market value. ETH trading volume surged dramatically, with daily volumes exceeding $870 million on June 4 alone, confirming aggressive panic selling rather than orderly position adjustment.
The liquidation data tells a brutal story. On June 2 alone, approximately $1.8 billion in leveraged positions were wiped out, with $1.57 billion from longs and only $215.7 million from shorts. BTC accounted for $833 million of those liquidations, and ETH contributed nearly $480 million. On June 3, another $1 billion-plus in liquidations occurred, with 91.3% of BTC liquidations on the long side. The total across the week easily exceeds $2.5 billion, making this one of the largest liquidation events in 2026. These forced closures amplified the downward spiral, as each liquidation wave pushed prices lower, triggering more liquidations in a self-reinforcing cascade that is characteristic of overleveraged markets.
Gate raised two important discussion questions for the community, and here are my detailed answers.
The first question asks about the trend analysis for BTC and ETH and future price predictions. For Bitcoin, the technical picture is deeply bearish in the short term. The daily RSI has registered around 10, approaching the February 5 low of 8.95, which is an extremely oversold reading. On-balance volume signals strong bearish pressure, and the 30-day moving average has been decisively broken. Key support lies at $60,000, which is the next major psychological and technical level. If that fails, analysts are watching $50,000 as a potential bottom, and the high volume of put options at that strike confirms that traders are hedging for precisely that scenario. The 200-day simple moving average sits near $100,887 for longer-term context, but that is far above current prices and irrelevant to immediate trading. Bitcoin dominance has fallen nearly 4% since mid-May, with its own RSI plunging to 5.56, meaning altcoins are suffering even more. In the medium term, BTC needs to reclaim $70,000 and hold it as support to signal any meaningful recovery. My prediction is that BTC will likely test $60,000 within the next week, and if macro headwinds persist, a drift toward $55,000 to $58,000 is plausible before a bottom forms. Recovery above $70,000 would require fresh positive catalysts such as resumed ETF inflows, regulatory clarity, or macroeconomic relief.
For Ethereum, the situation is even more precarious. ETH has lost the ascending trendline on the daily chart and is now trading within a descending parallel channel on the weekly chart. The $2,000 level has flipped from support to resistance, and the next defensive line is $1,800, which has already been breached. Below that, $1,700 is the immediate technical support, and if that fails, ETH could slide toward $1,500 to $1,600 based on historical support zones. The RSI on the daily chart has dipped to 11.48, marginally below its February trough, indicating deeply oversold conditions but not necessarily a reversal signal. However, there is one interesting signal: the ETH/BTC pair printed a bullish TBT divergence, hinting at relative strength versus Bitcoin. This means ETH may outperform BTC during the eventual recovery phase, even though both are falling now. My prediction is that ETH will likely continue declining toward $1,700 in the immediate term, with $1,500 as a worst-case scenario if BTC breaks below $60,000. For any meaningful rebound, ETH must first reclaim $2,000 as support, which would require BTC stabilizing above $65,000 and renewed buying interest.
The second question asks about asset allocation and risk management strategies during severe market volatility. When markets crash this violently, the first priority is capital preservation, not profit seeking. Here is how I approach it. First, reduce leverage immediately. The liquidation data proves that overleveraged long positions are the primary casualties in crashes. If you are using margin or futures, cut your position sizes to no more than 2% of total portfolio value per trade. Second, maintain a stablecoin reserve of at least 30% to 40% of your portfolio. This provides dry powder for buying opportunities and prevents you from being forced to sell at the worst possible time. Third, use stop-loss orders on every leveraged or actively managed position. Set stops at levels that limit losses to 5% to 10% per position, and do not move them wider when prices approach them. Fourth, diversify across asset classes. The current crash shows that crypto is falling while equities are hitting all-time highs driven by AI. Holding some exposure to traditional markets reduces correlation risk. Fifth, if you believe in the long-term value of BTC and ETH, consider scaling in gradually rather than buying the dip all at once. Divide your planned allocation into 4 to 6 equal purchases spaced over 2 to 4 weeks. This reduces the risk of catching a false bottom. Sixth, avoid chasing narrative-driven tokens during a crash. While some AI-related tokens like Near Protocol and Humanity Protocol have shown temporary gains, these are highly speculative and can reverse just as quickly. Stick to the top two assets, BTC and ETH, for your core holdings during high-volatility periods.
My personal view on the current situation is that this crash is primarily driven by macro and structural factors rather than fundamental deterioration in crypto itself. The combination of ETF outflows, Mt. Gox fears, geopolitical tension, and capital rotation into AI and IPOs created a perfect storm. However, oversold RSI readings near 10 on BTC and 11 on ETH suggest that a short-term bounce is likely within days, even if the broader downtrend continues. I would not rush to buy the dip aggressively. Instead, I would wait for signs of stabilization such as declining liquidation volumes, a bounce with follow-through buying, and BTC holding above $60,000 for at least 48 hours. Once those conditions appear, I would begin scaling into ETH and BTC positions gradually, because prices near $1,700 for ETH and $60,000 for BTC could represent significant value if the macro environment improves later in 2026. For now, caution and capital preservation should be the overriding priorities.@Gate_Square #ShareYourUSStocksWinNvidia #DailyPolymarketHotspot #TradeCFDWinGold