#BTCMarketAnalysis
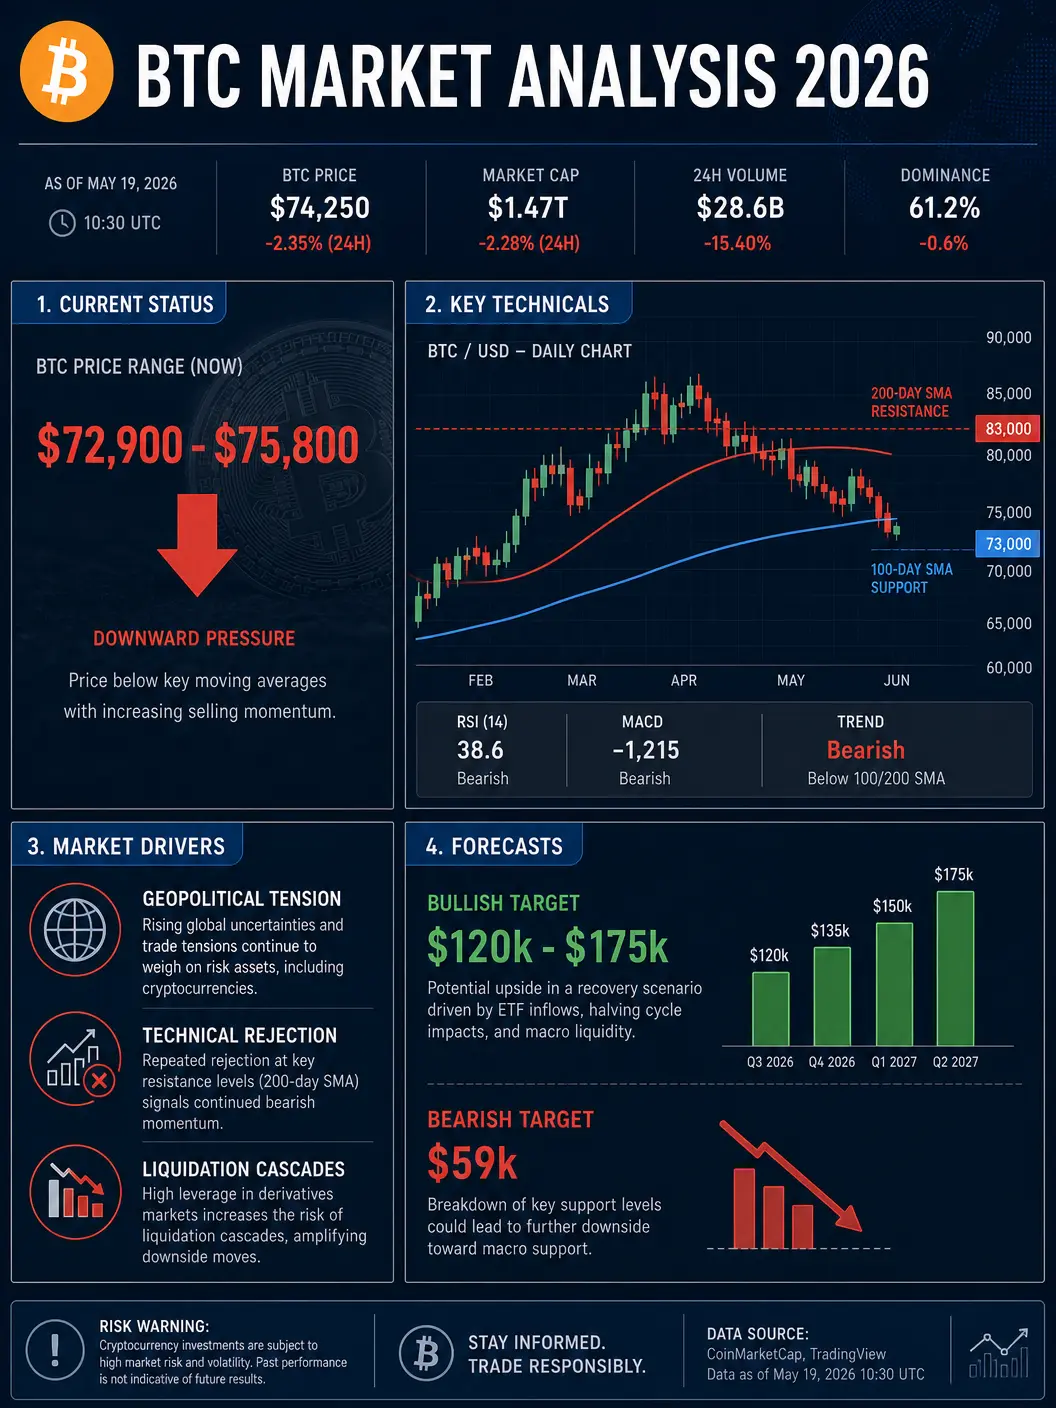
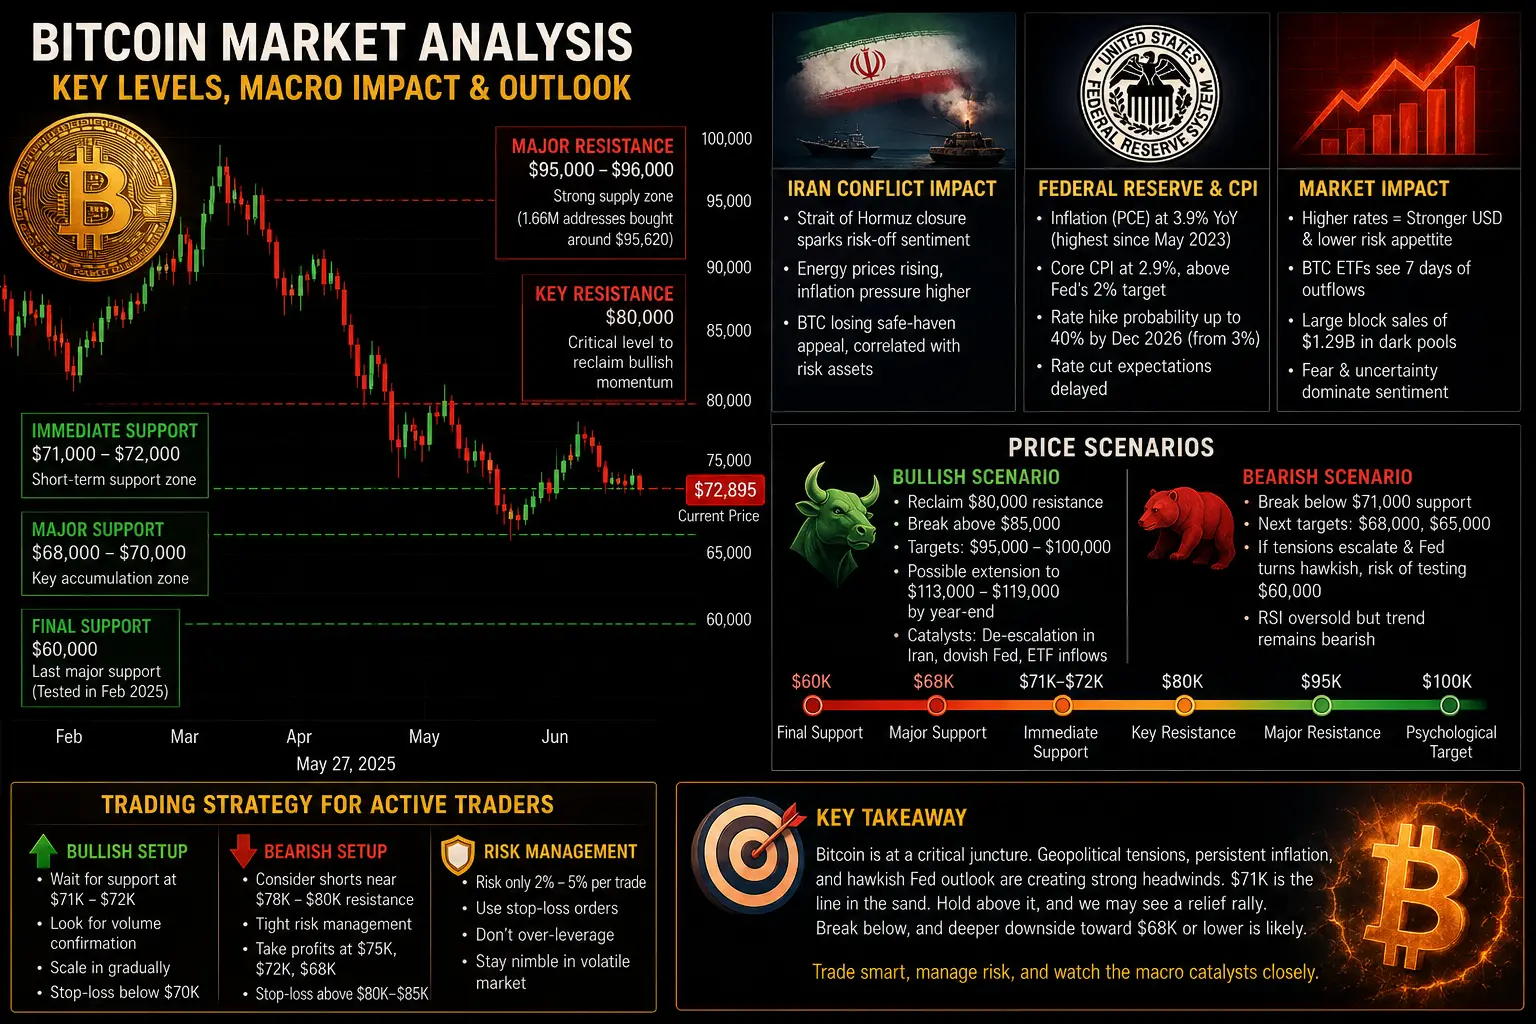
Bitcoin is currently trading around $72,900 to $75,800 depending on the exchange and timing of the market snapshot. On May 28, 2026, BTC traded close to $72,899 after falling nearly 3.6 percent within 24 hours. The overall crypto market capitalization dropped toward $2.53 trillion while Ethereum declined to nearly $1,975.59 with a 4.8 percent loss. Just two days earlier Bitcoin was trading near $77,274 before slipping toward $75,824 and then collapsing into the $73,000 zone. CME Bitcoin futures for May 2026 traded near $77,710 while June contracts hovered around $77,985, showing futures traders still expect recovery later. Prediction markets suggested BTC could stabilize around $75,000 by the end of May 29 trading
Why BTC Came Down to the 73K Level
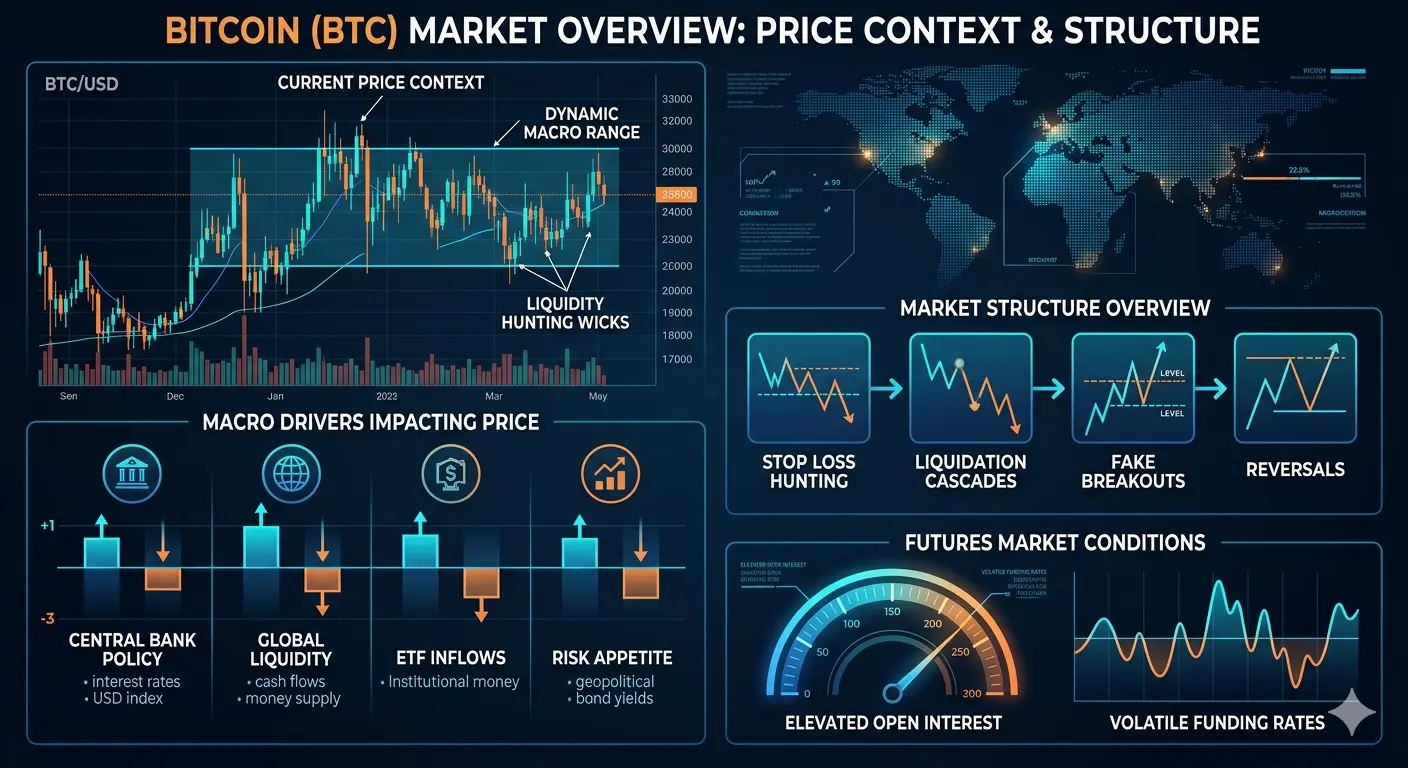
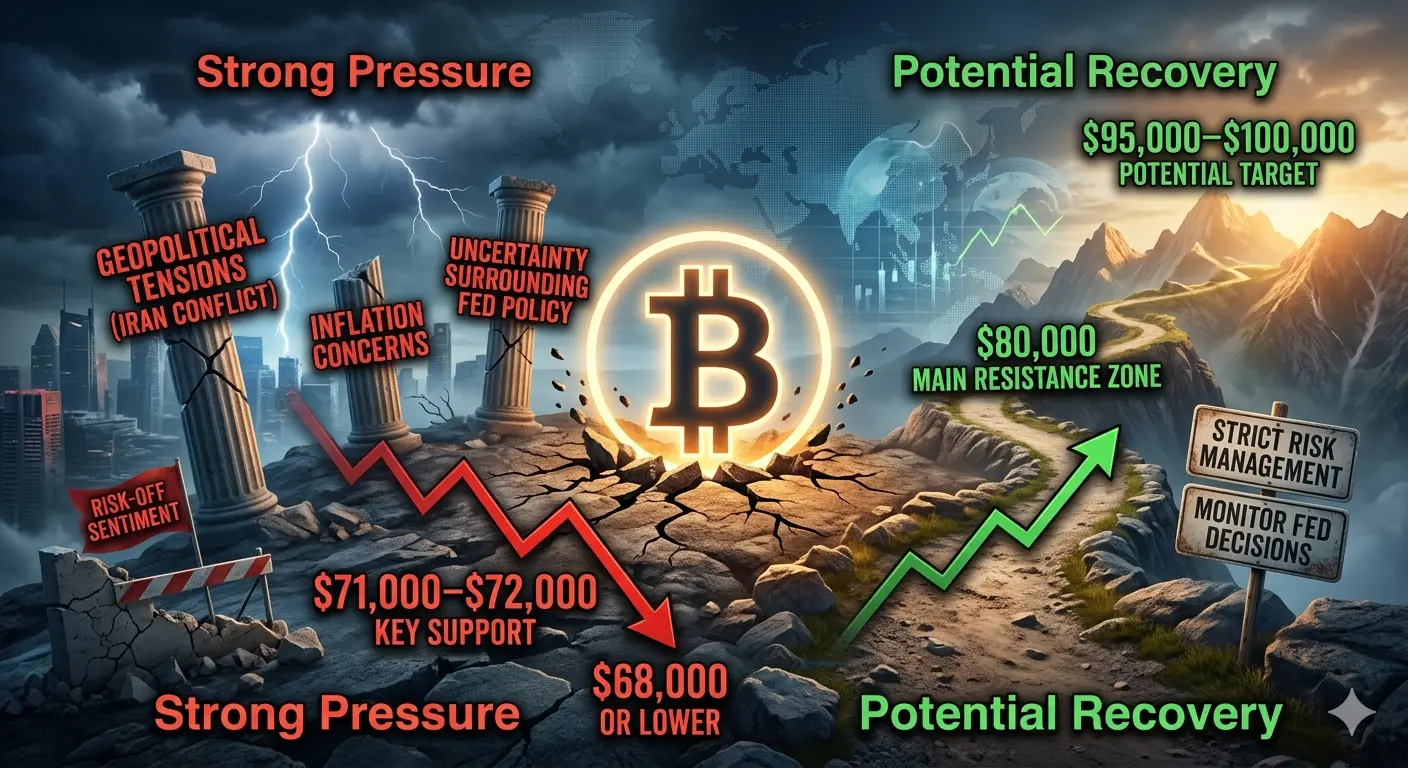
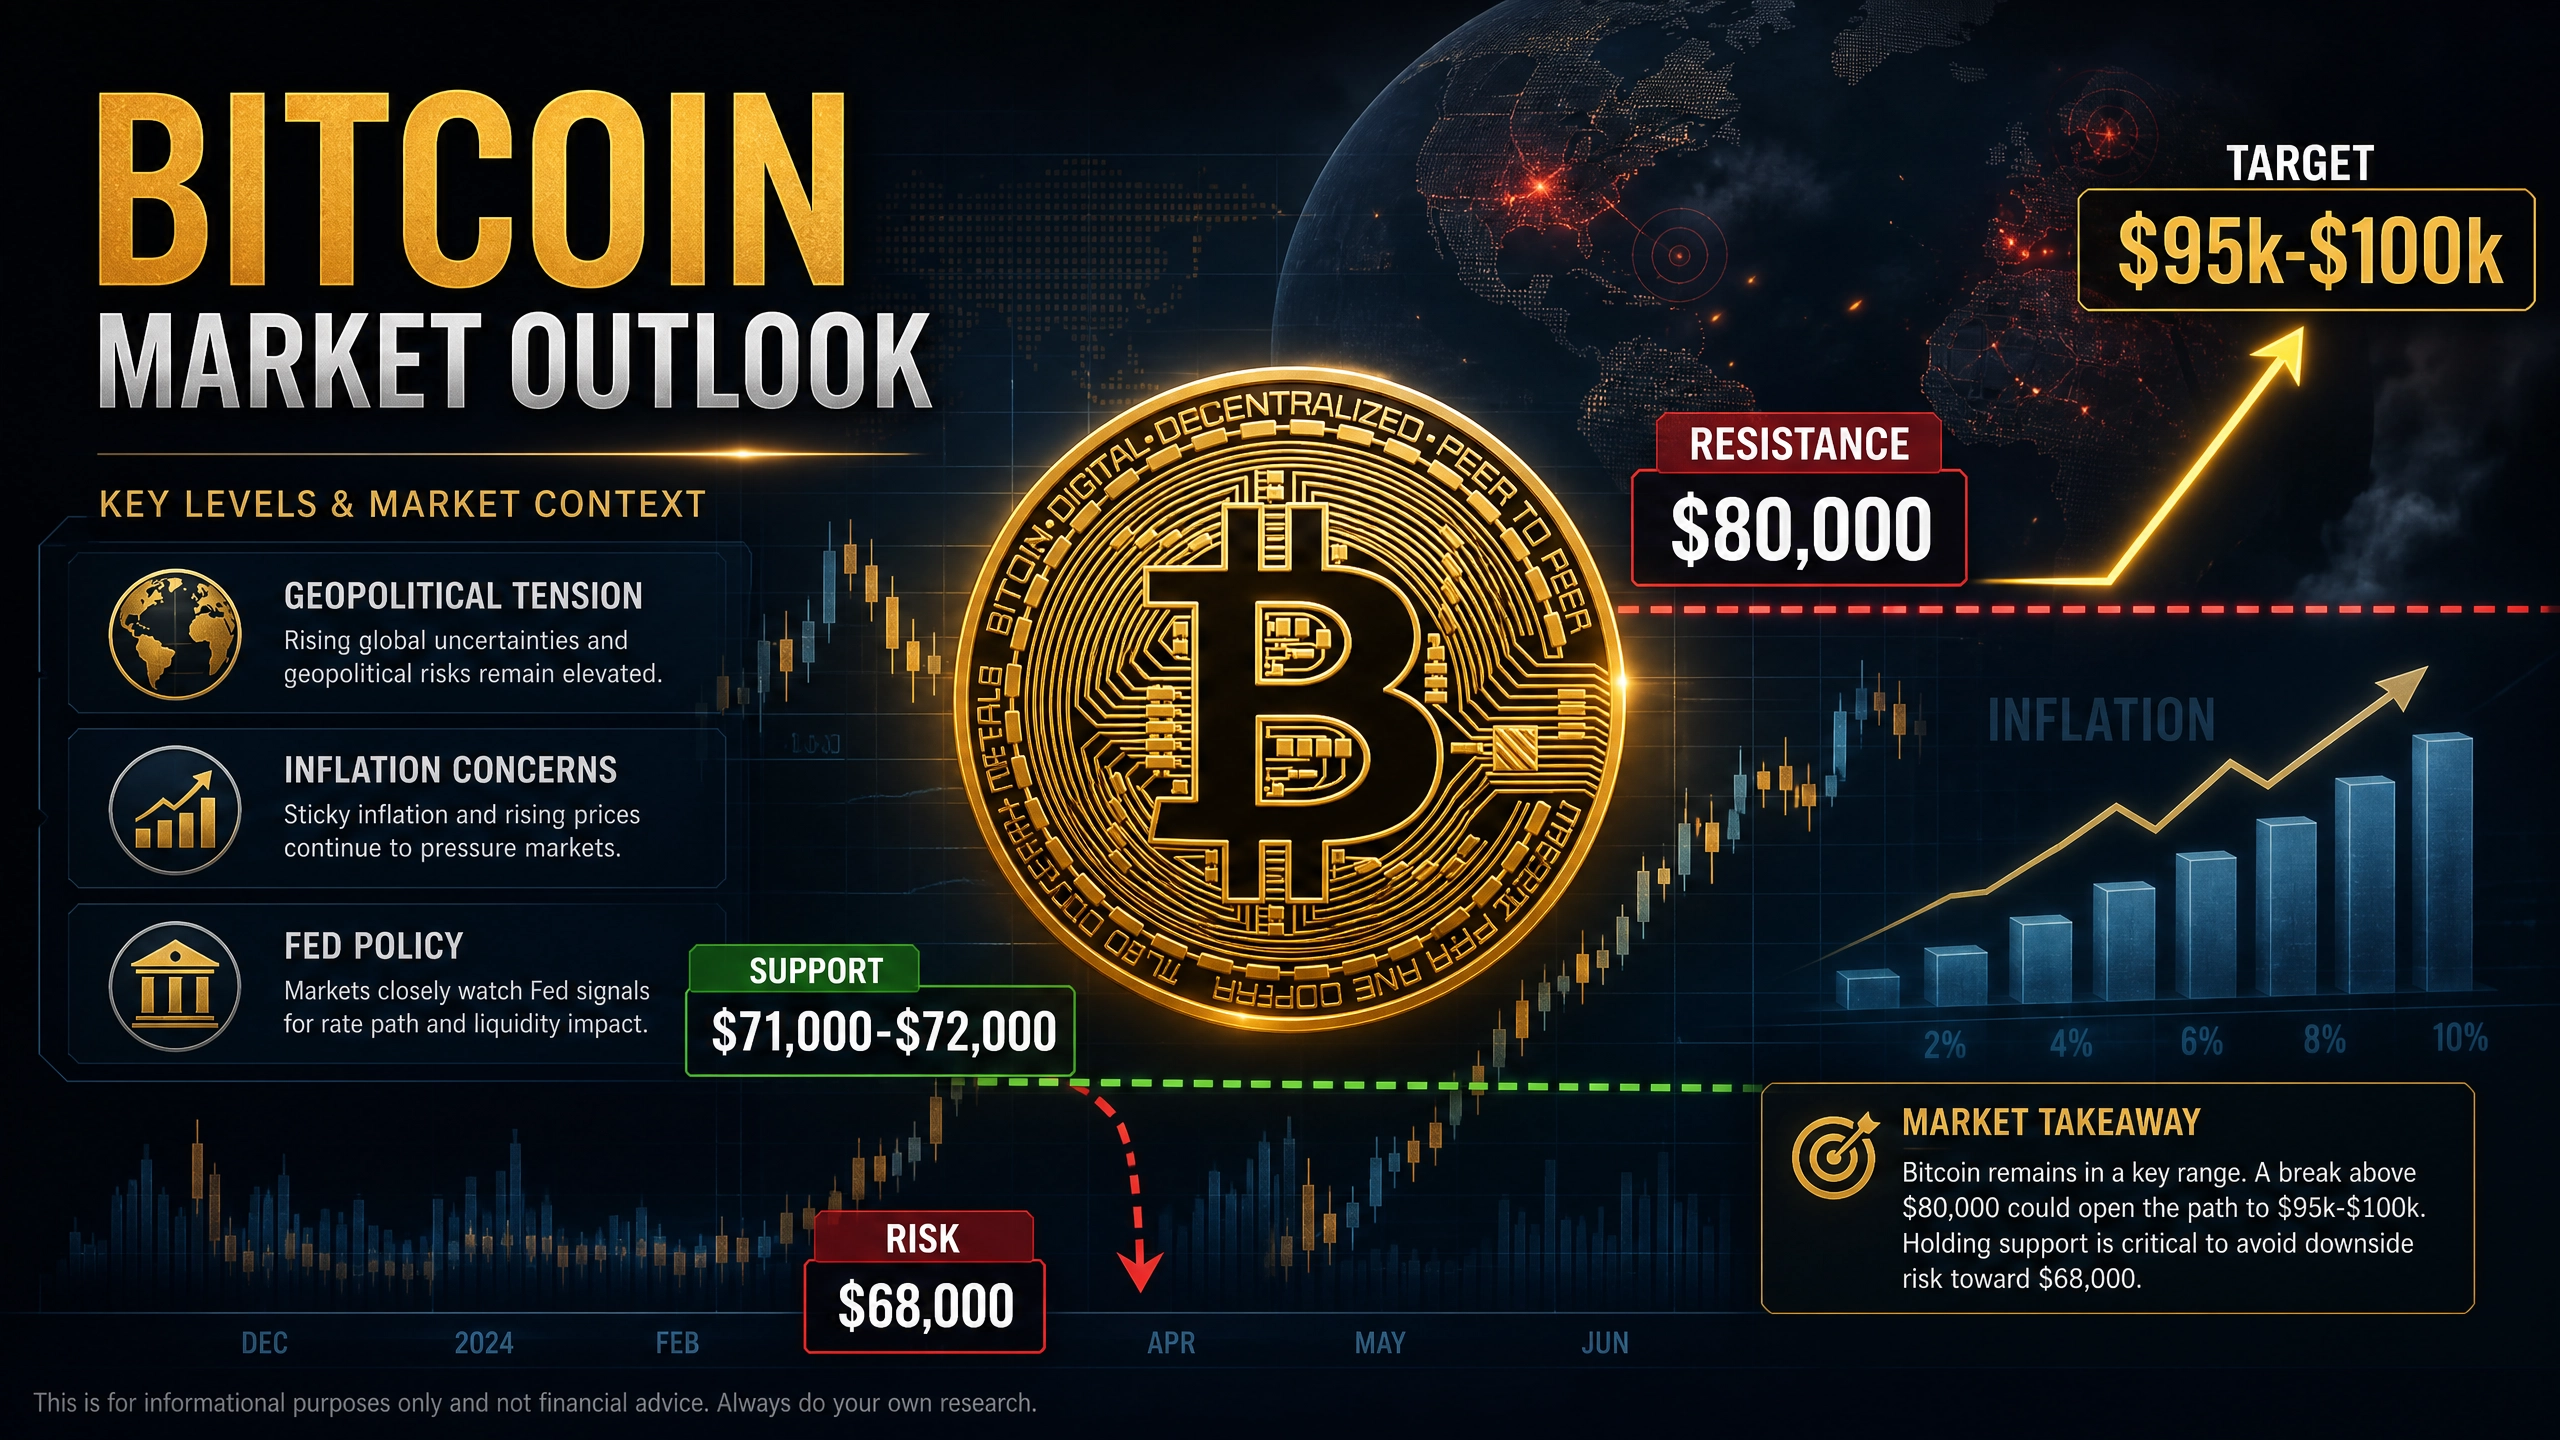
The biggest reason behind Bitcoin’s decline is rising geopolitical tension between the United States and Iran. Reports of military escalation, sanctions pressure, and retaliatory strikes triggered panic across global markets. Investors quickly moved away from risky assets including cryptocurrencies
Another major reason was Bitcoin’s rejection near the 200-day moving average around $83,000. Multiple failed breakout attempts weakened bullish momentum heavily. Once BTC lost the key $75,000 support level, stop-losses triggered aggressively and liquidation pressure accelerated the crash toward $73,000.
Macroeconomic uncertainty also continues damaging sentiment. Concerns regarding inflation, Federal Reserve policy, and high oil prices are reducing appetite for speculative assets like Bitcoin
Technical Analysis: The Critical 73K Support Battle
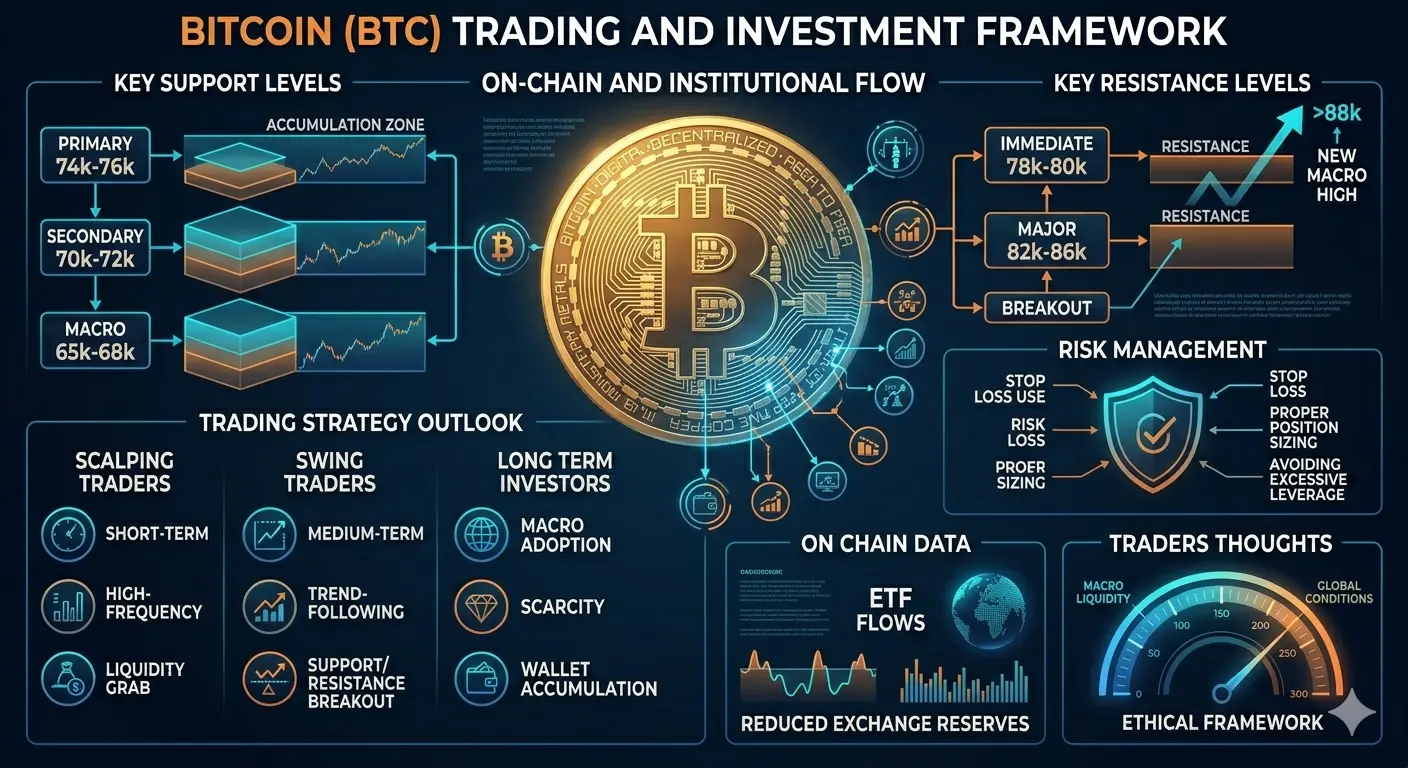
Bitcoin is now testing one of the most important support zones of 2026 near the 100-day SMA around $73,000. This area has become the main battlefield between bulls and bears.
If BTC successfully reclaims this level with strong buying volume, the next upside targets become $80,000 and then $83,000 to $84,000. However, failure to recover above the 100-day SMA may confirm a dangerous triple-top pattern targeting approximately $59,000.
Momentum indicators including RSI and MACD still show bearish divergence across several timeframes, meaning sellers currently maintain control of short-term momentum
What Traders Are Thinking Right Now
Short-term trader sentiment remains mostly bearish. Many active traders expect BTC to test $72,700 first and then potentially $70,600 or even $68,000 if weakness continues. Rebounds toward $74,000 to $75,000 are currently viewed as short-selling opportunities rather than bullish reversals
However, some analysts still believe Bitcoin is sitting inside a strong weekly support zone where institutional buyers may accumulate aggressively. Long-term sentiment remains positive because ETF inflows, institutional adoption, and post-halving cycle expectations continue supporting the broader bullish thesis.
Prediction markets currently assign only a small probability of Bitcoin reaching $100,000 next month, but year-end expectations remain much stronger
Forecast Price: Where Could BTC Go Next
Institutional forecasts for Bitcoin in 2026 vary widely. Standard Chartered targets approximately $150,000 while CoinShares projects $120,000 to $170,000. Maple Finance expects around $175,000 and several aggressive forecasts extend toward $200,000 or even $225,000 under highly bullish conditions.
At the same time, bearish scenarios still suggest possible downside toward $59,000 if geopolitical tensions worsen and technical breakdowns continue
Most institutional forecasts cluster between $120,000 and $175,000, suggesting long-term upside potential remains significant despite current weakness.
Bullish Scenario
In the bullish scenario, geopolitical tensions ease and risk appetite returns to financial markets. Bitcoin could quickly reclaim $75,000 and push toward $80,000 to $84,000. A breakout above the 200-day moving average near $83,000 would strengthen momentum dramatically and reopen the path toward $100,000.
ETF inflows remain one of the strongest bullish catalysts because institutional investors continue accumulating exposure through regulated products. If Federal Reserve policy becomes more accommodative later in 2026, liquidity conditions could improve sharply for crypto markets.
Under favorable conditions, Bitcoin reaching $120,000 to $175,000 by late 2026 or early 2027 remains possible.
Bearish Scenario
If geopolitical conflict escalates further, Bitcoin may face another major selloff. A breakdown below $71,000 could quickly expose $69,000 and $68,000 support levels. Confirmation of the triple-top pattern could open downside targets near $59,000.
Additional risks include inflation pressure, tighter Federal Reserve policy, regulatory crackdowns, or another major crypto industry crisis. In the worst-case scenario, Bitcoin could revisit the $50,000 region if several negative catalysts combine together.
Trading Strategy and Plan Tips
Current market conditions require disciplined trading and strong risk management. Bullish traders should wait for confirmation before entering large positions. Recovery above $75,000 with strong volume would improve the bullish outlook significantly.
Potential long entries may exist around $72,700 to $73,200 with targets at $75,000, $80,000, and eventually $83,500. Bearish traders continue favoring shorts near $74,000 to $75,000 with downside targets at $71,000 and $70,600.
Leverage should remain limited because volatility is extremely high. Keeping 30 to 40 percent of capital in stablecoins or cash provides flexibility during rapid market swings.
Bitcoin near $73,000 represents a major turning point for the market. Short-term conditions remain bearish due to geopolitical tension, macroeconomic uncertainty, and technical weakness. However, long-term fundamentals including institutional adoption, ETF demand, and post-halving cycle dynamics still support the broader bullish outlook.
The next few weeks will likely remain highly volatile, but these lower price levels may eventually become the foundation for the next major Bitcoin rally. Traders should stay disciplined, manage risk carefully, and monitor both geopolitical headlines and key technical levels closely..@Gate_Square @Gate广场_Official
Bitcoin is currently trading around $72,900 to $75,800 depending on the exchange and timing of the market snapshot. On May 28, 2026, BTC traded close to $72,899 after falling nearly 3.6 percent within 24 hours. The overall crypto market capitalization dropped toward $2.53 trillion while Ethereum declined to nearly $1,975.59 with a 4.8 percent loss. Just two days earlier Bitcoin was trading near $77,274 before slipping toward $75,824 and then collapsing into the $73,000 zone. CME Bitcoin futures for May 2026 traded near $77,710 while June contracts hovered around $77,985, showing futures traders still expect recovery later. Prediction markets suggested BTC could stabilize around $75,000 by the end of May 29 trading
Why BTC Came Down to the 73K Level
The biggest reason behind Bitcoin’s decline is rising geopolitical tension between the United States and Iran. Reports of military escalation, sanctions pressure, and retaliatory strikes triggered panic across global markets. Investors quickly moved away from risky assets including cryptocurrencies
Another major reason was Bitcoin’s rejection near the 200-day moving average around $83,000. Multiple failed breakout attempts weakened bullish momentum heavily. Once BTC lost the key $75,000 support level, stop-losses triggered aggressively and liquidation pressure accelerated the crash toward $73,000.
Macroeconomic uncertainty also continues damaging sentiment. Concerns regarding inflation, Federal Reserve policy, and high oil prices are reducing appetite for speculative assets like Bitcoin
Technical Analysis: The Critical 73K Support Battle
Bitcoin is now testing one of the most important support zones of 2026 near the 100-day SMA around $73,000. This area has become the main battlefield between bulls and bears.
If BTC successfully reclaims this level with strong buying volume, the next upside targets become $80,000 and then $83,000 to $84,000. However, failure to recover above the 100-day SMA may confirm a dangerous triple-top pattern targeting approximately $59,000.
Momentum indicators including RSI and MACD still show bearish divergence across several timeframes, meaning sellers currently maintain control of short-term momentum
What Traders Are Thinking Right Now
Short-term trader sentiment remains mostly bearish. Many active traders expect BTC to test $72,700 first and then potentially $70,600 or even $68,000 if weakness continues. Rebounds toward $74,000 to $75,000 are currently viewed as short-selling opportunities rather than bullish reversals
However, some analysts still believe Bitcoin is sitting inside a strong weekly support zone where institutional buyers may accumulate aggressively. Long-term sentiment remains positive because ETF inflows, institutional adoption, and post-halving cycle expectations continue supporting the broader bullish thesis.
Prediction markets currently assign only a small probability of Bitcoin reaching $100,000 next month, but year-end expectations remain much stronger
Forecast Price: Where Could BTC Go Next
Institutional forecasts for Bitcoin in 2026 vary widely. Standard Chartered targets approximately $150,000 while CoinShares projects $120,000 to $170,000. Maple Finance expects around $175,000 and several aggressive forecasts extend toward $200,000 or even $225,000 under highly bullish conditions.
At the same time, bearish scenarios still suggest possible downside toward $59,000 if geopolitical tensions worsen and technical breakdowns continue
Most institutional forecasts cluster between $120,000 and $175,000, suggesting long-term upside potential remains significant despite current weakness.
Bullish Scenario
In the bullish scenario, geopolitical tensions ease and risk appetite returns to financial markets. Bitcoin could quickly reclaim $75,000 and push toward $80,000 to $84,000. A breakout above the 200-day moving average near $83,000 would strengthen momentum dramatically and reopen the path toward $100,000.
ETF inflows remain one of the strongest bullish catalysts because institutional investors continue accumulating exposure through regulated products. If Federal Reserve policy becomes more accommodative later in 2026, liquidity conditions could improve sharply for crypto markets.
Under favorable conditions, Bitcoin reaching $120,000 to $175,000 by late 2026 or early 2027 remains possible.
Bearish Scenario
If geopolitical conflict escalates further, Bitcoin may face another major selloff. A breakdown below $71,000 could quickly expose $69,000 and $68,000 support levels. Confirmation of the triple-top pattern could open downside targets near $59,000.
Additional risks include inflation pressure, tighter Federal Reserve policy, regulatory crackdowns, or another major crypto industry crisis. In the worst-case scenario, Bitcoin could revisit the $50,000 region if several negative catalysts combine together.
Trading Strategy and Plan Tips
Current market conditions require disciplined trading and strong risk management. Bullish traders should wait for confirmation before entering large positions. Recovery above $75,000 with strong volume would improve the bullish outlook significantly.
Potential long entries may exist around $72,700 to $73,200 with targets at $75,000, $80,000, and eventually $83,500. Bearish traders continue favoring shorts near $74,000 to $75,000 with downside targets at $71,000 and $70,600.
Leverage should remain limited because volatility is extremely high. Keeping 30 to 40 percent of capital in stablecoins or cash provides flexibility during rapid market swings.
Bitcoin near $73,000 represents a major turning point for the market. Short-term conditions remain bearish due to geopolitical tension, macroeconomic uncertainty, and technical weakness. However, long-term fundamentals including institutional adoption, ETF demand, and post-halving cycle dynamics still support the broader bullish outlook.
The next few weeks will likely remain highly volatile, but these lower price levels may eventually become the foundation for the next major Bitcoin rally. Traders should stay disciplined, manage risk carefully, and monitor both geopolitical headlines and key technical levels closely..@Gate_Square @Gate广场_Official