Trade
Basic
Futures
Futures
Hundreds of contracts settled in USDT or BTC
TradFi
Gold
Trade global traditional assets with USDT in one place
Options
Hot
Trade European-style vanilla options
Unified Account
Maximize your capital efficiency
Demo Trading
Futures Kickoff
Get prepared for your futures trading
Futures Events
Participate in events to win generous rewards
Demo Trading
Use virtual funds to experience risk-free trading
Earn
Launch
CandyDrop
Collect candies to earn airdrops
Launchpool
Quick staking, earn potential new tokens
HODLer Airdrop
Hold GT and get massive airdrops for free
Launchpad
Be early to the next big token project
Alpha Points
Trade on-chain assets and enjoy airdrop rewards!
Futures Points
Earn futures points and claim airdrop rewards
Investment
Simple Earn
Earn interests with idle tokens
Auto-Invest
Auto-invest on a regular basis
Dual Investment
Buy low and sell high to take profits from price fluctuations
Soft Staking
Earn rewards with flexible staking
Crypto Loan
0 Fees
Pledge one crypto to borrow another
Lending Center
One-stop lending hub
VIP Wealth Hub
Customized wealth management empowers your assets growth
Private Wealth Management
Customized asset management to grow your digital assets
Quant Fund
Top asset management team helps you profit without hassle
Staking
Stake cryptos to earn in PoS products
Smart Leverage
New
No forced liquidation before maturity, worry-free leveraged gains
GUSD Minting
Use USDT/USDC to mint GUSD for treasury-level yields
More
Ahamadsorif
Ethereum Foundation releases a seven-year roadmap: 7 forks by the
595
- Reward
- like
- Comment
- Repost
- Share
The most consequential decision a serious participant makes in this space is not which asset to hold or when to enter a position.
It is whether to contribute to the collective intelligence of the community around them — or to extract from it.
Extractors are everywhere. They read the analysis, absorb the frameworks, benefit from the conversations, and disappear without leaving anything behind. They are not malicious. They simply haven't yet understood that the community is not a resource to consume — it is an ecosystem to cultivate. And ecosystems only remain valuable when the people benefiting

- Reward
- 5
- 7
- Repost
- Share
ybaser :
:
To The Moon 🌕View More
Anna
Anna Ergard
Created By@gatefunuser_80dd
Listing Progress
0.81%
MC:
$2.69K
More Tokens
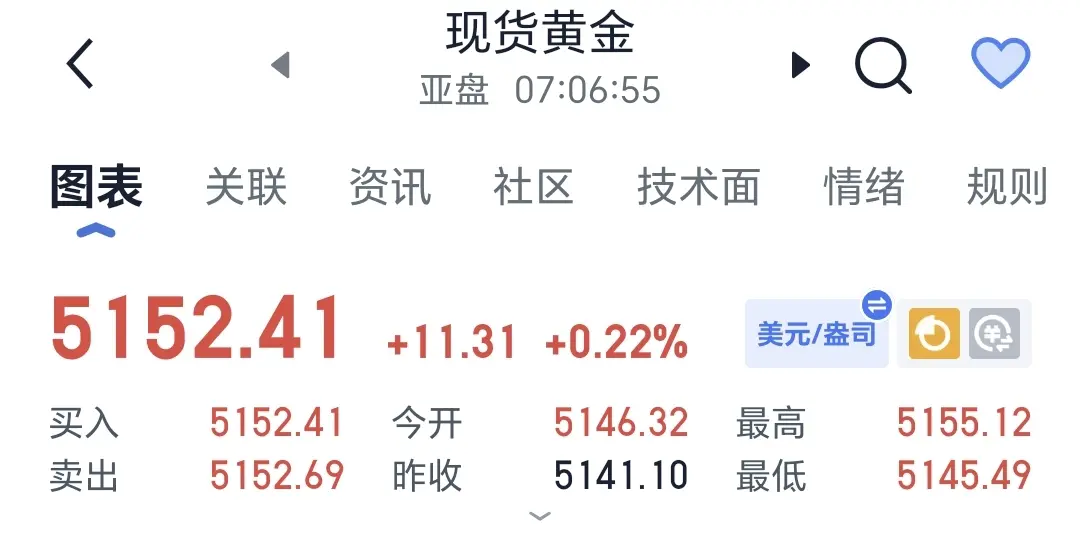
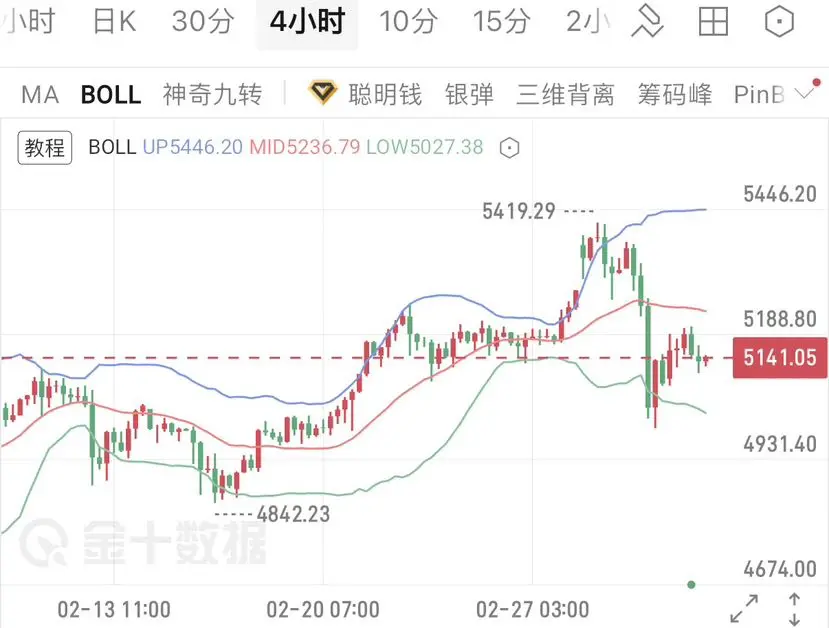
Recently, gold surged to around 5419 before starting to pull back, then plummeted on Tuesday, with a low of 4997. This pattern is consistent with previous declines last year, which showed a technical pattern of falling near the middle Bollinger Band on the daily chart, followed by repeated tests and trend reversal leading to an upward move. Currently, the close is at 5141, with the rebound nearly retracing half of the decline. It is basically confirmed that this round of adjustment is complete, and a cyclical upward trend has begun.
The daily chart has already closed positively, indicating a s
View OriginalThe daily chart has already closed positively, indicating a s
- Reward
- like
- Comment
- Repost
- Share
📊 Why is Gold currently in the $5,100–$5,200 range?
── Explaining with data why it hasn't moved despite the war
On Monday, March 3rd, the US and Israel attacked Iran.
Gold prices instantly surged to $5,419.
But the next day, Gold plummeted by −5%.
Now it’s forming a range around $5,151.
“Why does it fall despite being a war?”
The answer is all in three data points.
━━━━━━━━━━━━━━━
⬤ Force ① Real Interest Rate +1.76% (rising)
━━━━━━━━━━━━━━━
Gold is an asset that doesn’t generate interest.
As real interest rates rise, the “opportunity cost” of holding Gold increases.
In the empirical study by
View Original
- Reward
- like
- Comment
- Repost
- Share
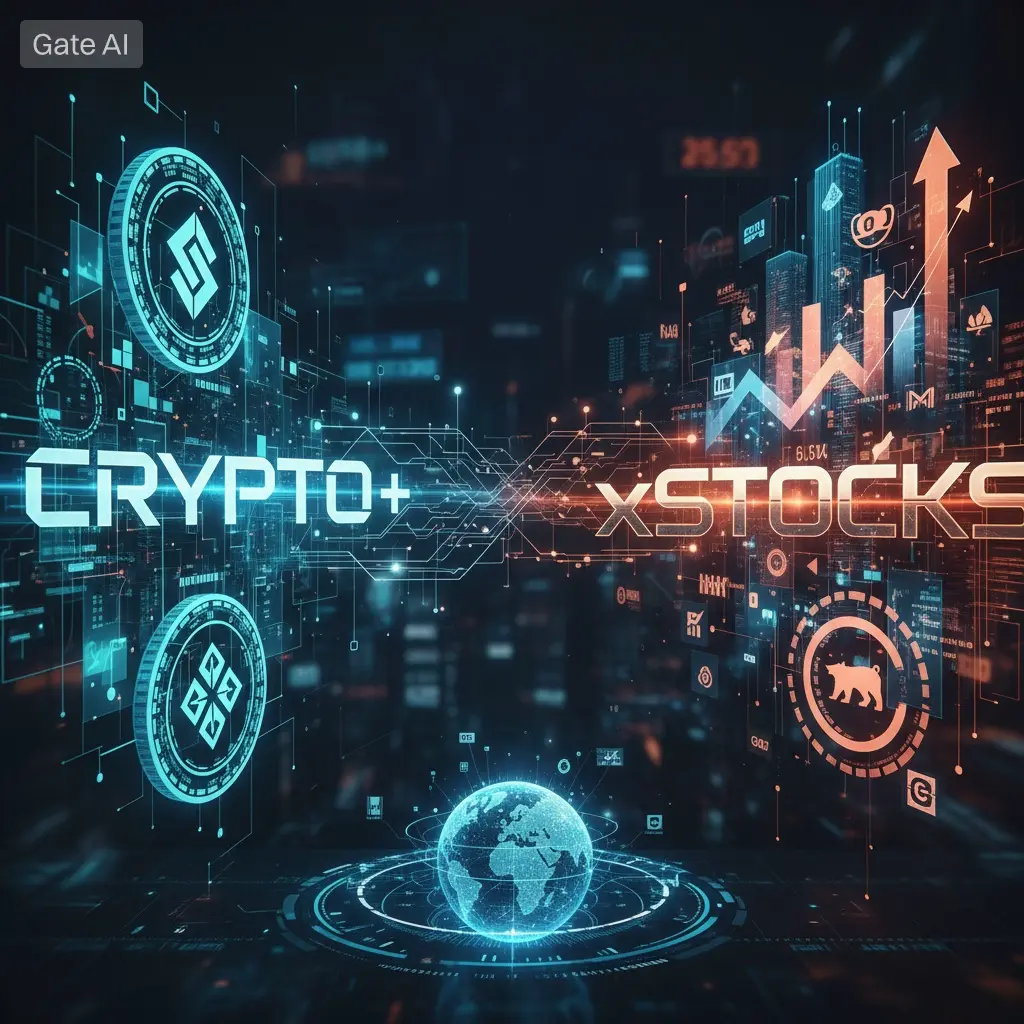
Understanding Risk in a Mixed Portfolio: Crypto + xStocks on TON
Combining crypto native assets with tokenized traditional exposure on the TON Blockchain creates new opportunities but also multiple layers of risk. Using platforms like STONfi, users can hold both asset types in one self custodial wallet. That convenience makes risk structure even more important.
Here are the main risk categories to understand:
1️⃣ Market Risk
Crypto assets can experience extreme volatility, with drawdowns of 50–80% not uncommon. Tokenized stocks (xStocks) available through STONfi are generally less explosive, b
- Reward
- like
- Comment
- Repost
- Share
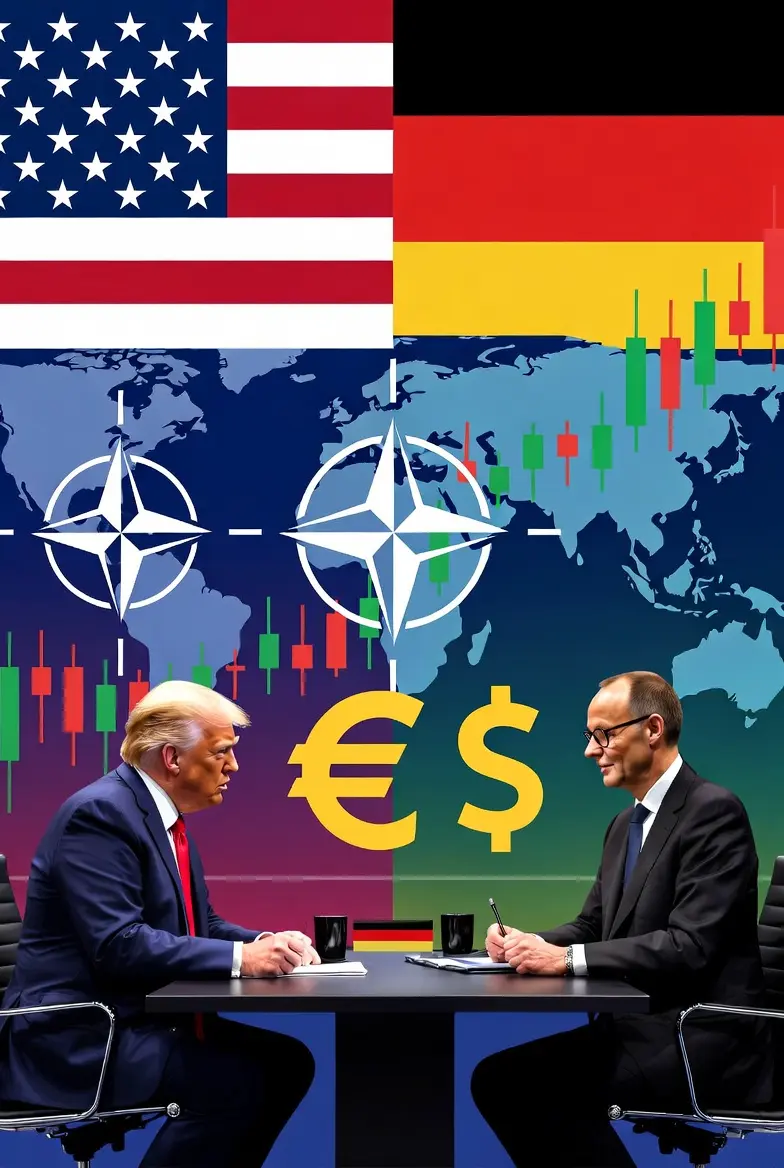
#TrumpMeetsMerz
The meeting between Donald Trump and Friedrich Merz has drawn attention across political and financial circles, reflecting the continued importance of transatlantic relationships in shaping global economic and strategic policy. High-level discussions between influential figures often signal potential shifts in tone, alignment, or future cooperation between the United States and Germany.
Such engagements carry weight beyond symbolism. The United States and Germany represent two of the largest economies in the Western alliance, and their political alignment can influence trade p
- Reward
- like
- Comment
- Repost
- Share
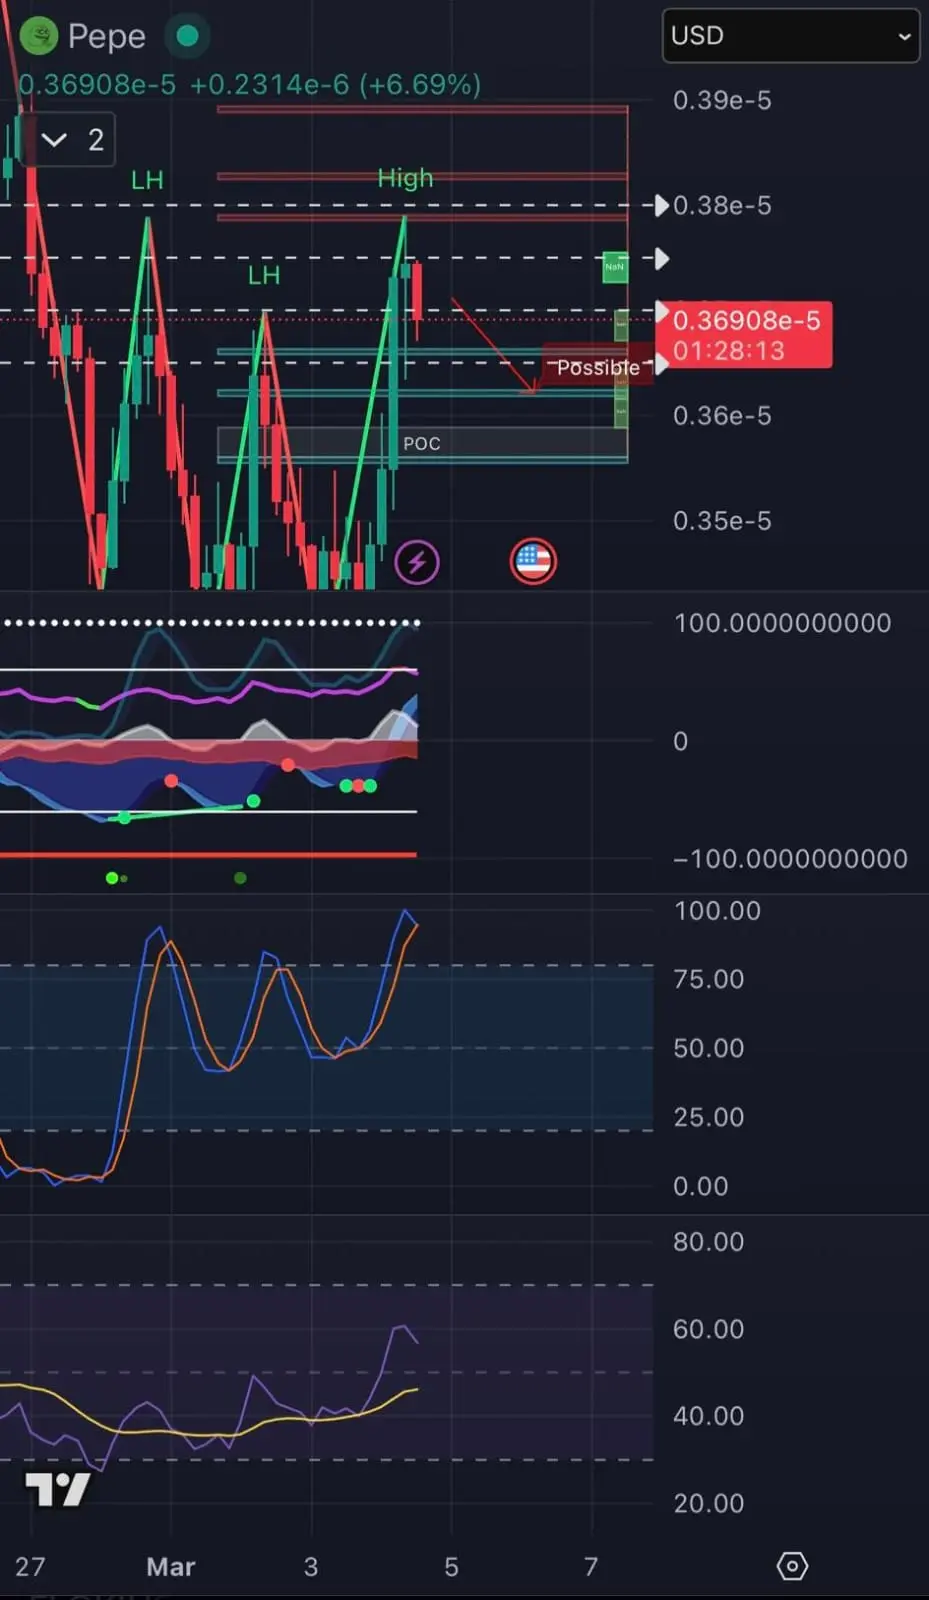
$PEPE update:
Great day today for crypto and Pepe.
We could have a small pullback after the nice run today. 4 hour is showing possible targets around .000003500 and again there is no guarantee, we could just go right to .00000400
But we are over bought and need to cool off some.
Money flow started to thin out and volume rising with open interest.
Don’t fade the frog!!!!
PEPE5,51%
- Reward
- 1
- Comment
- Repost
- Share
Gate TradFi Asset Points Carnival Week
March 5, 08:00 – March 11, 08:00 (UTC+8)
Double Trading Points for TradFi Assets
Conversion factor increased from 0.2 to 0.4 during the event
Double points bonus for the same trading volume
📄 Event Announcement: https://www.gate.com/announcements/article/50059
🚀 Join Now: https://www.gate.com/futures/points
View OriginalMarch 5, 08:00 – March 11, 08:00 (UTC+8)
Double Trading Points for TradFi Assets
Conversion factor increased from 0.2 to 0.4 during the event
Double points bonus for the same trading volume
📄 Event Announcement: https://www.gate.com/announcements/article/50059
🚀 Join Now: https://www.gate.com/futures/points

- Reward
- like
- Comment
- Repost
- Share
Donald Trump has surprisingly announced Kevin Warsh as his nominee for Chairman of the Federal Reserve (Fed). This move is reshaping expectations for the Fed's future monetary policy, given Warsh's "hawkish" stance on traditional financial markets and his positive approach to Bitcoin. If confirmed by the Senate, a Fed under Kevin Warsh's leadership could set a precedent: while simultaneously trying to maintain the traditional strength of the dollar through tight monetary policy, it could open the door to Bitcoin and digital assets, a technology born as an alternative to that strength.
Trump's
Trump's
BTC6,31%
- Reward
- 16
- 10
- Repost
- Share
boş_adam1:
To The Moon 🌕View More
Bard, what's wrong? Such a deep ditch.
View Original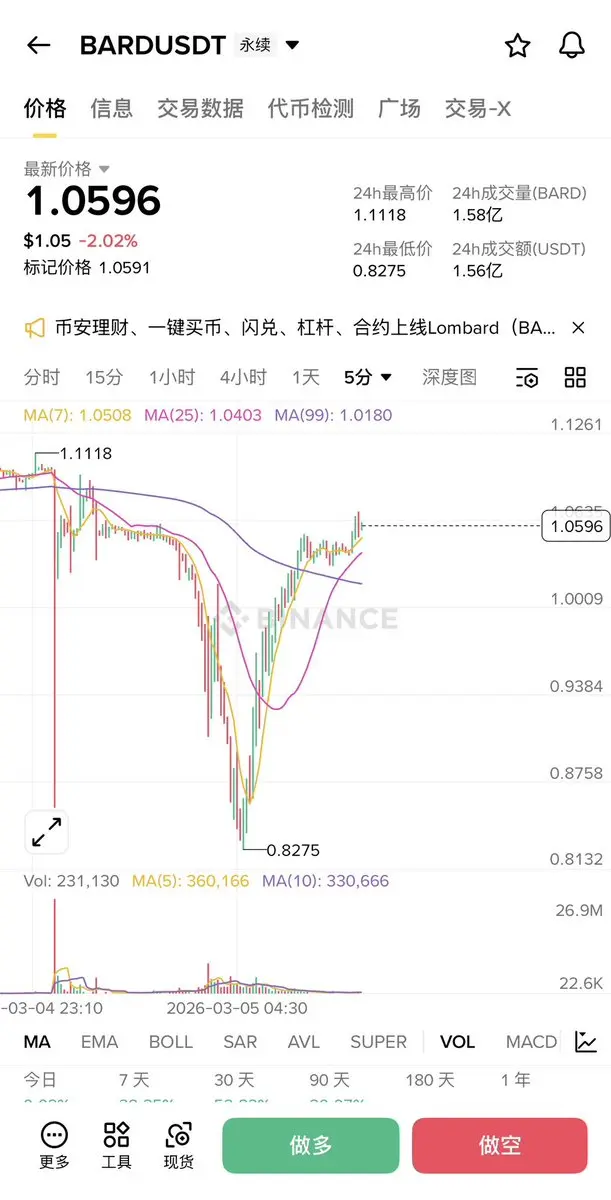
- Reward
- like
- Comment
- Repost
- Share
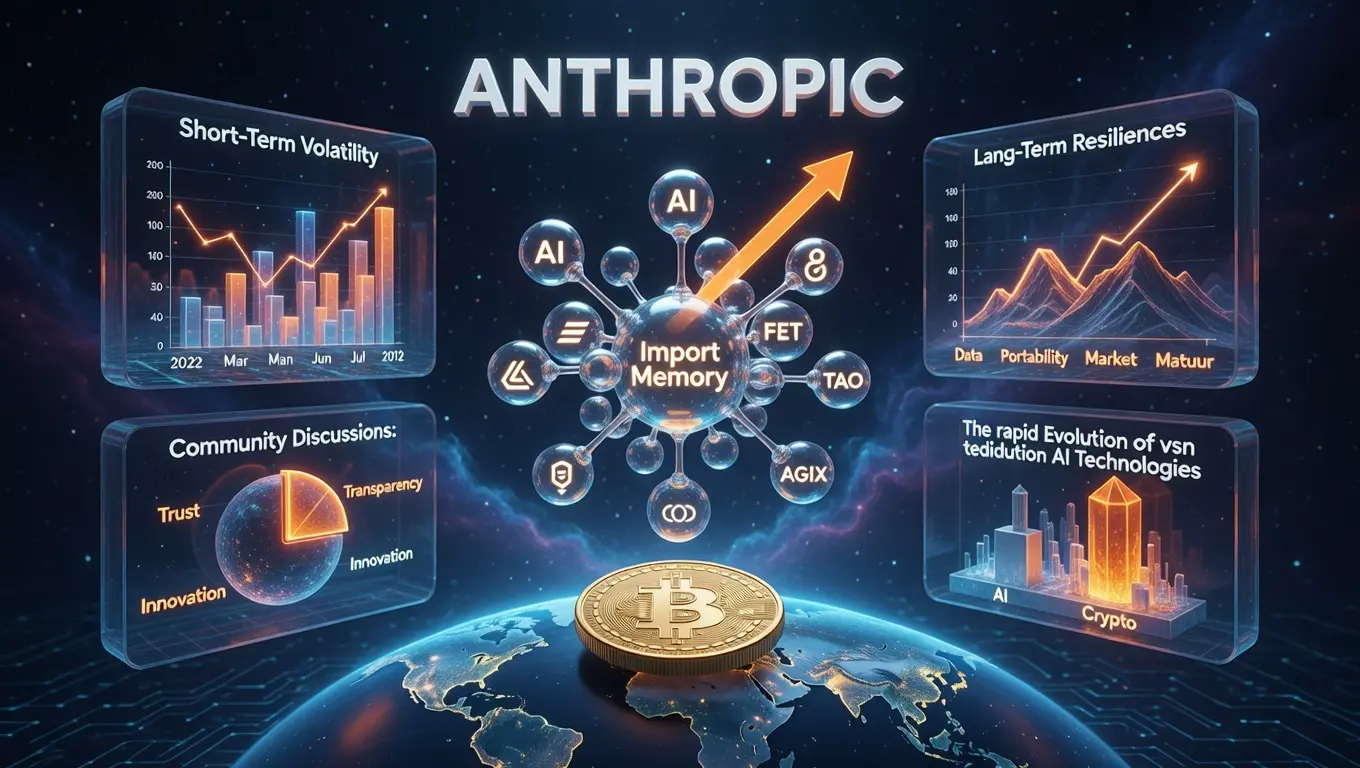
#AnthropicTopsAIProductRankings
Anthropic's Rise to the Top of AI Product Rankings and Its Impact on Crypto Markets
Recent developments in the artificial intelligence sector continue to profoundly influence the digital asset ecosystem. Anthropic's Claude model has ascended to the pinnacle of global AI product rankings, capturing significant attention. This achievement, bolstered by innovative features, is laying the groundwork for valuation gains in AI-focused cryptocurrencies. Seasoned market observers note that such advancements may trigger short-term fluctuations, yet they often enhance th
BTC6,31%
- Reward
- like
- Comment
- Repost
- Share
zy
zy
Created By@GateUser-2432a2dc
Listing Progress
0.00%
MC:
$2.48K
More Tokens
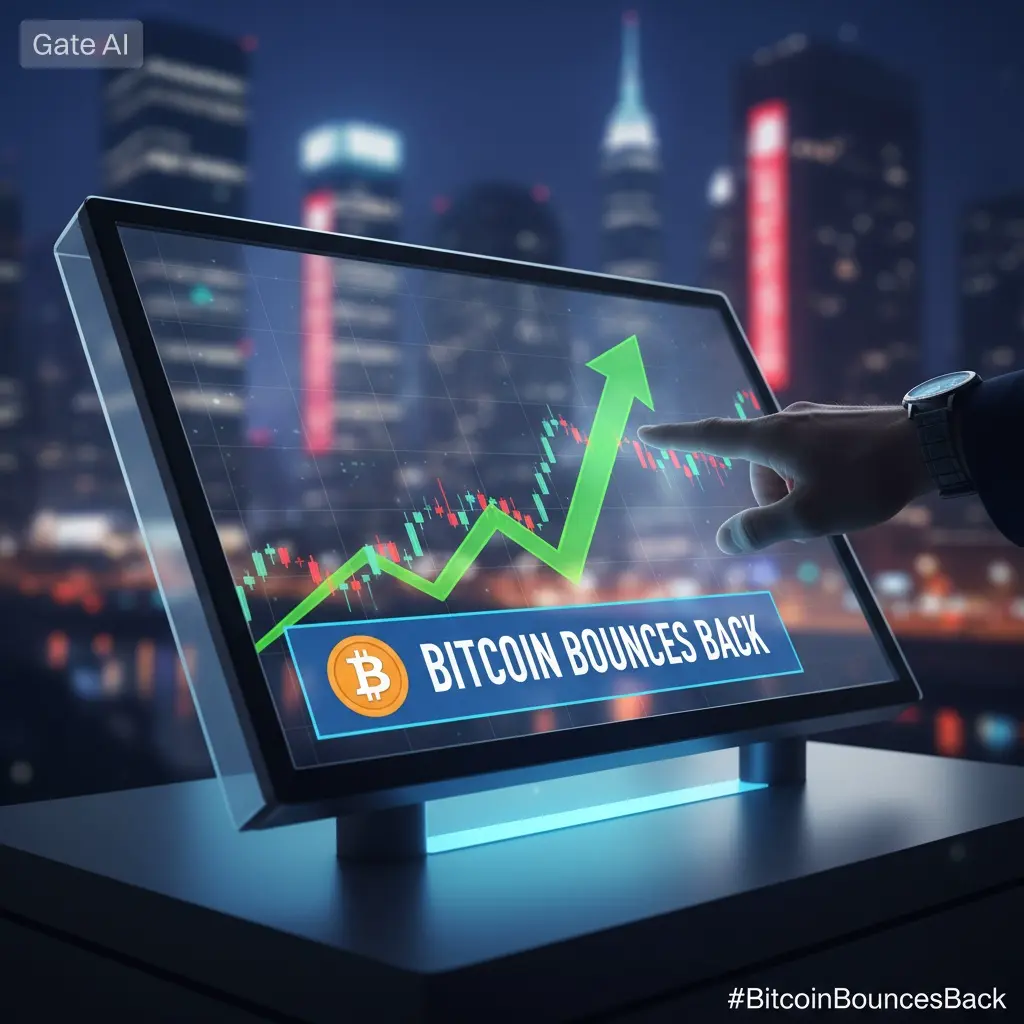
#BitcoinBouncesBack Bitcoin Reclaims Momentum as ETF Inflows Rise, Miner Selling Slows, and Global Liquidity Trends Turn Supportive
Bitcoin has extended its recovery in recent sessions, signaling a structural shift in market dynamics rather than a simple short-term bounce. After absorbing weeks of distribution and macro-driven uncertainty, the flagship cryptocurrency is now trading with renewed strength as multiple data points align in favor of bullish continuation. The latest advance reflects improving liquidity conditions, stabilizing miner behavior, and a resurgence in institutional demand
Bitcoin has extended its recovery in recent sessions, signaling a structural shift in market dynamics rather than a simple short-term bounce. After absorbing weeks of distribution and macro-driven uncertainty, the flagship cryptocurrency is now trading with renewed strength as multiple data points align in favor of bullish continuation. The latest advance reflects improving liquidity conditions, stabilizing miner behavior, and a resurgence in institutional demand
BTC6,31%
- Reward
- 1
- 7
- Repost
- Share
Abrarbrohi:
2026 GOGOGO 👊View More


- Reward
- 1
- 1
- Repost
- Share
PlayingContractsAgain,IAmJust :
:
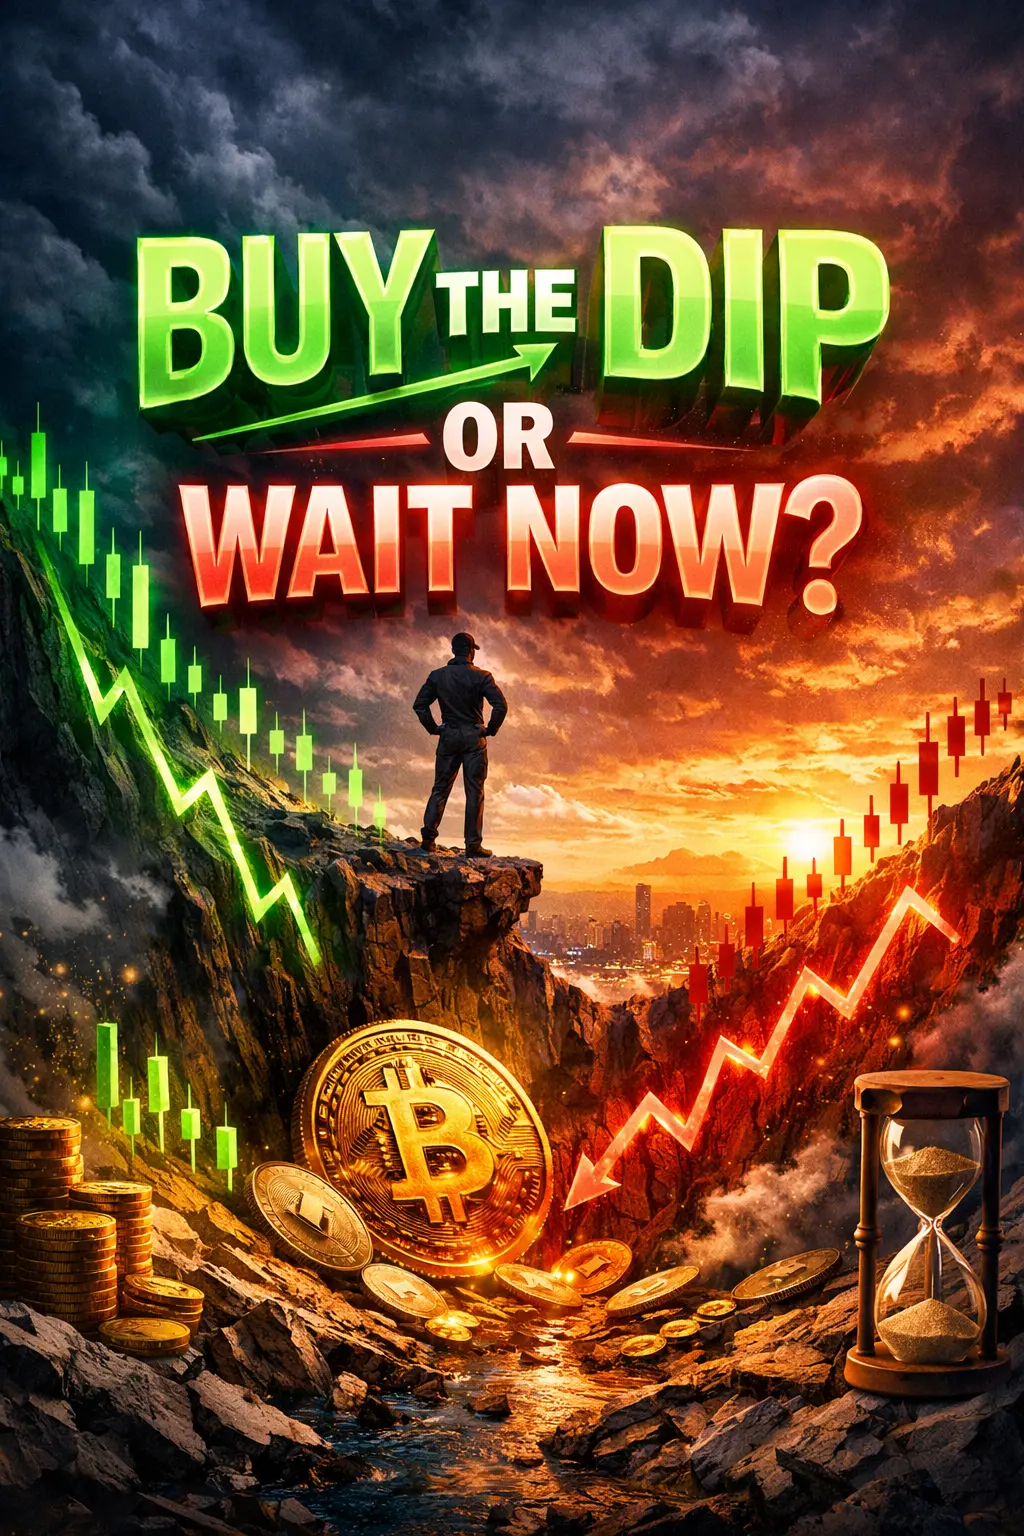
Let's have the next bull market. Wait until it reaches 1000, then rise to 5000—wouldn't that be several times more?#BuyTheDipOrWaitNow? #BuyTheDipOrWaitNow?
The market pulls back and immediately the debate begins. Is this a healthy correction inside a larger uptrend, or the early stage of a deeper reversal. The difference between buying the dip and catching a falling knife is rarely emotional and almost always structural.
First, zoom out. If the broader trend remains intact with higher highs and higher lows on higher time frames, dips often represent liquidity events rather than structural breakdowns. In strong macro environments, corrections reset funding rates, shake out leverage, and create more sustain
- Reward
- 1
- 1
- Repost
- Share
ybaser:
To The Moon 🌕
- Reward
- like
- Comment
- Repost
- Share
#BitcoinBouncesBack
This is the moment when BTC rises.
But I feel this is just a trick..
I'm sure it will drop sharply back down..$BTC
This is the moment when BTC rises.
But I feel this is just a trick..
I'm sure it will drop sharply back down..$BTC
BTC6,31%

- Reward
- like
- Comment
- Repost
- Share
Yichen: Pullback to Gather Strength, Bullish Reversal Window Opens
After a deep correction yesterday, a strong rebound was seen, demonstrating the resilience of the bulls. The four-hour gold price has stabilized and rebounded from the lower support level. The MACD green bars are narrowing, indicating weakening bearish momentum, and the short-term rebound has the potential to continue.
From a fundamental perspective, ongoing global geopolitical conflicts continue to intensify safe-haven demand. Coupled with persistent gold purchases by central banks around the world, this provides a solid botto
View Original
- Reward
- like
- Comment
- Repost
- Share
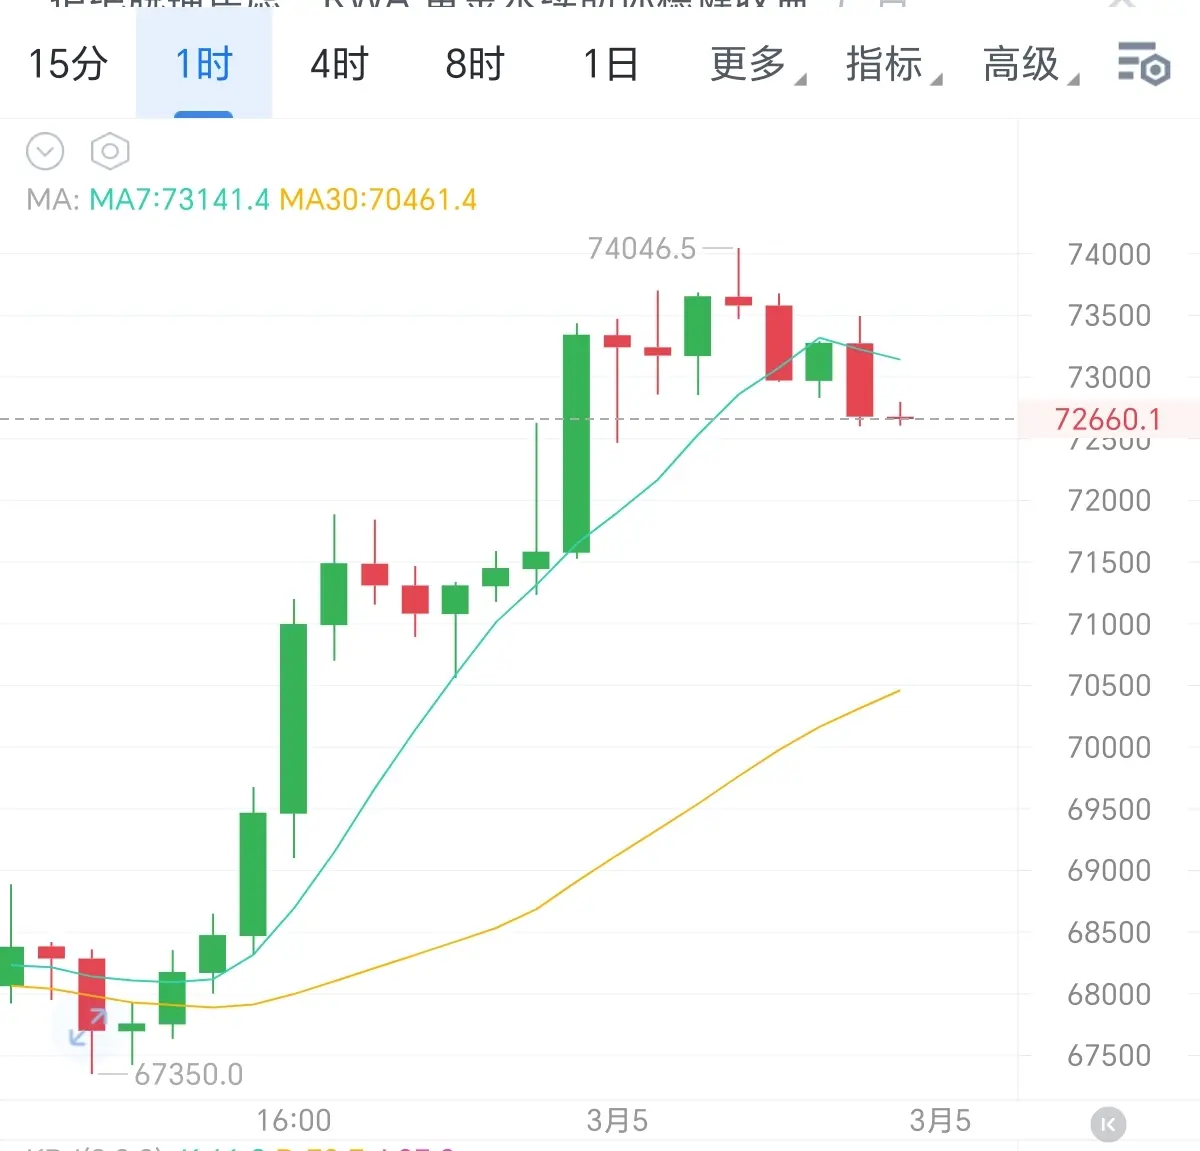
3.5 Bitcoin Morning Analysis:
Bitcoin surged to 74046.5 in the early hours and then pulled back, breaking below the MA7 short-term moving average. The bullish momentum has weakened, and the 74000 resistance remains strong. The Fed's rate cut expectations have cooled, and the strong dollar is suppressing the market; the March token unlock has caused selling pressure, which has already been priced in. The short-term gains exceed 8%, and profit-taking has occurred. Coupled with increased risk aversion due to geopolitical conflicts, funds are flowing out of risk assets. The market continues to ret
Bitcoin surged to 74046.5 in the early hours and then pulled back, breaking below the MA7 short-term moving average. The bullish momentum has weakened, and the 74000 resistance remains strong. The Fed's rate cut expectations have cooled, and the strong dollar is suppressing the market; the March token unlock has caused selling pressure, which has already been priced in. The short-term gains exceed 8%, and profit-taking has occurred. Coupled with increased risk aversion due to geopolitical conflicts, funds are flowing out of risk assets. The market continues to ret
BTC6,31%
- Reward
- like
- Comment
- Repost
- Share
Load More
Join 40M users in our growing community
⚡️ Join 40M users in the crypto craze discussion
💬 Engage with your favorite top creators
👍 See what interests you
Trending Topics
View More310.3K Popularity
130.47K Popularity
191.65K Popularity
19.2K Popularity
416.7K Popularity
News
View MoreFederal Reserve Beige Book: U.S. Economy Expanding Moderately, Inflation and Policy Uncertainty Remain Risks
5 m
Traditional Finance Alert: AVGO Rises Over 4%
10 m
Elon Musk Testifies in Court Over Market Manipulation Lawsuit During Twitter Acquisition
13 m
a16z Crypto is raising $2 billion for its fifth fund
26 m
The world's largest gold ETF holdings decreased significantly by 18 tons in a single day
31 m
Pin