Trade
Basic
Futures
Futures
Hundreds of contracts settled in USDT or BTC
TradFi
Gold
Trade global traditional assets with USDT in one place
Options
Hot
Trade European-style vanilla options
Unified Account
Maximize your capital efficiency
Demo Trading
Futures Kickoff
Get prepared for your futures trading
Futures Events
Participate in events to win generous rewards
Demo Trading
Use virtual funds to experience risk-free trading
Earn
Launch
CandyDrop
Collect candies to earn airdrops
Launchpool
Quick staking, earn potential new tokens
HODLer Airdrop
Hold GT and get massive airdrops for free
Launchpad
Be early to the next big token project
Alpha Points
Trade on-chain assets and enjoy airdrop rewards!
Futures Points
Earn futures points and claim airdrop rewards
Investment
Simple Earn
Earn interests with idle tokens
Auto-Invest
Auto-invest on a regular basis
Dual Investment
Buy low and sell high to take profits from price fluctuations
Soft Staking
Earn rewards with flexible staking
Crypto Loan
0 Fees
Pledge one crypto to borrow another
Lending Center
One-stop lending hub
VIP Wealth Hub
Customized wealth management empowers your assets growth
Private Wealth Management
Customized asset management to grow your digital assets
Quant Fund
Top asset management team helps you profit without hassle
Staking
Stake cryptos to earn in PoS products
Smart Leverage
New
No forced liquidation before maturity, worry-free leveraged gains
GUSD Minting
Use USDT/USDC to mint GUSD for treasury-level yields
More
Zhang Yaoxi: Fundamental factors are chaotic, gold prices remain steady and volatile, still awaiting a rise
Zhang Yaoxi: Fundamentals are Confusing, Gold Prices Remain Stable and Volatile, Still Awaiting a Rise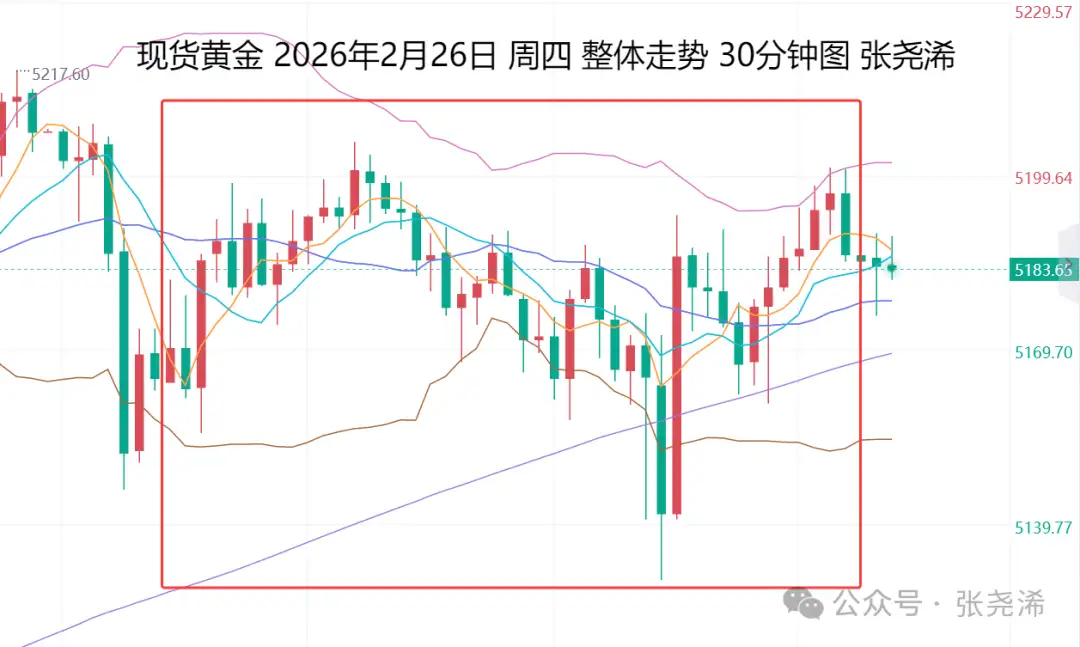
On the last trading day, Thursday (February 26): International gold fluctuated and closed higher, unable to further rebound and break through highs, but also failed to decline further. U.S.-Iran negotiations made “significant” progress, suppressing risk sentiment. However, due to Fed’s Goolsbee stating that interest rates could be lowered, along with supporting buying interest and concerns over tariff chaos, there is still bullish demand. Overall, the trend remains upward, supported by numerous bullish moving averages below, so the direction is still inclined to the upside. Pay attention to the support levels of various moving averages; there are still opportunities for long positions and bullish trades.
Specifically, gold opened at $5160.19 per ounce in the Asian session, initially strengthening. The intraday high was recorded at $5205.33 at 1 PM, then faced resistance and pulled back, continuing to fluctuate lower. At 11 PM during the U.S. session, it fell to the intraday low of $5130.43 but ultimately stopped falling and rebounded, quickly recovering losses and maintaining a relatively strong stance. The close was at $5185.13, with a daily range of $74.9. It closed up $24.94, a 0.48% increase.
Looking ahead to today, Friday (February 27): International gold opened with narrow fluctuations. The short-term direction remains uncertain. The dollar index remains above the midline on the daily chart, showing a strong rebound, which will limit gold bulls. However, it also faces resistance from a downward trendline. The weekly and monthly charts are under bearish pressure. Therefore, short-term pressure on gold is limited and may create bullish entry opportunities.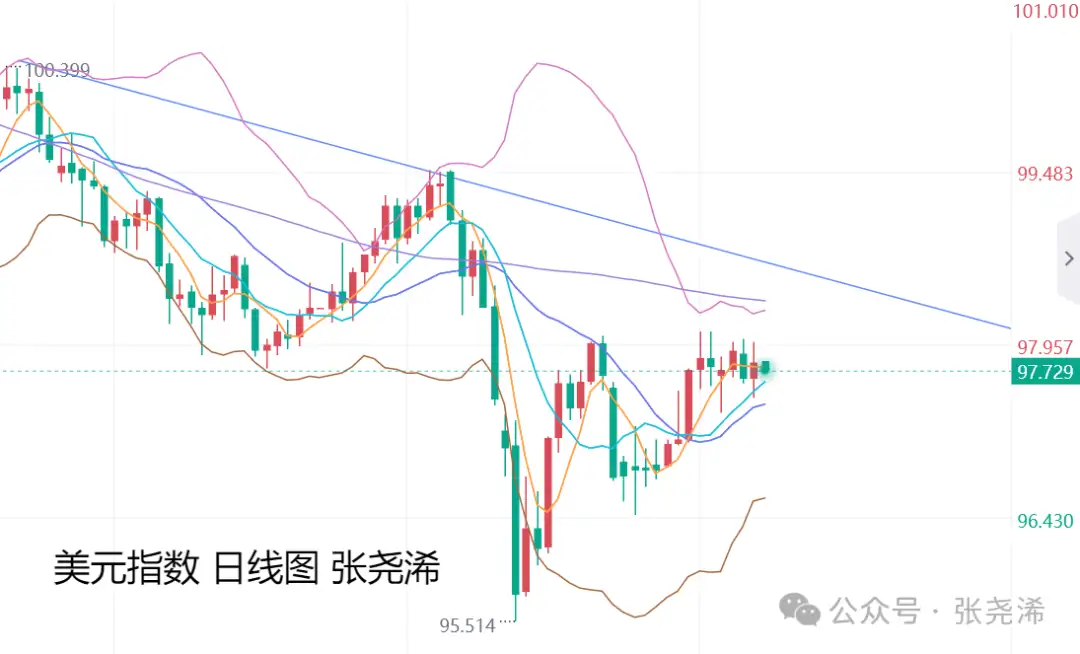
Today, focus on U.S. January PPI year-over-year and month-over-month data, as well as February Chicago PMI and December construction spending month-over-month data. PPI is expected to decline significantly, supporting rate cut expectations. Subsequent data are also expected to be weak, which is favorable for gold prices. Therefore, intraday, gold can be viewed as mainly bullish on dips.
Additionally, yesterday’s weekly U.S. initial jobless claims slightly increased. The market still expects the Fed to cut rates twice this year. The U.S. Trade Representative announced tariffs on some countries will be raised from 10% to 15% or higher. The path of tariffs and their impact on inflation and growth expectations are far from over. Geopolitical uncertainties also persist long-term.
In terms of demand, PDR Gold ETF holdings data show that as of February 25, the world’s largest gold ETF—the SPDR Gold Trust—held 1097.62 tons, an increase of 3.43 tons from the previous trading day, reaching a new high since February 2021. This accumulation signals strong institutional confidence in gold’s long-term value.
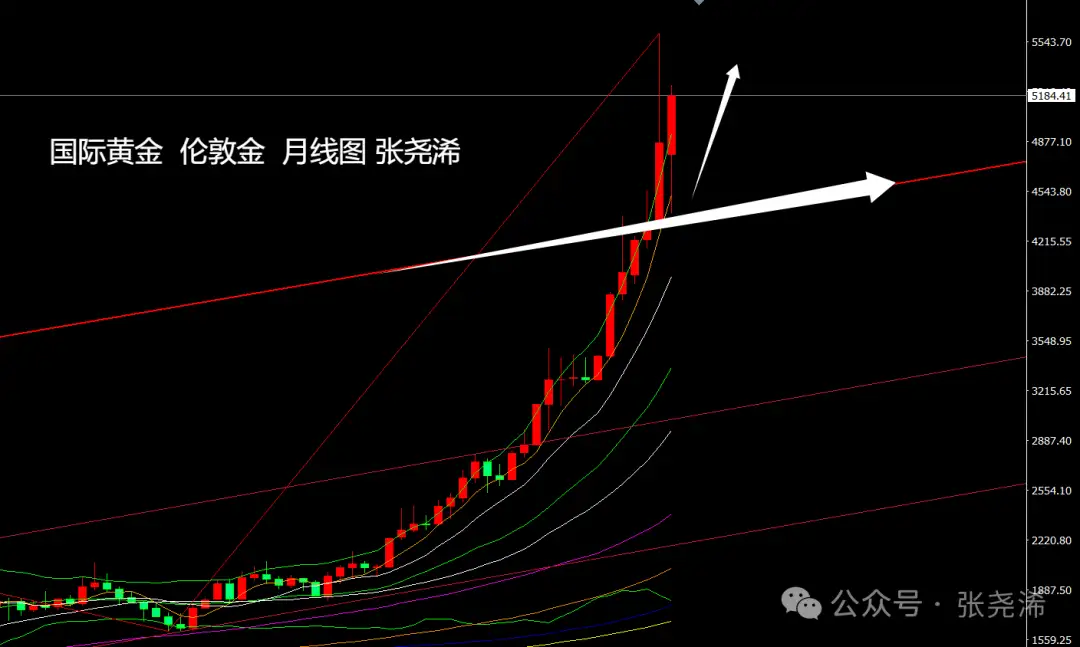
Overall, amid rate cuts, tariff concerns, geopolitical risks, and other factors, gold prices are still expected to maintain a bullish outlook. The current sideways movement appears to be consolidating strength, waiting for the next trigger. Gold still has the potential to break above $6,000.
On the technical side, at the monthly level, gold in February continued to fall after a bearish inverted hammer in January. After breaking through the resistance of the upward trendline at the beginning of the year, it turned support, stopped falling, and rebounded, remaining within a new bull market space. It also stayed above the 5-month moving average, indicating that the bearish correction in January has exhausted. The new bullish outlook remains valid, and the trend is expected to strengthen and reach new highs.
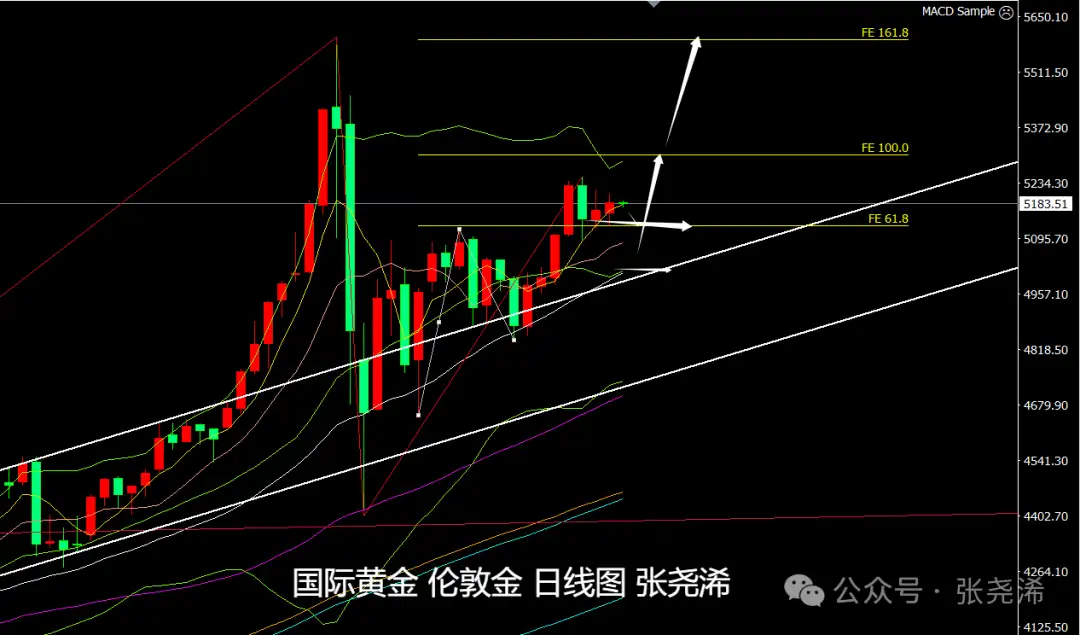
On the daily chart, gold is currently in a consolidation phase. The bulls have not gained further momentum, but the price remains above short-term moving averages. The Bollinger Bands are trending upward, and technical indicators are signaling bullishness, suggesting the outlook remains upward. Support levels are to be watched at various moving averages, and the overall bias remains bullish on dips.
Gold: Support around $5160 or $5120; Resistance around $5225 or $5260.
Silver: Support around $86.25 or $85.00; Resistance around $90.45 or $92.00.
Note:
Gold TD = (International gold price × exchange rate) / 31.1035
A $1 fluctuation in international gold prices roughly causes a $0.25 change in Gold TD (theoretically).
U.S. futures gold price = London spot price × (1 + gold swap rate × days to expiry / 365)
Follow me to make your gold trading ideas clearer!
Review historical causes and effects, interpret current environment, and forecast future trends. Committed to bold predictions and cautious trading principles. – Zhang Yaoxi
The above opinions and analysis represent only the author’s personal views, for reference only, not trading advice. Trade at your own risk.
You decide your own money.