Trade
Basic
Futures
Futures
Hundreds of contracts settled in USDT or BTC
TradFi
Gold
Trade global traditional assets with USDT in one place
Options
Hot
Trade European-style vanilla options
Unified Account
Maximize your capital efficiency
Demo Trading
Futures Kickoff
Get prepared for your futures trading
Futures Events
Participate in events to win generous rewards
Demo Trading
Use virtual funds to experience risk-free trading
Earn
Launch
CandyDrop
Collect candies to earn airdrops
Launchpool
Quick staking, earn potential new tokens
HODLer Airdrop
Hold GT and get massive airdrops for free
Launchpad
Be early to the next big token project
Alpha Points
Trade on-chain assets and enjoy airdrop rewards!
Futures Points
Earn futures points and claim airdrop rewards
Investment
Simple Earn
Earn interests with idle tokens
Auto-Invest
Auto-invest on a regular basis
Dual Investment
Buy low and sell high to take profits from price fluctuations
Soft Staking
Earn rewards with flexible staking
Crypto Loan
0 Fees
Pledge one crypto to borrow another
Lending Center
One-stop lending hub
VIP Wealth Hub
Customized wealth management empowers your assets growth
Private Wealth Management
Customized asset management to grow your digital assets
Quant Fund
Top asset management team helps you profit without hassle
Staking
Stake cryptos to earn in PoS products
Smart Leverage
New
No forced liquidation before maturity, worry-free leveraged gains
GUSD Minting
Use USDT/USDC to mint GUSD for treasury-level yields
More
Participate in horse racing betting, complete tasks to earn horse racing tickets, and enjoy a million red envelope rain daily, sharing a prize pool of 100,000 USDT at the Gate 2026 Spring Festival Celebration. https://www.gate.com/competition/year-of-horse-2026?ref_type=165&utm_cmp=7EQB9Jba&ref=VQVFXQ8MAG
View Original
- Reward
- like
- Comment
- Repost
- Share
It's time to relax during garbage time! Starting from the fourth day of the lunar new year, we will return. This period is mainly for vacation! Everyone, please stay safe. Overall, it's just bottom fluctuation; it's not a true bottom. We can only say that after a significant drop, it's time to rest for half a month. Will it continue to decline? I believe it's highly probable. To see a reversal, we need to wait! Everyone, please be patient. Continue holding the spot holdings.
View Original- Reward
- 1
- 2
- Repost
- Share
少思缘ShaoSiyuanAStoryAbout :
:
Happy New Year 🧨View More
Magiclab
魔法原子
Created By@ChainStrategyStudyGroup-
Listing Progress
0.00%
MC:
$0.1
More Tokens
Participate in horse racing betting, complete tasks to earn horse racing tickets, and enjoy a million red envelope rain daily, sharing a prize pool of 100,000 USDT at the Gate 2026 Spring Festival Celebration. https://www.gate.com/competition/year-of-horse-2026?ref_type=165&utm_cmp=7EQB9Jba&ref=VVBDUF1YUQ
View Original
- Reward
- like
- Comment
- Repost
- Share
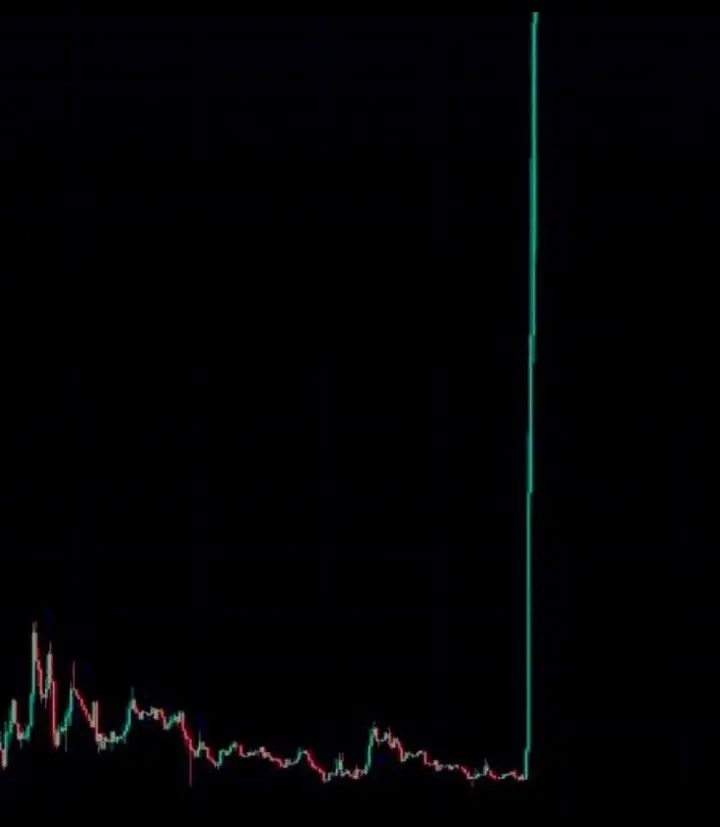
Tell me the name of a coin whose next candles are going to look like this.
- Reward
- like
- Comment
- Repost
- Share
Post and Interact to Share $50,000 Red Packets on Gate Square https://www.gate.com/campaigns/4044?ref=VLNFU1LCUW&ref_type=132

- Reward
- like
- Comment
- Repost
- Share
Participate in horse racing betting, complete tasks to earn horse racing tickets, and enjoy a million red envelope rain daily, sharing a prize pool of 100,000 USDT at the Gate 2026 Spring Festival Celebration. https://www.gate.com/competition/year-of-horse-2026?ref_type=165&utm_cmp=7EQB9Jba&ref=AQVHU19A
View Original
- Reward
- like
- Comment
- Repost
- Share
Participate in horse racing betting, complete tasks to earn horse racing tickets, and enjoy a million red envelope rain daily, sharing a prize pool of 100,000 USDT at the Gate 2026 Spring Festival Celebration. https://www.gate.com/competition/year-of-horse-2026?ref_type=165&utm_cmp=7EQB9Jba&ref=VVYRAWPWAA
View Original
- Reward
- like
- Comment
- Repost
- Share
Participate in horse racing betting, complete tasks to earn horse racing tickets, and enjoy a million red envelope rain daily, sharing a prize pool of 100,000 USDT at Gate 2026 Spring Festival Celebration. https://www.gate.com/competition/year-of-horse-2026?ref_type=165&utm_cmp=7EQB9Jba&ref=VVLEBFXAUW
View Original
- Reward
- like
- Comment
- Repost
- Share
Seller presence:Supply increases near resistance
122
- Reward
- like
- Comment
- Repost
- Share
Gate Live'ın 2026 Lunar New Year Online Gala'sı tam senin ritim serisine yakışır bir etkinlik – bugün 12:00 UTC'de (bizim saatle 15:00) başlıyor, piyasa incelemesi, eğlenceli etkileşim, quiz ve nonstop red packet rain ($888 GT paylaşımı) ile dolu. Reserve link: https://www.gate.com/zh/live/video/1de9e10983b44c59a766fbfd3dfed794?type=live
Seriye bağlayalım: Kısa, akıcı ve senin tarzında – festival ritmini tutmak, anı paylaşmak üzerine.
Post (Gate Square için hazır – İngilizce):
#CelebratingNewYearOnGateSquare
Sustaining Momentum in Lunar New Year Gala: The Gentle Rhythm of Shared Moments
As the
Seriye bağlayalım: Kısa, akıcı ve senin tarzında – festival ritmini tutmak, anı paylaşmak üzerine.
Post (Gate Square için hazır – İngilizce):
#CelebratingNewYearOnGateSquare
Sustaining Momentum in Lunar New Year Gala: The Gentle Rhythm of Shared Moments
As the

- Reward
- 5
- 6
- Repost
- Share
Ryakpanda :
:
Good luck and prosperity 🧧View More
Participate in horse racing betting, complete tasks to earn horse racing tickets, and enjoy a million red envelope rain daily, sharing a prize pool of 100,000 USDT at the Gate 2026 Spring Festival Celebration. https://www.gate.com/competition/year-of-horse-2026?ref_type=165&utm_cmp=7EQB9Jba&ref=VVLFA10MAA
View Original
- Reward
- like
- Comment
- Repost
- Share
HAV
Haven Virtual Asset
Created By@OneMillionAYear
Subscription Progress
0.00%
MC:
$0
More Tokens
Participate in horse racing betting, complete tasks to earn horse racing tickets, and enjoy a million red envelope rain daily, sharing a prize pool of 100,000 USDT at Gate 2026 Spring Festival Celebration. https://www.gate.com/competition/year-of-horse-2026?ref_type=165&utm_cmp=7EQB9Jba&ref=VQAXB15YUW
View Original
- Reward
- like
- Comment
- Repost
- Share

- Reward
- like
- Comment
- Repost
- Share
Participate in horse racing betting, complete tasks to earn horse racing tickets, and enjoy a million red envelope rain daily, sharing a prize pool of 100,000 USDT at the Gate 2026 Spring Festival Celebration. https://www.gate.com/competition/year-of-horse-2026?ref_type=165&utm_cmp=7EQB9Jba&ref=VLMRUVBFAG
View Original
- Reward
- like
- Comment
- Repost
- Share
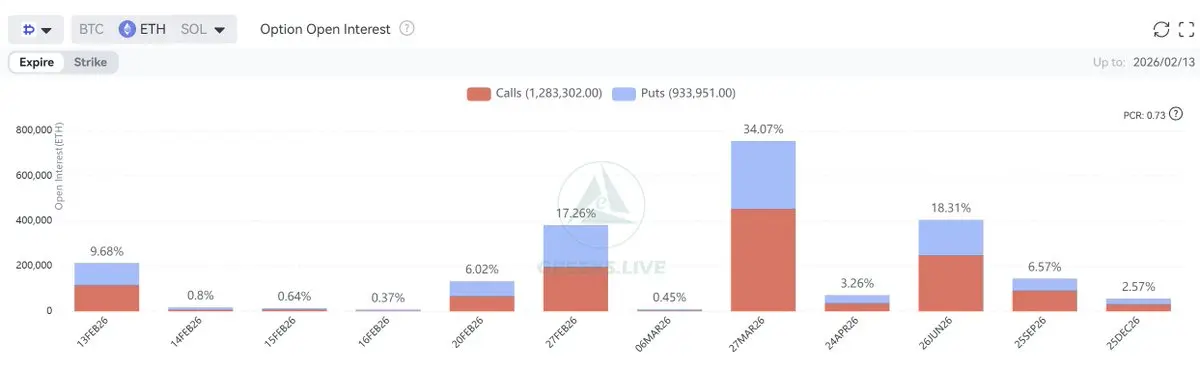
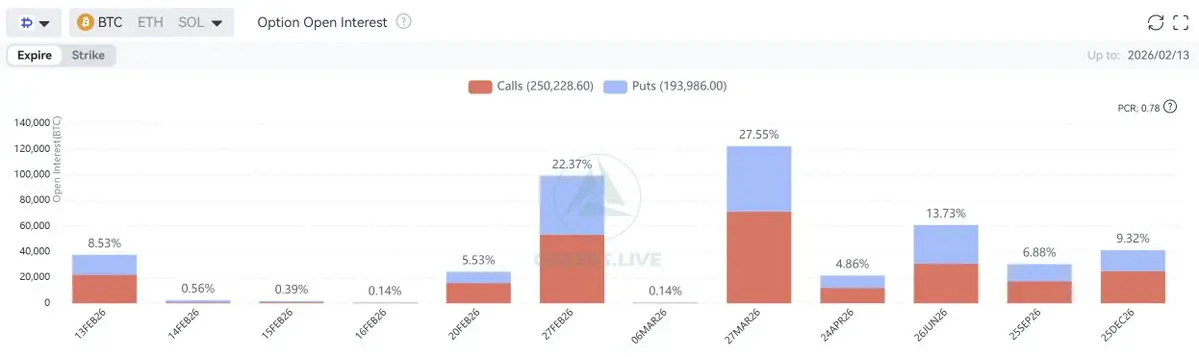
【February 13 Options Expiration Data】
38,000 BTC options are expiring, with a Put Call Ratio of 0.71. The maximum pain point is $74,000, with a notional value of $2.5 billion.
215,000 ETH options are expiring, with a Put Call Ratio of 0.82. The maximum pain point is $2,100, with a notional value of $410 million.
The crypto market continues to bleed and decline, with the speed of the maximum pain point decreasing rapidly. Today, options accounting for 9% of total open interest are expiring, totaling nearly $2.9 billion.
This week, the implied volatility of Bitcoin and Ethereum has decre
View Original38,000 BTC options are expiring, with a Put Call Ratio of 0.71. The maximum pain point is $74,000, with a notional value of $2.5 billion.
215,000 ETH options are expiring, with a Put Call Ratio of 0.82. The maximum pain point is $2,100, with a notional value of $410 million.
The crypto market continues to bleed and decline, with the speed of the maximum pain point decreasing rapidly. Today, options accounting for 9% of total open interest are expiring, totaling nearly $2.9 billion.
This week, the implied volatility of Bitcoin and Ethereum has decre
- Reward
- like
- Comment
- Repost
- Share
Short-Term Crypto Market Trend Overview (No Advice)
85
- Reward
- like
- Comment
- Repost
- Share
Participate in horse racing betting, complete tasks to earn horse racing tickets, and enjoy a million red envelope rain daily, sharing a prize pool of 100,000 USDT at the Gate 2026 Spring Festival Celebration. https://www.gate.com/competition/year-of-horse-2026?ref_type=165&utm_cmp=7EQB9Jba&ref=VVCVBLHYCQ
View Original
- Reward
- 1
- Comment
- Repost
- Share
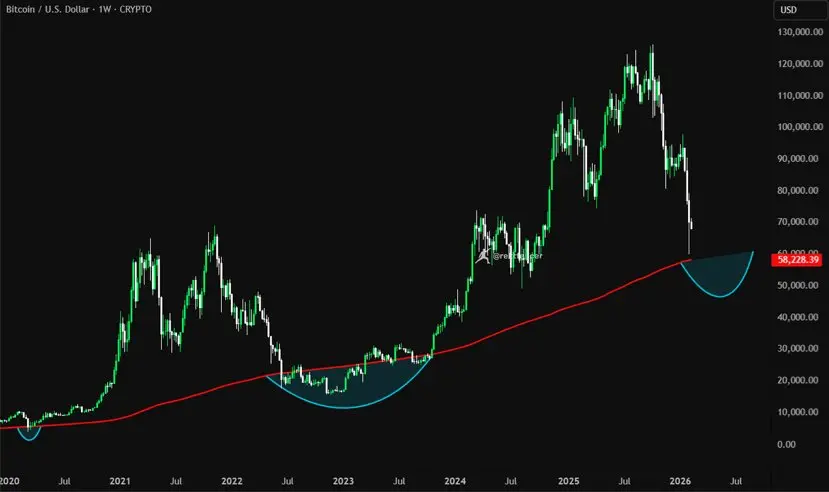
Look at the weekly Bitcoin $BTC chart.
One level has defined every cycle: the 200-week Moving Average.
2020 → wicked below → historic bull run
2022–23 → based around it → expansion to six figures
Now → price revisiting the same zone again
This line isn’t magic — it’s the long-term cost basis of the market.
Above it = optimism.
At/below it = fear, exhaustion, opportunity.
Most traders chase breakouts and sell panic.
Historically, the simple edge was:
• wait near/under 200W MA
• accumulate slowly
• avoid leverage
• hold patiently
Not calling the bottom — just playing probabilities.
In crypto, di
BTC-0.82%
- Reward
- like
- Comment
- Repost
- Share
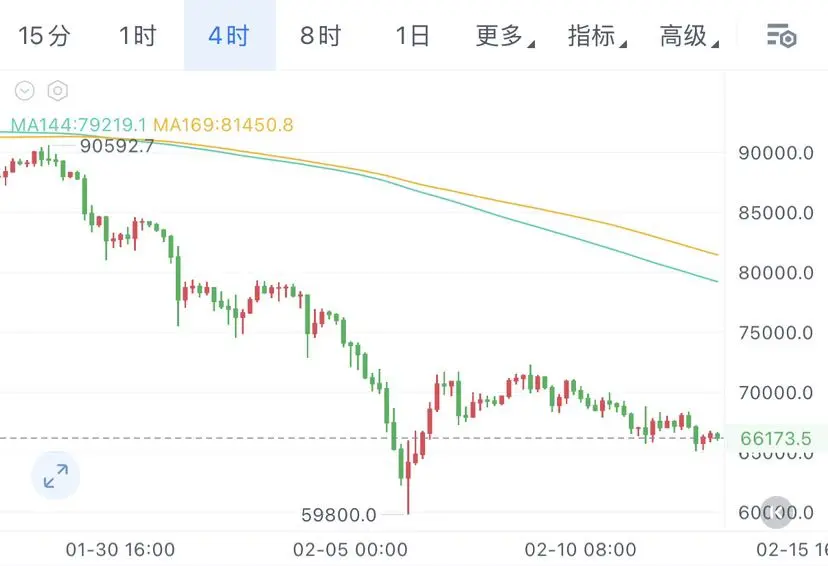
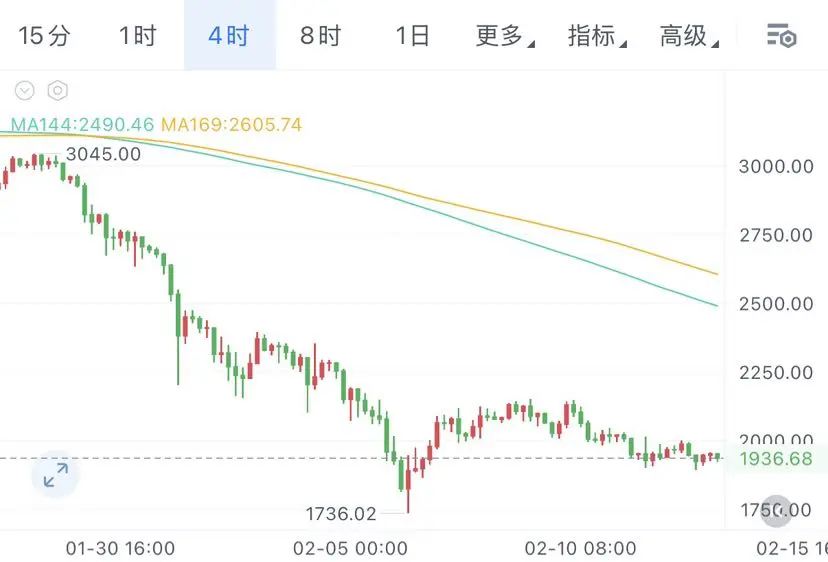
Friday, Week 2.13 Intraday Analysis
The four-hour price is trading below MA144 and MA169, with medium to long-term moving averages forming clear resistance. The short-term rebound is limited. The MACD indicator shows DIF and DEA both in negative territory, with the green bars slightly expanding. The bullish momentum still dominates. The KDJ indicator is hovering at low levels, and no clear golden cross signal has appeared yet, indicating insufficient rebound strength.
Personal advice, for reference only (strictly set stop-loss)
Bitcoin around 66,800, buy on dips to 67,800, target 65,000, 63,50
View OriginalThe four-hour price is trading below MA144 and MA169, with medium to long-term moving averages forming clear resistance. The short-term rebound is limited. The MACD indicator shows DIF and DEA both in negative territory, with the green bars slightly expanding. The bullish momentum still dominates. The KDJ indicator is hovering at low levels, and no clear golden cross signal has appeared yet, indicating insufficient rebound strength.
Personal advice, for reference only (strictly set stop-loss)
Bitcoin around 66,800, buy on dips to 67,800, target 65,000, 63,50
- Reward
- like
- Comment
- Repost
- Share
Load More
Join 40M users in our growing community
⚡️ Join 40M users in the crypto craze discussion
💬 Engage with your favorite top creators
👍 See what interests you
Trending Topics
View More33.89K Popularity
42.29K Popularity
15.2K Popularity
41.43K Popularity
250.59K Popularity
News
View MoreAn investor in Shanghai, China, invested 1.05 million yuan in virtual currency. After encountering platform withdrawal issues, they sued the court for compensation, but the court dismissed their claim.
4 m
Traditional Finance Alert: XAGUSD rises over 4%
7 m
Spot silver surges 5.00% intraday, currently at $79.11 per ounce
9 m
South Korean police lose Bitcoin seized and stored in cold wallets since 2021
14 m
Polymarket extends fees to sports markets; starting February 18, fees will be charged for NCAA and Serie A events.
14 m
Pin