Top 3 cryptocurrency price predictions: BTC heading towards the $100,000 mark, with ETH and XRP following behind
Bitcoin (BTC), Ethereum (ETH), and Ripple (XRP) all surged during Wednesday’s trading session, extending the strong upward momentum from the previous session with gains of over 4%, 7%, and 5% respectively. Notably, BTC closed firmly above a key resistance zone, reinforcing a bullish trend signal.
Meanwhile, ETH and XRP also demonstrated strength by successfully maintaining critical support levels, reflecting that demand is currently prevailing. With these positive technical signals, the three largest market cap cryptocurrencies are expected to continue their upward trend, targeting respective milestone levels of $100,000 for BTC, $3,500 for ETH, and $2.35 for XRP.
Bitcoin closes above the important resistance level of $94,253
Bitcoin’s price showed solid signals as it rebounded from the resistance of the range it previously broke through, around the $90,000 mark on January 8. After a mild recovery extending through Monday, the upward momentum was clearly reinforced on Tuesday when BTC surged over 4% and closed above the 61.8% Fibonacci retracement — from the April low at $74,508 to the October all-time high at $126,199 — corresponding to the $94,253 level. On Wednesday, Bitcoin continued to trade stably around $95,300.
In a positive scenario, if BTC maintains its current recovery momentum, the price could extend its rally and aim to challenge the important psychological level of $100,000.
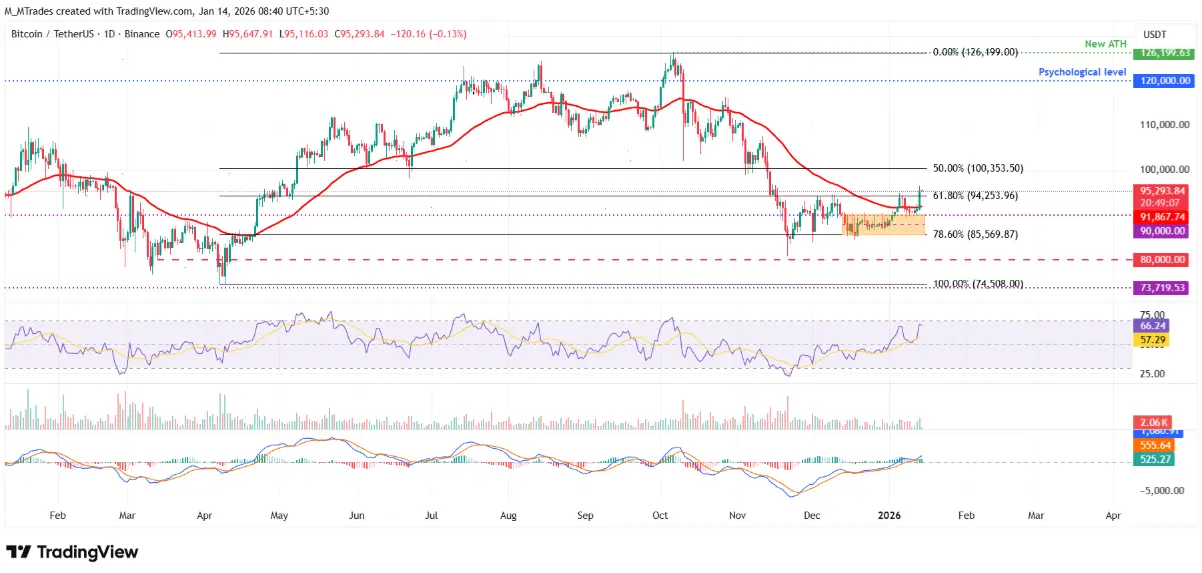 Daily BTC/USDT chart | Source: TradingView From a technical perspective, the Relative Strength Index (RSI) on the daily timeframe is at 66, crossing above the neutral 50 level and continuing upward, indicating increasing bullish momentum. Additionally, the MACD indicator remains bullish with a positive crossover, with green histogram bars expanding above the neutral line, further supporting short-term bullish prospects.
Conversely, if a correction occurs, Bitcoin may retest the critical support zone around $94,253.
Ethereum rebounds after retesting the 50-day EMA
Ethereum established a solid support zone around the 50-day EMA at $3,139 last week and continued to fluctuate stably around this area during Monday’s trading session. On Tuesday, strong buying pressure helped ETH break out over 7%, closing above $3,325. As of Wednesday morning, Ethereum is trading around $3,200, indicating that the trend remains positive.
If the current bullish momentum persists, ETH could extend its recovery toward the peak set on December 10 at approximately $3,447.
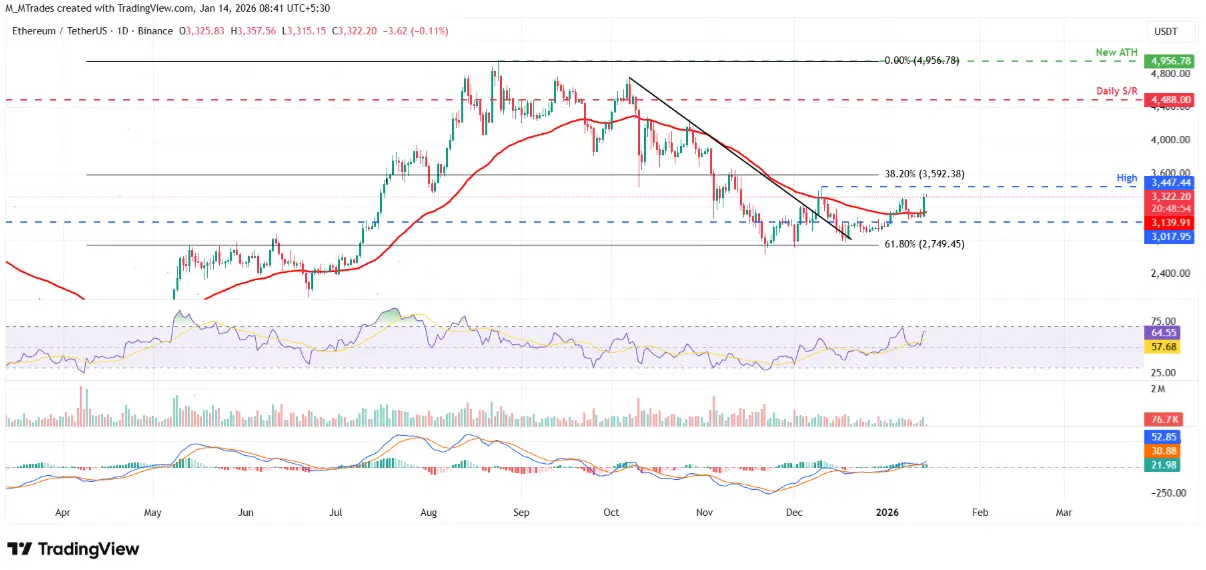 Daily ETH/USDT chart | Source: TradingView Notably, similar to Bitcoin, Ethereum’s technical indicators RSI and MACD are both signaling bullish momentum, further reinforcing short-term positive outlooks.
However, investors should remain cautious of potential corrections. If profit-taking pressure emerges, ETH could retest the critical support zone around the 50-day EMA at $3,139.
Bullish XRP targets $2.35
XRP’s price rebounded after finding strong support around the 50-day EMA at $2.07 last week, and traded sideways within this zone throughout Monday. On Tuesday, buying pressure increased significantly, helping XRP break out over 5%. As of Wednesday morning, the coin is trading around $2.16.
If the current recovery trend continues, XRP is likely to push higher and test the key resistance zone on the daily timeframe at $2.35.
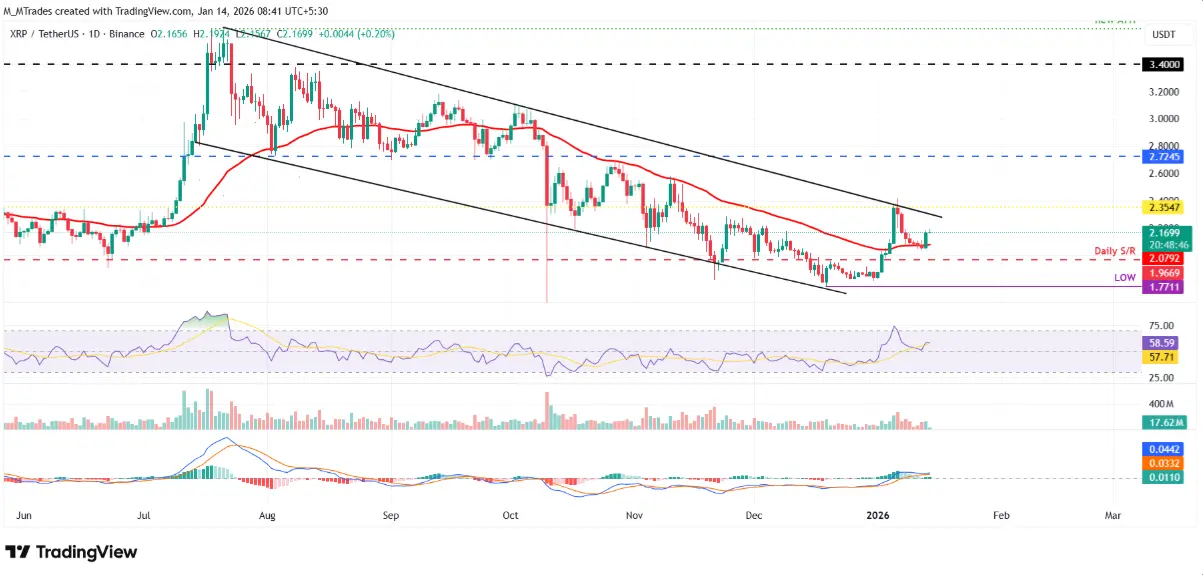 Daily XRP/USDT chart | Source: TradingView Notably, similar to Bitcoin and Ethereum, XRP’s key momentum indicators such as RSI and MACD are both signaling positive momentum, further supporting the short-term bullish scenario.
Conversely, if selling pressure resumes, XRP could retreat to retest the support zone around the 50-day EMA at $2.07.
Related Articles
Anatoly Yakovenko declares Solana surpasses Ethereum and approaches Bitcoin's level of decentralization
Data: In the past 24 hours, the entire network has been liquidated for $574 million, with long positions liquidated for $299 million and short positions liquidated for $274 million.