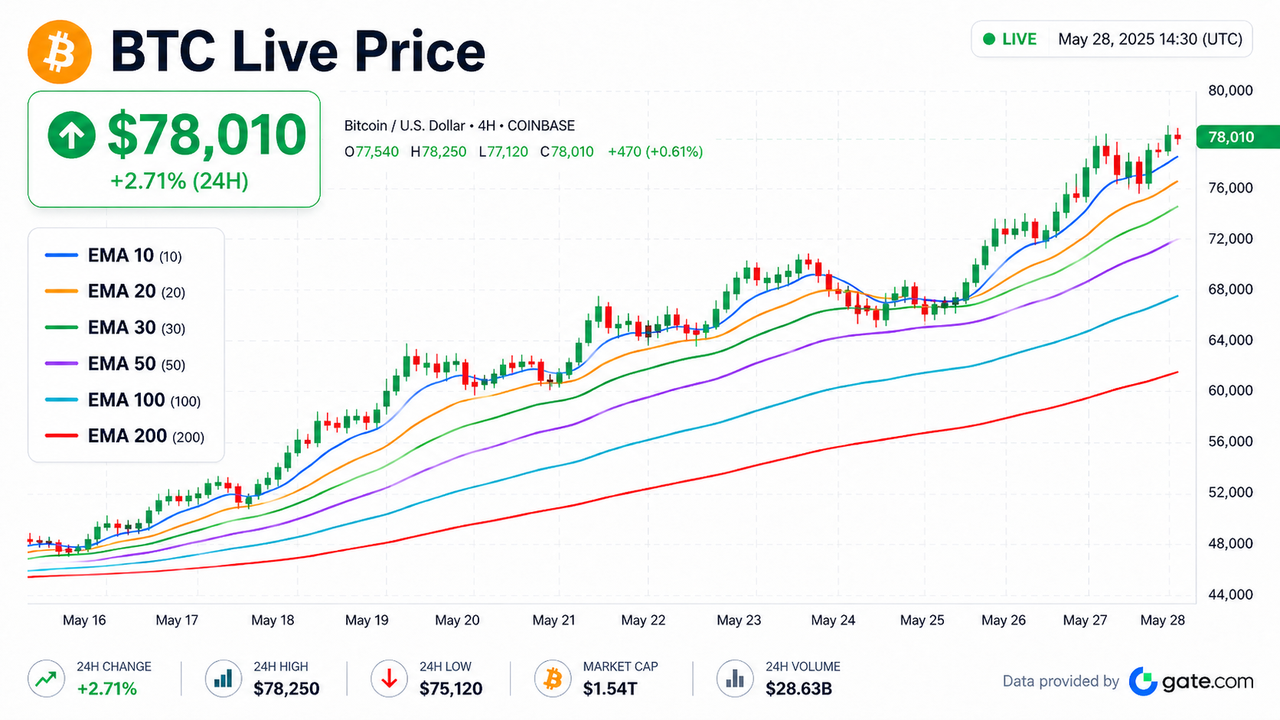
Los mercados de criptoactivos rara vez se mueven en línea recta y sin sobresaltos. Un token puede romper al alza, retroceder bruscamente, recuperarse dentro de la misma sesión y luego continuar con la tendencia. Para los principiantes, esto puede hacer que los gráficos de precios parezcan ruidosos y difíciles de leer. Las medias móviles exponenciales, o EMA, ayudan a reducir ese ruido al convertir el movimiento de precios en bruto en líneas de tendencia más suaves.
Lo esencial es el periodo de EMA. Una EMA de 10 periodos no se comporta como una EMA de 200 periodos. La línea más corta reacciona rápidamente y se mantiene cerca del precio, mientras que la línea más larga se mueve lentamente y muestra la dirección más amplia del mercado. Por eso los traders suelen usar varios periodos de EMA en el mismo gráfico. Cada uno responde a una pregunta diferente.
Una EMA corta puede ayudar a responder: "¿Se está moviendo el precio con fuerza ahora mismo?"
Una EMA media puede ayudar a responder: "¿La tendencia actual sigue siendo saludable?"
Una EMA larga puede ayudar a responder: "¿El mercado en general es alcista o bajista?"
No existe un único periodo de EMA que sea el mejor para todo trader, del mismo modo que no hay una elección universal entre EMA o SMA para cada estrategia. Un scalper que observa un gráfico de cinco minutos puede prestar más atención a la EMA 10 o la EMA 20 porque reaccionan rápidamente a los cambios de precio. Un swing trader que observa el gráfico diario puede centrarse más en la EMA 50, EMA 100 o EMA 200 para comprender la dirección de la tendencia más amplia.
Lo que controla el periodo de EMA
El periodo de EMA controla cuántas velas se consideran al calcular la media móvil exponencial, dando más peso a los precios recientes. En términos simples, controla la sensibilidad.
Un periodo de EMA más corto reacciona más rápido porque presta atención a una ventana de precios reciente más pequeña. Si Bitcoin u otro criptoactivo sube repentinamente, la EMA 10 normalmente girará al alza más rápido que la EMA 50 o la EMA 200. Esto hace que las EMA cortas sean útiles para detectar cambios rápidos de impulso, pero también las hace más vulnerables a señales falsas.
Un periodo de EMA más largo reacciona más lentamente porque suaviza la acción del precio en una ventana más amplia. Esto ayuda a filtrar picos temporales, mechas de liquidación y ruido del mercado a corto plazo. La contrapartida es el retraso. Una EMA larga puede confirmar una tendencia solo después de que el precio ya se haya movido significativamente.
Este es el equilibrio básico detrás de los periodos de EMA: velocidad frente a estabilidad.
| Periodo de EMA |
Sensibilidad |
Función común |
Caso de uso típico |
| EMA 10 |
Muy alta |
Señal de impulso rápido |
Scalping, entradas rápidas, retrocesos a corto plazo |
| EMA 20 |
Alta |
Guía de tendencia a corto plazo |
Day trading, continuación de tendencia |
| EMA 30 |
Moderada-alta |
Referencia de tendencia equilibrada |
Estructura a corto y medio plazo |
| EMA 50 |
Moderada |
Punto de referencia a medio plazo |
Swing trading, salud de la tendencia |
| EMA 100 |
Baja-moderada |
Confirmación más amplia |
Filtro de tendencia a medio y largo plazo |
| EMA 200 |
Baja |
Divisor de tendencia a largo plazo |
Estructura de mercado alcista y bajista |
EMA 10: sensibilidad a ultra corto plazo
La EMA 10 es uno de los periodos de EMA más rápidos que se usan comúnmente. Se mantiene cerca del precio y responde rápidamente cuando cambia el impulso. Debido a esto, los traders suelen usarla para leer la fortaleza o debilidad a muy corto plazo.
En el trading de criptoactivos, la EMA 10 puede ser útil durante movimientos fuertes de tendencia. Cuando el precio sube y se mantiene repetidamente por encima de la EMA 10, puede sugerir que los compradores siguen activos y los retrocesos son poco profundos. En mercados rápidos, los traders pueden tratar la EMA 10 como una línea de soporte dinámica a corto plazo.
Por ejemplo, si un token rompe al alza y continúa cerrando por encima de la EMA 10 en un marco temporal inferior, algunos traders pueden interpretarlo como una señal de impulso agresivo. Si el precio comienza a cerrar por debajo de la EMA 10 repetidamente, puede sugerir que el empuje inmediato se está debilitando.
La debilidad de la EMA 10 es el ruido. Los mercados de criptoactivos a menudo producen velas repentinas que rompen brevemente las EMA cortas antes de revertirse. Por esta razón, la EMA 10 rara vez es suficiente por sí sola. Funciona mejor cuando se combina con la estructura del precio, el volumen o una EMA más lenta, como la EMA 20 o EMA 50.
EMA 20: referencia de tendencia a corto plazo
La EMA 20 se usa ampliamente como referencia de tendencia a corto plazo. Es más lenta que la EMA 10, pero sigue siendo lo suficientemente receptiva para seguir el movimiento activo del mercado. Muchos traders la usan para juzgar si una tendencia a corto plazo se mantiene intacta.
En un mercado alcista, el precio que se mantiene por encima de la EMA 20 puede mostrar que los compradores siguen defendiendo la tendencia. En un mercado bajista, el precio que se mantiene por debajo de la EMA 20 puede sugerir que los vendedores siguen al mando. Como es menos sensible que la EMA 10, la EMA 20 puede ofrecer una visión ligeramente más clara de la dirección de la tendencia.
La EMA 20 es especialmente común entre los day traders y los swing traders a corto plazo. En un gráfico de cuatro horas o diario, puede ayudar a identificar zonas de retroceso durante condiciones de tendencia. Si el precio retrocede hasta la EMA 20 y luego rebota, los traders pueden verlo como una señal de continuación. Si el precio la rompe con una fuerte presión vendedora, la tendencia a corto plazo puede estar perdiendo fuerza.
Aun así, la EMA 20 puede dar señales engañosas en mercados laterales. Cuando el precio se mueve en un rango, puede cruzar por encima y por debajo de la EMA 20 repetidamente sin formar una tendencia real. Por eso los traders suelen comparar la EMA 20 con EMA más largas para ver si la estructura más amplia respalda la señal.
EMA 30: sensibilidad equilibrada frente a estabilidad
La EMA 30 se sitúa entre la velocidad a corto plazo y la estabilidad a medio plazo. No es tan rápida como la EMA 10 o la EMA 20, pero aún reacciona más rápido que la EMA 50. Esto la hace útil para traders que desean una línea más suave sin alejarse demasiado de la acción actual del precio.
En los mercados de criptoactivos, la EMA 30 puede ayudar a reducir parte del ruido que aparece alrededor de las EMA más cortas. Durante condiciones agitadas, el precio puede romper la EMA 10 varias veces, mientras que la EMA 30 ofrece una visión más estable de la tendencia subyacente. Esto puede ser útil para traders que no quieren reaccionar a cada vela pequeña.
La EMA 30 suele ser útil en mercados con tendencia donde los retrocesos son más profundos que los de la EMA 10 o EMA 20, pero no lo suficientemente fuertes como para romper la estructura a medio plazo. Si el precio respeta la EMA 30 varias veces, los traders pueden verla como un nivel de soporte o resistencia dinámica significativo.
Su función no es tan conocida como la de la EMA 50 o EMA 200, pero puede ser práctica para la lectura de gráficos. Ofrece un punto intermedio: más rápida que un punto de referencia de tendencia a medio plazo, pero menos nerviosa que las EMA de ultra corto plazo.
EMA 50: punto de referencia de tendencia a medio plazo
La EMA 50 es una de las medias móviles más seguidas en el análisis técnico. En cripto, a menudo actúa como punto de referencia de tendencia a medio plazo. Los traders la usan para juzgar si el mercado sigue tendiendo con fuerza o si comienza a pasar a una estructura más débil.
Cuando el precio está por encima de la EMA 50 y la EMA 50 tiene pendiente ascendente, el mercado puede estar en una tendencia alcista saludable a medio plazo. Cuando el precio está por debajo de la EMA 50 y la línea tiene pendiente descendente, los vendedores pueden tener más control. Esto hace que la EMA 50 sea útil tanto como filtro de tendencia como zona de soporte o resistencia dinámica.
Para los swing traders, la EMA 50 puede ayudar a separar los retrocesos normales de los posibles cambios de tendencia. Un token puede caer por debajo de la EMA 20 durante un retroceso, pero aún permanecer por encima de la EMA 50. En ese caso, el impulso a corto plazo puede ser más débil, pero la tendencia más amplia puede seguir intacta.
La EMA 50 también es útil cuando se compara con la EMA 200. Cuando la EMA 50 está por encima de la EMA 200, los traders suelen ver la estructura como más alcista. Cuando la EMA 50 está por debajo de la EMA 200, la estructura más amplia puede ser más débil. Sin embargo, estas señales no deben tratarse como instrucciones automáticas de compra o venta. Son herramientas de contexto, no garantías.
EMA 100: confirmación a medio y largo plazo
La EMA 100 es más lenta que la EMA 50 y se usa a menudo para la confirmación a medio y largo plazo. Ayuda a los traders a ver si una tendencia tiene un respaldo más profundo más allá de la acción del precio a corto plazo.
En cripto, el precio puede moverse bruscamente por encima de las EMA más cortas durante rallys temporales. La EMA 100 ayuda a filtrar parte de ese ruido. Si el precio está por encima de la EMA 20 y EMA 50, pero aún tiene dificultades por debajo de la EMA 100, los traders pueden ver el mercado como en mejora pero no completamente confirmado. Si el precio recupera la EMA 100 y se mantiene por encima, la tendencia puede parecer más fuerte.
La EMA 100 también puede actuar como un nivel de retroceso importante durante tendencias alcistas más grandes. En mercados fuertes, el precio puede retroceder solo hasta la EMA 20 o EMA 50. En tendencias más lentas o más maduras, los retrocesos más profundos pueden alcanzar la EMA 100 antes de que los compradores intervengan.
Para traders a más largo plazo, la EMA 100 ayuda a cerrar la brecha entre el análisis de tendencia a medio plazo y el macro. No es tan lenta como la EMA 200, pero es lo suficientemente estable para no reaccionar a cada movimiento del mercado a corto plazo.
EMA 200: el divisor de mercado alcista y bajista a largo plazo
La EMA 200 es uno de los indicadores técnicos a largo plazo más importantes para identificar la dirección de la tendencia más amplia. En el trading de criptoactivos, se usa a menudo como divisor de mercado alcista y bajista. Cuando el precio está por encima de la EMA 200, los traders pueden ver la estructura general del mercado como más saludable. Cuando el precio está por debajo de la EMA 200, el mercado puede estar en una fase más débil o más defensiva.
Debido a que la EMA 200 reacciona lentamente, no está diseñada para entradas rápidas. Su principal valor es la perspectiva. Ayuda a los traders a comprender si las señales a corto plazo ocurren dentro de una tendencia alcista más grande o en contra de una tendencia bajista más amplia.
Por ejemplo, una señal alcista de la EMA 10 o EMA 20 por encima de la EMA 200 puede tener un significado diferente que la misma señal por debajo de la EMA 200. Por encima de la EMA 200, la fortaleza a corto plazo puede alinearse con la tendencia más grande. Por debajo de la EMA 200, el mismo movimiento a corto plazo puede ser solo un rally de alivio a menos que el precio pueda recuperar niveles más fuertes a largo plazo.
La EMA 200 también puede funcionar como soporte o resistencia dinámica. En mercados alcistas, los retrocesos importantes pueden probar la EMA 200 antes de recuperarse. En mercados bajistas, los rallys pueden fallar cerca de la EMA 200 porque los vendedores a largo plazo siguen activos.
Sin embargo, la EMA 200 no es perfecta. Puede retrasarse durante reversiones rápidas, y los mercados de criptoactivos pueden moverse brevemente por encima o por debajo de ella antes de revertirse nuevamente. Debe usarse como una herramienta de contexto de tendencia, no como una predicción independiente.
Conclusión
Los periodos de EMA ayudan a los traders a elegir el nivel de sensibilidad que desean de una media móvil. Los periodos más cortos, como EMA 10 y EMA 20, reaccionan rápidamente y son útiles para leer el impulso a corto plazo. Los periodos intermedios, como EMA 30 y EMA 50, ayudan a equilibrar la velocidad con la estabilidad de la tendencia. Los periodos más largos, como EMA 100 y EMA 200, suavizan el ruido y ayudan a definir la estructura más amplia del mercado.
En el trading de criptoactivos, el mejor periodo de EMA depende del marco temporal y el propósito del trader. Un scalper puede centrarse en EMA rápidas, mientras que un swing trader puede confiar más en la EMA 50, EMA 100 y EMA 200. Muchos traders combinan múltiples EMA para ver si el impulso a corto plazo está de acuerdo con la tendencia más amplia.
El punto más importante es que ningún periodo de EMA es universalmente el mejor. Cada uno muestra una capa diferente del comportamiento del mercado. Cuando se usan con cuidado, las EMA pueden ayudar a los traders a leer la dirección de la tendencia, identificar posibles soportes y resistencias, y evitar reaccionar demasiado rápido al ruido del mercado.
Preguntas frecuentes
¿Qué significa el periodo de EMA?
El periodo de EMA muestra cuántas velas se usan para calcular la media móvil exponencial. Un periodo más corto reacciona más rápido a los cambios de precio recientes, mientras que un periodo más largo crea una línea de tendencia más suave.
¿Es la EMA 10 mejor que la EMA 200?
La EMA 10 no es mejor que la EMA 200. Sirven para propósitos diferentes. La EMA 10 es útil para el impulso a corto plazo, mientras que la EMA 200 se usa principalmente para entender la dirección de la tendencia a largo plazo.
¿Qué EMA es la mejor para el trading de criptoactivos?
No existe una única EMA que sea la mejor para el trading de criptoactivos. Los traders a corto plazo pueden preferir la EMA 10 o EMA 20, mientras que los swing traders y los traders a más largo plazo suelen observar la EMA 50, EMA 100 y EMA 200.
¿Por qué los traders usan múltiples EMA?
Los traders usan múltiples EMA para comparar el impulso a corto plazo con la dirección de la tendencia más amplia. Esto les ayuda a ver si un movimiento rápido de precio está alineado con la estructura general del mercado o si es solo una reacción temporal.
¿Pueden las líneas EMA actuar como soporte y resistencia?
Sí. Las líneas EMA pueden actuar como soporte dinámico en tendencias alcistas y resistencia dinámica en tendencias bajistas. Sin embargo, deben confirmarse con la acción del precio, el volumen y el contexto más amplio del mercado.