

The Anatomy of a Crazy Day
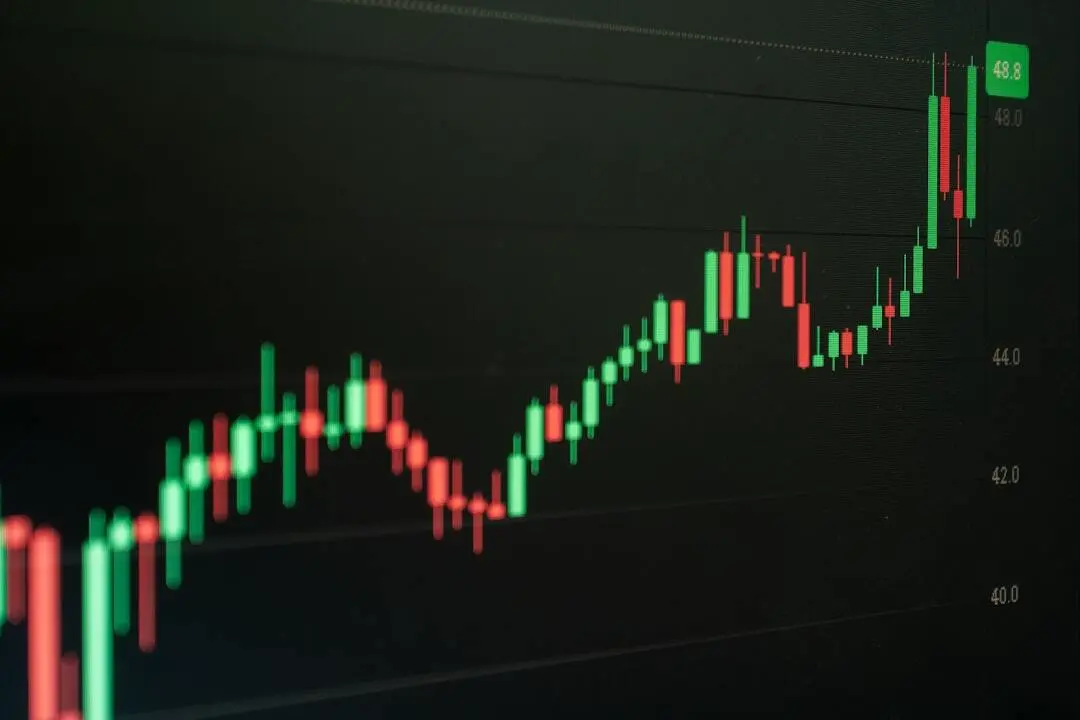
April 30, 2026, will be etched in the history of global financial markets as a day of unparalleled volatility and resilience. Amidst war-fueled inflation, slowing growth, and central bank dilemmas, the S&P 500 index managed to shake off all this uncertainty in a single day, climbing above 7,200 points.
The Sudden Collapse Triggered by a Single BOJ Move
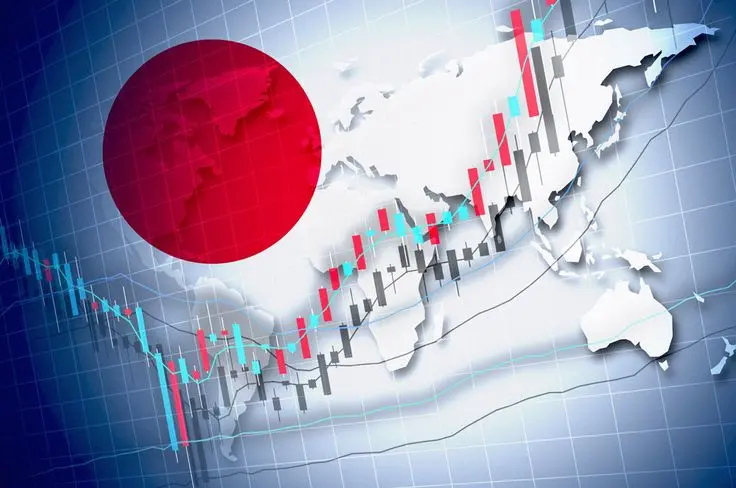
The most critical turning point of the day came from Japan. The Bank of Japan (BOJ) and the Ministry of Finance intervened directly in the foreign exchange market for the first time since 2024, providing support to the excessively depreciated yen. This move created a seismic effect in the USD/JPY pair; the pair experienced a sharp drop from 160.72 to 155.55 in a single candlestick.
This sudden currency movement triggered a chain reaction in global markets. Fear of a sudden collapse of decades of low-interest yen "carry trade" triggered panic selling on US stock markets. The S&P 500 index lost 0.52% in just 45 minutes, wiping out approximately $350 billion in market capitalization.
Rising from the Ashes: A $600 Billion Recovery in 4 Hours
However, this sudden collapse was followed by an equally rapid recovery. Investors quickly bought, assessing that Japan's intervention would not lead to a global liquidity crisis and that strong corporate balance sheets continued to form the cornerstones of the economy. Once the initial shock subsided, the S&P 500 not only erased its losses but also recovered over $600 billion in market capitalization in the following four hours, closing the day at a new all-time high.
Behind this extraordinary recovery were strong earnings reports from giants like Caterpillar, Alphabet, Eli Lilly, and Qualcomm, exceeding expectations. Alphabet's investments in cloud computing and artificial intelligence, in particular, reinforced confidence in technology stocks.
A Historic Peak Amidst All the Crises
The picture at the end of the day was incredible. The S&P 500 closed up 1.02% at 7,209.01, surpassing the 7,200-point mark for the first time in its history. The Nasdaq Composite Index also hit a new record high, rising 0.89% to 24,892.31. The Dow Jones Index completed the day with a massive jump of over 790 points. This performance resulted in massive monthly gains of 10.4% for the S&P 500 and 15.3% for the Nasdaq, marking the best monthly performances for the indices since 2020. The S&P 500's market value increased by over $6 trillion in April alone.
This rally occurred in an environment that surprised even the most pessimistic experts:
• War and Energy Crisis: An active war is raging in the Middle East, and oil prices are hovering above $120. • Stagflation Signal: Core PCE inflation, closely monitored by the Fed, jumped from 2.7% to 4.3% in one quarter. • Slowing Growth: US GDP lost momentum in the first quarter, falling short of expectations. • Global Intervention: The BOJ's first-ever intervention in the foreign exchange market highlighted tensions in the global financial system.
The Market's Key: Liquidity and AI Optimism
So how can markets rise despite such a negative picture? The answer lies in the abundance of global liquidity and unwavering faith in the artificial intelligence revolution. The expectation that central banks are nearing the end of their interest rate hike cycle, and the tangible results companies are beginning to see from their AI investments, have temporarily overshadowed geopolitical risks.
As Chris Zaccarelli of Northlight Asset Management noted, "As long as the economy continues to grow and companies increase their profits, we could see stock prices rising even in the face of higher energy prices and inflation."
The S&P 500's peak of 7,200 has gone down in history as proof of the market's ability to absorb short-term shocks and confidence in an AI-driven future. However, experts warn that if the war drags on and inflation becomes even more persistent, these rapid recoveries could give way to a more sustained downturn. All eyes are now on whether the S&P 500 can remain at these historic highs.
#Gate13周年现场直击 #Gate13周年
#Gate广场 #创作者狂欢 #内容挖矿
April 30, 2026, will be etched in the history of global financial markets as a day of unparalleled volatility and resilience. Amidst war-fueled inflation, slowing growth, and central bank dilemmas, the S&P 500 index managed to shake off all this uncertainty in a single day, climbing above 7,200 points.
The Sudden Collapse Triggered by a Single BOJ Move
The most critical turning point of the day came from Japan. The Bank of Japan (BOJ) and the Ministry of Finance intervened directly in the foreign exchange market for the first time since 2024, providing support to the excessively depreciated yen. This move created a seismic effect in the USD/JPY pair; the pair experienced a sharp drop from 160.72 to 155.55 in a single candlestick.
This sudden currency movement triggered a chain reaction in global markets. Fear of a sudden collapse of decades of low-interest yen "carry trade" triggered panic selling on US stock markets. The S&P 500 index lost 0.52% in just 45 minutes, wiping out approximately $350 billion in market capitalization.
Rising from the Ashes: A $600 Billion Recovery in 4 Hours
However, this sudden collapse was followed by an equally rapid recovery. Investors quickly bought, assessing that Japan's intervention would not lead to a global liquidity crisis and that strong corporate balance sheets continued to form the cornerstones of the economy. Once the initial shock subsided, the S&P 500 not only erased its losses but also recovered over $600 billion in market capitalization in the following four hours, closing the day at a new all-time high.
Behind this extraordinary recovery were strong earnings reports from giants like Caterpillar, Alphabet, Eli Lilly, and Qualcomm, exceeding expectations. Alphabet's investments in cloud computing and artificial intelligence, in particular, reinforced confidence in technology stocks.
A Historic Peak Amidst All the Crises
The picture at the end of the day was incredible. The S&P 500 closed up 1.02% at 7,209.01, surpassing the 7,200-point mark for the first time in its history. The Nasdaq Composite Index also hit a new record high, rising 0.89% to 24,892.31. The Dow Jones Index completed the day with a massive jump of over 790 points. This performance resulted in massive monthly gains of 10.4% for the S&P 500 and 15.3% for the Nasdaq, marking the best monthly performances for the indices since 2020. The S&P 500's market value increased by over $6 trillion in April alone.
This rally occurred in an environment that surprised even the most pessimistic experts:
• War and Energy Crisis: An active war is raging in the Middle East, and oil prices are hovering above $120. • Stagflation Signal: Core PCE inflation, closely monitored by the Fed, jumped from 2.7% to 4.3% in one quarter. • Slowing Growth: US GDP lost momentum in the first quarter, falling short of expectations. • Global Intervention: The BOJ's first-ever intervention in the foreign exchange market highlighted tensions in the global financial system.
The Market's Key: Liquidity and AI Optimism
So how can markets rise despite such a negative picture? The answer lies in the abundance of global liquidity and unwavering faith in the artificial intelligence revolution. The expectation that central banks are nearing the end of their interest rate hike cycle, and the tangible results companies are beginning to see from their AI investments, have temporarily overshadowed geopolitical risks.
As Chris Zaccarelli of Northlight Asset Management noted, "As long as the economy continues to grow and companies increase their profits, we could see stock prices rising even in the face of higher energy prices and inflation."
The S&P 500's peak of 7,200 has gone down in history as proof of the market's ability to absorb short-term shocks and confidence in an AI-driven future. However, experts warn that if the war drags on and inflation becomes even more persistent, these rapid recoveries could give way to a more sustained downturn. All eyes are now on whether the S&P 500 can remain at these historic highs.
#Gate13周年现场直击 #Gate13周年
#Gate广场 #创作者狂欢 #内容挖矿