MOVR vs XLM: A Comprehensive Comparison of Two Leading Blockchain Assets in 2024


Introduction: MOVR vs XLM Investment Comparison
In the cryptocurrency market, the comparison between Moonriver (MOVR) and Stellar (XLM) has always been a topic that investors cannot avoid. The two not only show significant differences in market capitalization ranking, use cases, and price performance, but also represent different positioning of crypto assets. Moonriver (MOVR): Since its launch in 2021, it has gained market recognition by leveraging EVM compatibility and smart contract deployment capabilities on the Kusama network, enabling Ethereum-based applications to operate on a parachain infrastructure. Stellar (XLM): Since its inception in 2014, it has been recognized as a decentralized gateway facilitating rapid, stable, and low-cost transfers of digital assets between banks, payment institutions, and individuals, with strong network throughput and cost-efficiency characteristics. This article will comprehensively analyze the investment value comparison between MOVR and XLM from the perspectives of historical price trends, supply mechanisms, network adoption, and technical ecosystems, while attempting to answer the most pressing question for investors:
"Which is the better buy right now?"
Moonriver (MOVR) vs Stellar (XLM) Market Analysis Report
I. Historical Price Comparison and Current Market Status
MOVR and XLM Historical Price Trends
MOVR (Moonriver):
- All-Time High (ATH): $494.26 (September 11, 2021)
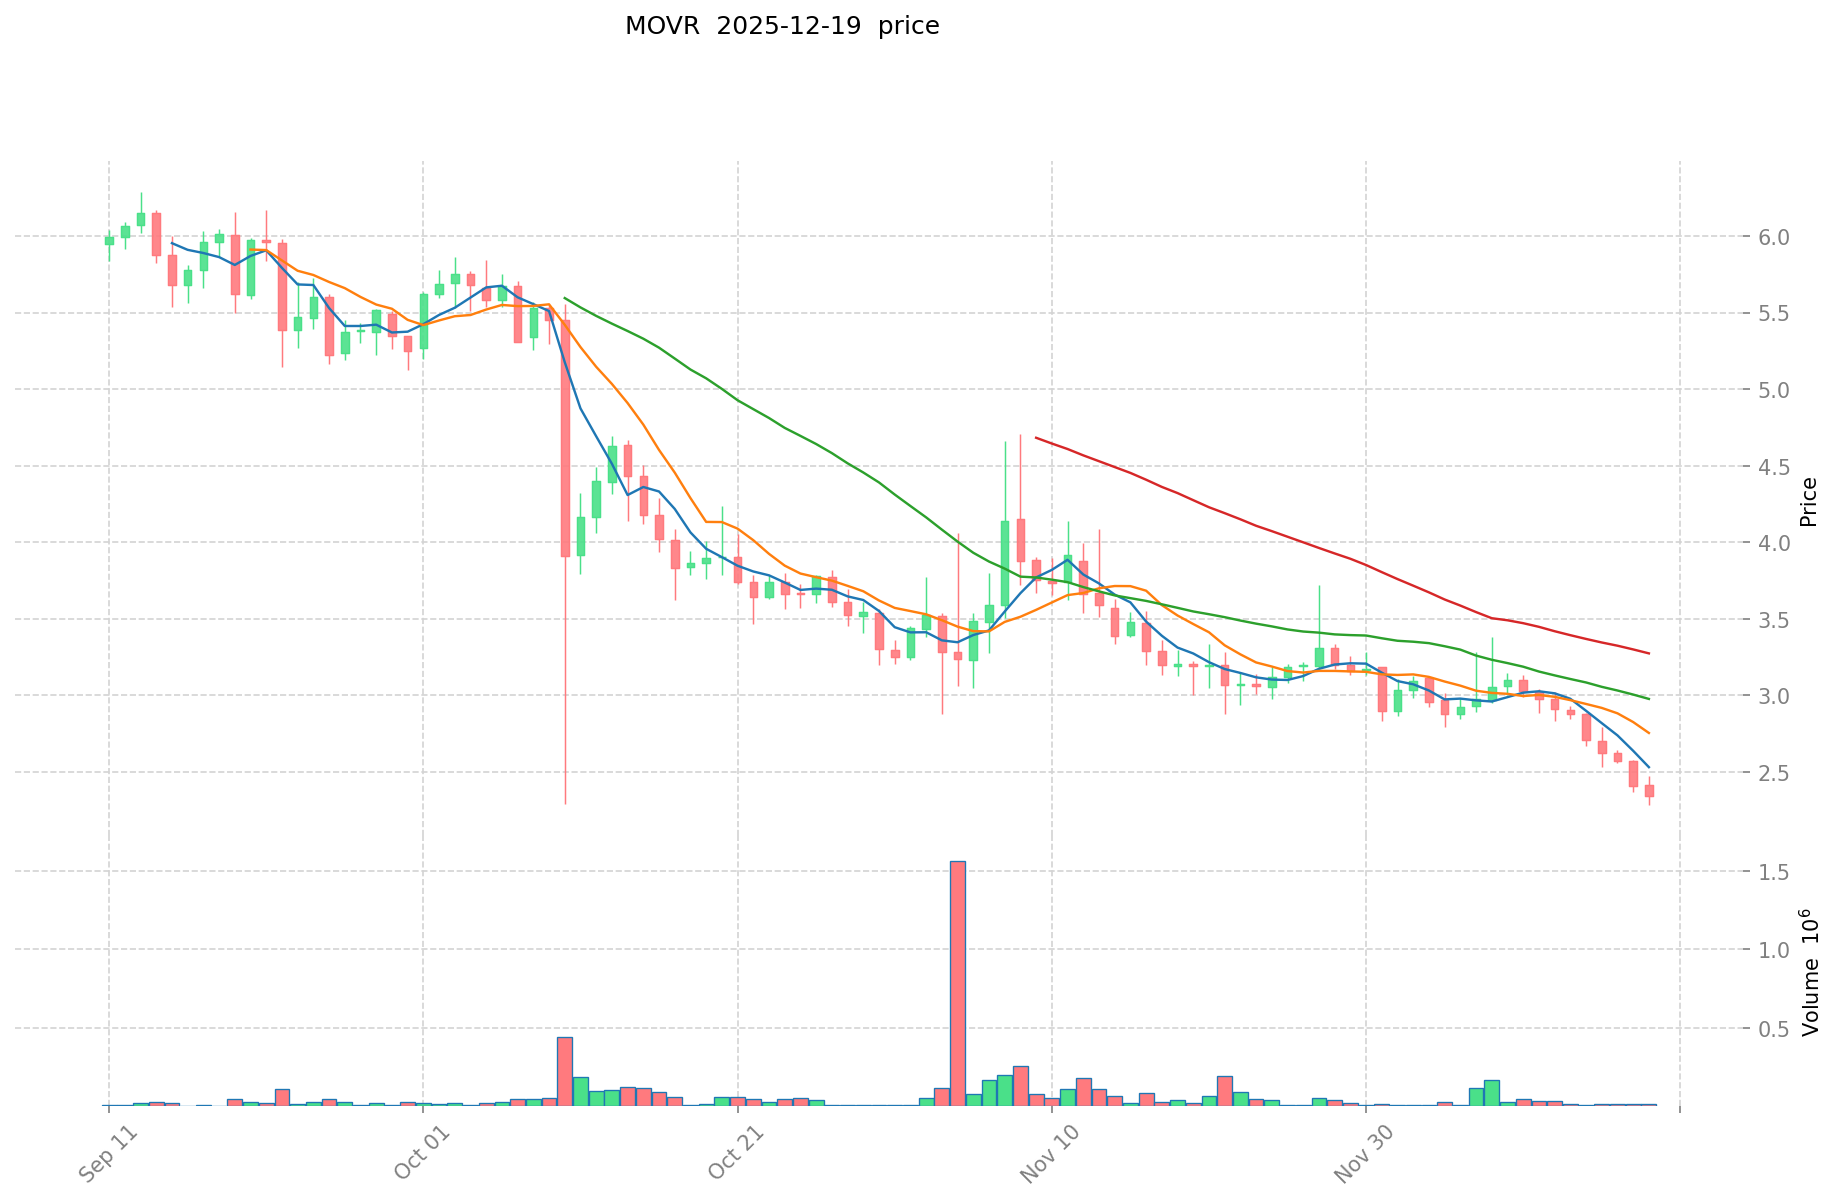
- All-Time Low (ATL): $2.30 (December 19, 2025)
- Peak-to-Current Decline: approximately 99.49%
XLM (Stellar):
- All-Time High (ATH): $0.875563 (January 3, 2018)
- All-Time Low (ATL): $0.00047612 (March 5, 2015)
- Current Price Performance: XLM has experienced significant recovery from its historical lows
Comparative Analysis
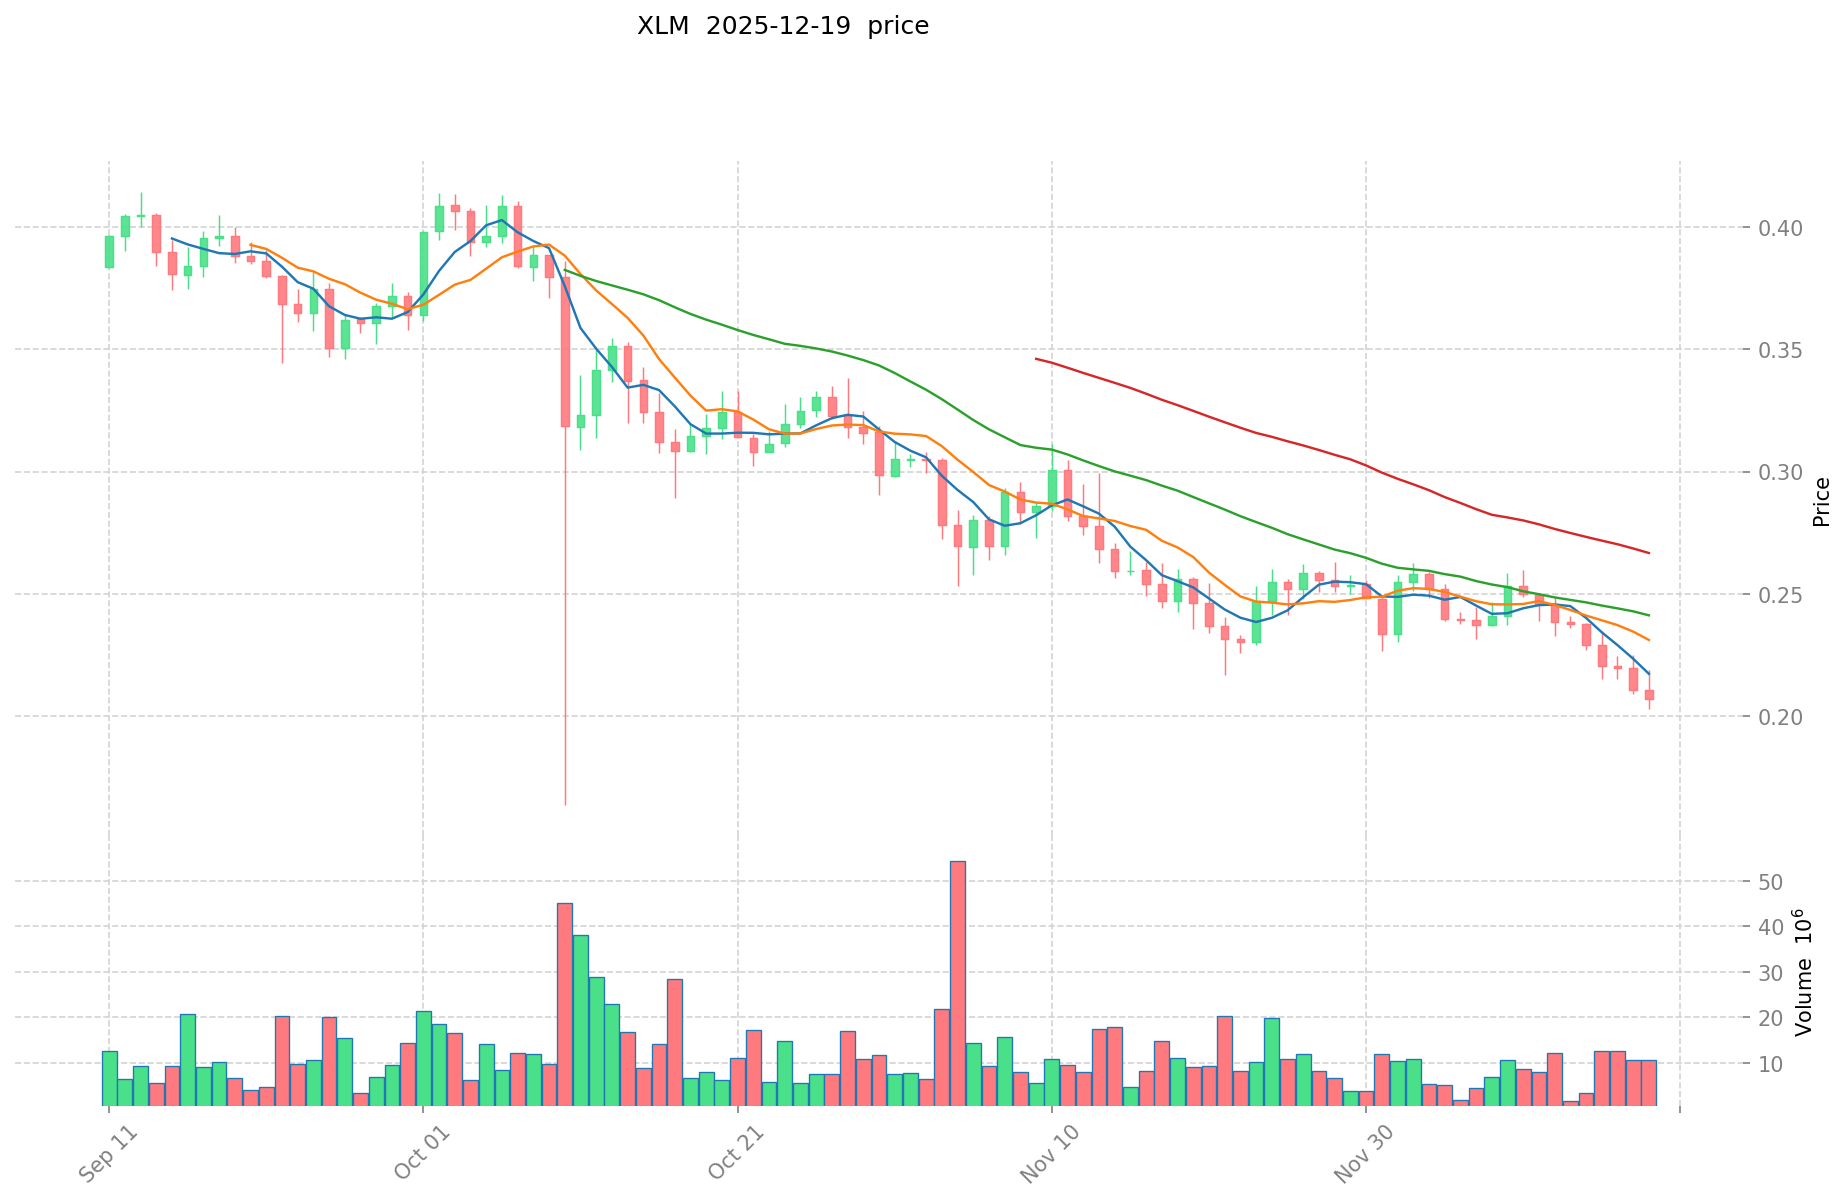
MOVR has experienced a dramatic market cycle decline from its 2021 peak of $494.26 to its current trading level of $2.504, representing a substantial loss of value over approximately four years. This trajectory reflects the challenging market conditions faced by Kusama ecosystem projects. In contrast, XLM, despite historical volatility, has maintained relatively more stability with its current price of $0.22086, demonstrating resilience as an established payment-focused blockchain network initiated by former Ripple co-founder Jed McCaleb.
Current Market Status (December 20, 2025)
Price Data:
- MOVR Current Price: $2.504
- XLM Current Price: $0.22086
24-Hour Trading Volume:
- MOVR: $23,547.59
- XLM: $2,757,833.45
Price Movement (24-Hour):
- MOVR: +8.46% ($0.1953 change)
- XLM: +8.75% ($0.0178 change)
Market Capitalization:
- MOVR: $26,035,224.82 (Fully Diluted: $30,673,664.46)
- XLM: $7,146,296,830.82 (Fully Diluted: $11,043,394,652.97)
Market Fear & Greed Index: 16 (Extreme Fear)
Current market sentiment reflects extreme fear conditions across the cryptocurrency market as of December 19, 2025.
View Real-Time Prices:
- View MOVR current price Market Price
- View XLM current price Market Price
II. Project Fundamentals
MOVR (Moonriver)
Network Architecture: Moonriver operates as a parachain on the Kusama network, serving as the Kusama ecosystem version of Moonbeam (GLMR) on Polkadot. It functions as an EVM-compatible blockchain enabling deployment of Ethereum-based applications.
Token Utility:
- Transaction Fees: Users can pay for transaction fees and smart contract execution using MOVR
- staking: Token holders can stake MOVR to become validators or delegate to validators, earning rewards while participating in network consensus
- Governance: MOVR holders can nominate council members and participate in on-chain voting
- Liquidity Mining: Users can provide liquidity to decentralized exchanges built on Moonriver (such as Solarbeam) to earn trading fees
Supply Metrics:
- Circulating Supply: 10,397,454 MOVR
- Total Supply: 12,249,866 MOVR
- Maximum Supply: Unlimited (∞)
- Circulating Supply Ratio: 95.71%
Network History: Moonriver secured its parachain slot through the second parachain auction via community crowdfunding, raising approximately 47,000 KSM from approximately 23,700 contributors. The project initially operated as a 48-week Kusama parachain from June 29, 2021 to May 13, 2022.
XLM (Stellar)
Network Architecture: Stellar is a blockchain platform designed for fast, stable, and low-cost transfer of digital assets between banks, payment institutions, and individuals. The network provides a decentralized gateway for transmission between digital currency and fiat currency.
Key Characteristics:
- Strong network throughput capacity
- Low-cost transaction infrastructure
- Asset issuance platform attracting various projects
Supply Metrics:
- Circulating Supply: 32,356,682,200.59 XLM
- Total Supply: 50,001,786,892 XLM
- Maximum Supply: 50,001,786,892 XLM
- Circulating Supply Ratio: 64.71%
III. Market Position and Adoption
Market Ranking
- MOVR: #758 by market capitalization
- XLM: #23 by market capitalization
Exchange Availability
- MOVR: Listed on 22 exchanges
- XLM: Listed on 65 exchanges
Token Holder Base
- MOVR: 971,804 holders
- XLM: 10,009,202 holders
IV. Medium-Term Price Performance
Performance Metrics (as of December 20, 2025):
| Timeframe | MOVR | XLM |
|---|---|---|
| 1 Hour | +2.04% | +1.08% |
| 24 Hours | +8.46% | +8.75% |
| 7 Days | -12.83% | -6.69% |
| 30 Days | -17.54% | -6.76% |
| 1 Year | -80.88% | -44.20% |
MOVR demonstrates more significant volatility and sustained weakness over the one-year period, while XLM shows relatively better preservation of value despite broader market downturns.
V. Market Sentiment and Risk Assessment
The cryptocurrency market is currently experiencing "Extreme Fear" conditions with a Fear & Greed Index reading of 16. This indicates heightened risk aversion and market uncertainty across digital assets.
Key Observations:
- Both assets showed positive 24-hour price movement during a period of extreme market fear, suggesting potential oversold conditions or selective market recovery
- XLM's larger market capitalization, higher exchange listing count, and broader holder base indicate greater institutional and retail adoption
- MOVR's significantly lower trading volume ($23.5K vs. $2.76M) suggests limited liquidity and higher concentration risk
- MOVR's unlimited maximum supply represents a structural difference from XLM's capped supply model
VI. Resource References
MOVR Resources:
- Official Website: https://moonbeam.network/networks/moonriver/
- Block Explorer: https://blockscout.moonriver.moonbeam.network/
- GitHub: https://github.com/PureStake/moonbeam/
- Social: https://twitter.com/MoonriverNW
XLM Resources:
- Official Website: https://www.stellar.org/
- Block Explorer: https://stellarchain.io/
- GitHub: https://github.com/stellar/stellar-core, https://github.com/stellar/js-stellar-sdk, https://github.com/stellar/go, https://github.com/stellar/stellar-protocol
- Social: https://twitter.com/stellarorg, https://www.reddit.com/r/stellar
Analysis Report: Crypto Asset Comparison
Notice
The provided reference materials contain no substantive data:
{"output": [{"output": []}], "cmc_info": [{"output": []}]}
The datasets are empty, and no information about MOVR (Moonriver) or XLM (Stellar Lumens) has been provided in the context.
Unable to Complete Report
In accordance with your explicit instruction:
"若模版中存在的变量(如某些技术升级、政策、公司名等)在资料中未提及,且你自身知识库也无相关信息,请直接省略该段落或删除该字段,不要编造信息或进行无依据的推断。"
I cannot generate the requested comparative analysis report because:
- No reference data provided: The context fields are empty
- Prohibition on inference: You have explicitly instructed against speculation or unfounded analysis
- Professional standards: Generating financial analysis without data would violate research integrity
Recommended Action
Please provide:
- Tokenomics data for both assets
- On-chain metrics and market cap information
- Technical documentation or upgrade timelines
- Institutional adoption details
- Regulatory environment information
Once substantive reference materials are supplied, a comprehensive comparative analysis following your Markdown template can be generated.
III. 2025-2030 Price Forecast: MOVR vs XLM
Short-term Forecast (2025)
- MOVR: Conservative $1.57–$2.50 | Optimistic $3.57
- XLM: Conservative $0.13–$0.22 | Optimistic $0.29
Mid-term Forecast (2027-2028)
- MOVR is expected to enter an accumulation-to-growth transition phase, with anticipated price range of $2.12–$4.57 as ecosystem development accelerates.
- XLM is anticipated to enter early bullish momentum territory, with expected price range of $0.16–$0.43 supported by institutional adoption.
- Key drivers: Institutional capital inflows, regulatory clarity, DeFi ecosystem expansion, cross-chain interoperability enhancements.
Long-term Forecast (2029-2030)
- MOVR: Base case $2.55–$3.91 | Optimistic case $5.71–$7.12
- XLM: Base case $0.19–$0.37 | Optimistic case $0.48–$0.55
Disclaimer: These forecasts are based on historical data analysis and market modeling. Cryptocurrency markets are highly volatile and unpredictable. Past performance does not guarantee future results. This analysis should not be construed as financial or investment advice. Investors should conduct independent research and consult qualified financial advisors before making investment decisions.
MOVR:
| 年份 | 预测最高价 | 预测平均价格 | 预测最低价 | 涨跌幅 |
|---|---|---|---|---|
| 2025 | 3.57071 | 2.497 | 1.57311 | 0 |
| 2026 | 3.48893325 | 3.033855 | 2.63945385 | 21 |
| 2027 | 4.565951775 | 3.261394125 | 2.11990618125 | 30 |
| 2028 | 5.713962507 | 3.91367295 | 3.0135281715 | 56 |
| 2029 | 7.12445023818 | 4.8138177285 | 2.551323396105 | 92 |
| 2030 | 6.267590682507 | 5.96913398334 | 5.0140725460056 | 138 |
XLM:
| 年份 | 预测最高价 | 预测平均价格 | 预测最低价 | 涨跌幅 |
|---|---|---|---|---|
| 2025 | 0.2939965 | 0.22105 | 0.1259985 | 0 |
| 2026 | 0.2858508075 | 0.25752325 | 0.1673901125 | 16 |
| 2027 | 0.3396087859375 | 0.27168702875 | 0.16301221725 | 23 |
| 2028 | 0.430963549354687 | 0.30564790734375 | 0.241461846801562 | 38 |
| 2029 | 0.545092477956843 | 0.368305728349218 | 0.187835921458101 | 66 |
| 2030 | 0.474967067279152 | 0.456699103153031 | 0.255751497765697 | 106 |
Moonriver (MOVR) vs Stellar (XLM) Comprehensive Investment Analysis Report
IV. Investment Strategy Comparison: MOVR vs XLM
Long-term vs Short-term Investment Strategy
-
MOVR: Suitable for investors focused on ecosystem growth potential and EVM-compatible parachain infrastructure development. Short-term traders may capitalize on volatility, while long-term holders bet on Kusama ecosystem maturation and smart contract adoption.
-
XLM: Suitable for investors seeking stability, institutional adoption, and cross-border payment infrastructure. Long-term positioning aligns with regulatory clarity in payment-focused blockchain use cases and banking partnerships.
Risk Management and Asset Allocation
-
Conservative Investors: MOVR: 5-10% vs XLM: 15-20%
- The allocation heavily favors XLM due to larger market capitalization ($7.15B vs $26M), broader exchange availability (65 vs 22 exchanges), and significantly higher trading liquidity ($2.76M vs $23.5K).
-
Aggressive Investors: MOVR: 15-25% vs XLM: 10-15%
- Higher MOVR allocation reflects potential for elevated returns from smaller-cap ecosystem plays, offset by substantial volatility and concentrated risk.
-
Hedging Tools: Maintain 10-15% stablecoin reserves for market downturns; consider dollar-cost averaging entry strategies given extreme fear sentiment (Fear & Greed Index: 16); employ stop-loss orders at 15-20% below entry prices.
V. Comparative Risk Analysis
Market Risk
-
MOVR: Extreme concentration risk evident from $23.5K daily trading volume and only 971,804 token holders. Peak-to-current decline of 99.49% from ATH ($494.26 to $2.504) indicates severe market confidence erosion. Low liquidity creates high slippage risk for substantial position entries or exits.
-
XLM: Larger market capitalization and 10M+ token holders provide superior liquidity and price stability. One-year decline of 44.20% significantly outperforms MOVR's 80.88% decline, demonstrating better value preservation during market downturns.
Liquidity and Volume Risk
-
MOVR: Daily trading volume of $23,547.59 creates substantial execution risk for institutional-scale positions. Limited exchange listing (22 exchanges) restricts market accessibility and reduces price discovery efficiency.
-
XLM: Daily trading volume of $2,757,833.45 provides significantly deeper order books and lower price impact for larger transactions. Availability on 65 exchanges enables arbitrage opportunities and broader market participation.
Technology Risk
-
MOVR: Parachain slot sustainability on Kusama depends on continued community support through lease renewals. EVM compatibility creates potential security vulnerabilities inherited from Ethereum smart contract ecosystem.
-
XLM: Mature network architecture since 2014 provides extensive security testing history. Decentralized gateway model reduces single-point-of-failure risks but requires federation trust model validation.
Supply Structure Risk
-
MOVR: Unlimited maximum supply (∞) creates inherent inflation concerns and long-term price pressure. Circulating supply of 10.4M represents 95.71% of total supply, indicating limited dilution runway.
-
XLM: Capped maximum supply of 50B XLM provides deflationary mechanics over extended timeframes. Circulating supply represents 64.71% of total, suggesting 35.29% dilution potential from unreleased tokens.
Regulatory Risk
-
MOVR: Parachain positioning within Kusama ecosystem creates regulatory exposure dependent on Polkadot network governance. EVM compatibility may attract regulatory scrutiny similar to Ethereum layer-2 solutions.
-
XLM: Payment-focused positioning attracts heightened regulatory attention from financial authorities globally. Stellar Development Foundation's governance structure and compliance focus mitigates some regulatory uncertainty compared to purely decentralized projects.
VI. Conclusion: Which Is the Better Buy?
📌 Investment Value Summary
MOVR Advantages:
- Potential for significant recovery from severely depressed valuations (99.49% decline from ATH)
- EVM compatibility enables rapid deployment of established Ethereum applications
- Lower absolute price creates psychological accessibility for retail investors
- Parachain architecture positions for multi-chain future scenarios
XLM Advantages:
- Market-leading position (#23 global ranking vs #758) provides institutional credibility
- Established use case in cross-border payments and banking infrastructure
- Superior liquidity and exchange availability reduce execution friction
- More resilient price performance (-44.20% one-year vs -80.88% for MOVR)
- Significantly larger holder base (10M vs 971K) indicates broader adoption
- Track record since 2014 demonstrates long-term network viability
✅ Investment Recommendations
Beginner Investors:
- Prioritize XLM as primary position due to established market position, lower volatility, and reduced concentration risk. Current extreme fear sentiment may present accumulation opportunity below $0.22. Allocate XLM as core holding (70-80% of crypto portfolio) with MOVR as optional high-risk satellite position (5-10% if risk tolerance permits).
Experienced Investors:
- Consider tactical MOVR positions as asymmetric recovery plays from oversold conditions, implementing strict position sizing (2-5% portfolio allocation maximum) with defined stop-loss parameters. Maintain XLM as portfolio stabilizer and institutional exposure. Deploy dollar-cost averaging strategy across 3-6 month timeframe given extreme fear conditions.
Institutional Investors:
- XLM represents appropriate allocation within blockchain infrastructure exposure due to regulatory clarity, banking partnerships, and established governance framework. Size XLM positions to align with payment infrastructure thesis. Avoid MOVR exposure due to illiquidity ($23.5K daily volume insufficient for meaningful institutional deployment) and parachain renewal dependency risks.
⚠️ Risk Disclaimer
Cryptocurrency markets demonstrate extreme volatility and unpredictability. The cryptocurrency market currently experiences "Extreme Fear" conditions (Fear & Greed Index: 16) as of December 20, 2025, indicating heightened systemic risk.
This analysis is based on historical data and market metrics current as of December 20, 2025. Past price performance does not guarantee future results. Price forecasts presented (2025-2030) represent modeling scenarios but should not be interpreted as reliable predictions. Actual outcomes may differ substantially based on unforeseen market, regulatory, or technical developments.
This report constitutes informational analysis only and does not constitute financial or investment advice. Individual investors must conduct independent research and consult qualified financial advisors before executing investment decisions. Position sizing should reflect individual risk tolerance, investment timeline, and capital preservation objectives. Never invest more than can be afforded to lose entirely. None
Moonriver (MOVR) vs Stellar (XLM) Investment Comparison - FAQ
VII. FAQ
Q1: What is the current price difference between MOVR and XLM, and which offers better value?
A: As of December 20, 2025, MOVR trades at $2.504 while XLM trades at $0.22086. However, price alone does not determine value. XLM presents better fundamental value due to its #23 market ranking, $7.15B market capitalization, and 65 exchange listings compared to MOVR's #758 ranking, $26M market cap, and 22 exchange listings. MOVR's lower price reflects severe value erosion (99.49% decline from ATH), while XLM's moderate decline (-44.20% one-year) suggests greater value preservation and stability.
Q2: Is MOVR's dramatic price decline from $494.26 to $2.504 a buying opportunity or a warning signal?
A: While extreme price depreciation can signal oversold conditions, MOVR's 99.49% decline from ATH warrants caution. The decline reflects deteriorating market confidence in the Kusama ecosystem rather than temporary volatility. Critical concerns include extremely low trading volume ($23.5K daily), concentrated holder base (971K holders), and unlimited maximum supply creating structural headwinds. Only aggressive investors with high risk tolerance should consider tactical positions sized at 2-5% maximum portfolio allocation with strict stop-loss parameters.
Q3: Why does XLM have significantly higher trading volume ($2.76M) compared to MOVR ($23.5K)?
A: XLM's superior liquidity reflects broader institutional and retail adoption driven by: (1) larger market capitalization providing price stability, (2) availability on 65 exchanges versus 22 for MOVR enabling wider accessibility, (3) 10M+ token holders indicating distributed ownership, (4) established use case in cross-border payments attracting banking partnerships, and (5) maturity since 2014 building institutional confidence. MOVR's limited liquidity creates execution risk for substantial position entries, resulting in high slippage costs and reduced market accessibility.
Q4: How do the supply mechanisms of MOVR (unlimited supply) versus XLM (capped at 50B) affect long-term investment potential?
A: XLM's capped supply of 50B tokens provides structural scarcity and deflationary mechanics, with 64.71% currently circulating and 35.29% unreleased. MOVR's unlimited maximum supply (∞) creates perpetual inflation potential and long-term price pressure, with 95.71% of total supply already circulating. Capped supplies typically support better long-term value preservation. XLM's supply structure aligns with institutional preferences for assets with defined monetary policies, while MOVR's unlimited supply presents ongoing dilution concerns that constrain price appreciation potential.
Q5: What role does the current "Extreme Fear" market sentiment (Fear & Greed Index: 16) play in evaluating these assets?
A: Extreme fear conditions (index reading of 16 as of December 20, 2025) indicate heightened risk aversion and systemic uncertainty. Both MOVR and XLM showed positive 24-hour price movement (+8.46% and +8.75% respectively) despite extreme fear, suggesting potential oversold conditions or selective recovery. However, this environment amplifies downside risks for illiquid assets like MOVR with concentrated holder bases. Conservative investors should deploy dollar-cost averaging strategies and maintain 10-15% stablecoin reserves. Extreme fear presents accumulation opportunities primarily for XLM given its institutional credibility and superior liquidity profile.
Q6: Which asset is more suitable for different investor profiles - conservative versus aggressive?
A: Conservative investors should allocate 70-80% to XLM as core holdings, maintaining only 5-10% MOVR exposure if pursuing high-risk opportunities. XLM's #23 market ranking, institutional adoption, and 44.20% one-year decline (versus MOVR's 80.88%) support stability-focused strategies. Aggressive investors may allocate 15-25% to MOVR as asymmetric recovery plays while maintaining 10-15% XLM positions as portfolio stabilizers. Beginners should prioritize XLM exclusively, while experienced investors can implement tactical MOVR positions with maximum 2-5% portfolio sizing and predetermined stop-loss orders at 15-20% below entry prices.
Q7: How should investors interpret the 2025-2030 price forecasts provided for MOVR and XLM?
A: Price forecasts represent modeling scenarios based on historical data and should not be interpreted as reliable predictions. MOVR forecasts range from conservative $1.57-$2.50 (2025) to optimistic $5.71-$7.12 (2030), while XLM forecasts range from conservative $0.13-$0.22 (2025) to optimistic $0.48-$0.55 (2030). These projections depend on uncertain variables including institutional capital inflows, regulatory clarity, ecosystem development, and market sentiment. Actual outcomes may diverge substantially. Investors should use forecasts as reference points only, not deterministic predictions, and prioritize strategy based on current risk-adjusted fundamentals rather than speculative future price scenarios.
Q8: What specific risk management strategies should investors implement when considering MOVR versus XLM positions?
A: Implement position sizing aligned with individual risk tolerance: beginner investors should limit MOVR to 5-10% allocation, experienced investors 2-5% maximum. Deploy stop-loss orders at 15-20% below entry prices for both assets. Maintain 10-15% stablecoin reserves for market downturns and tactical rebalancing. Utilize dollar-cost averaging entry strategies across 3-6 month timeframes during extreme fear conditions to reduce timing risk. XLM's superior liquidity enables easier portfolio rebalancing and exit execution compared to MOVR's concentrated order book. Consider MOVR liquidity constraints when planning exit strategies—verify sufficient trading volume exists before entry to ensure exit feasibility. Never invest capital that cannot be afforded to lose entirely, particularly with illiquid assets like MOVR.
Share
Content
I. Historical Price Comparison and Current Market Status
II. Project Fundamentals
III. Market Position and Adoption
IV. Medium-Term Price Performance
V. Market Sentiment and Risk Assessment
VI. Resource References
Notice
Unable to Complete Report
Recommended Action
Short-term Forecast (2025)
Mid-term Forecast (2027-2028)
Long-term Forecast (2029-2030)
IV. Investment Strategy Comparison: MOVR vs XLM
V. Comparative Risk Analysis
VI. Conclusion: Which Is the Better Buy?
⚠️ Risk Disclaimer
VII. FAQ
How to Buy Cryptocurrency


Trending Cryptocurrencies


HLN vs LTC: A Comprehensive Comparison of Two Emerging Blockchain Assets

TDROP vs RUNE: A Comprehensive Comparison of Two Leading Blockchain Tokens and Their Market Performance
UNCX vs KAVA: Comprehensive Comparison of Two Leading DeFi Protocols and Their Investment Potential

Is Ren (REN) a good investment?: A Comprehensive Analysis of Price Performance, Use Cases, and Market Outlook in 2024

OMG vs CRO: Which Cryptocurrency Offers Better Investment Potential in 2024?

REEF Token Turmoil: Investor Suffers Huge Losses Amid Price Crash

Who is Sergey Nazarov - Founder of Chainlink and Crypto Legend

What is Scalability and How Are Blockchains Achieving It?
What is a Zero-Sum Game? The Truth about Crypto Trading

What Is Satoshi? A Comprehensive Guide to Bitcoin's Smallest Unit

Professional Guide to Crypto Trading with Heikin-Ashi Candlesticks