


Ngày 29 tháng 04 năm 2026, Công ty Samsung Electronics (mã chứng khoán: 005930.KS) đã công bố báo cáo tài chính quý với những con số có thể định hình lại lịch sử thành tích doanh nghiệp Hàn Quốc.
Doanh thu hợp nhất đạt 133,87 nghìn tỷ KRW (khoảng 90,1 tỷ USD), tăng 69,2% so với cùng kỳ năm trước và 42,7% so với quý liền trước, thiết lập kỷ lục mới về doanh thu trong một quý. Lợi nhuận hoạt động đạt 57,23 nghìn tỷ KRW (tương đương 38,4 tỷ USD), tăng vọt 756,1% so với cùng kỳ và 185,1% so với quý trước, dễ dàng vượt qua cả dự báo nội bộ lẫn kỳ vọng thị trường là 55,28 nghìn tỷ KRW.
Để dễ hình dung: Tổng lợi nhuận hoạt động của Samsung trong cả năm 2025 là 43,6 nghìn tỷ KRW. Điều này có nghĩa là chỉ trong một quý của năm 2026, Samsung đã vượt qua tổng lợi nhuận của cả năm trước đó.
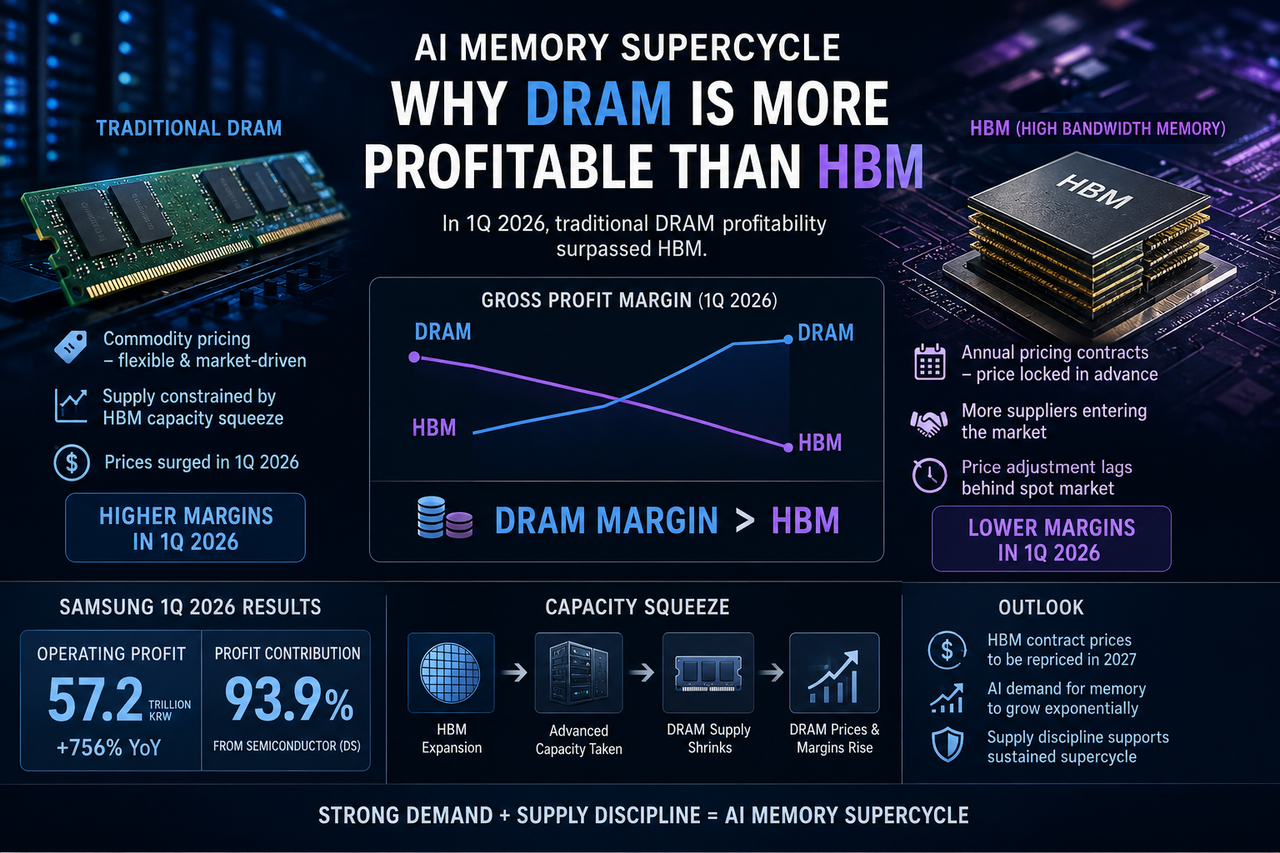
Trong cơ cấu lợi nhuận, bộ phận Device Solutions (DS) – phụ trách mảng bán dẫn – nổi lên là động lực lợi nhuận tuyệt đối. DS ghi nhận lợi nhuận hoạt động 53,7 nghìn tỷ KRW trong quý, chiếm khoảng 93,9% tổng lợi nhuận hoạt động của công ty – tăng mạnh so với chỉ 1,1 nghìn tỷ KRW cùng kỳ năm ngoái. Biên lợi nhuận hoạt động của DS đạt khoảng 65,7%, trở thành động lực chính giúp biên lợi nhuận hoạt động toàn tập đoàn tăng vọt lên khoảng 42,8%.
Ngay sau báo cáo tài chính, nhiều ngân hàng đầu tư quốc tế đã nhanh chóng nâng giá mục tiêu. Goldman Sachs nâng giá mục tiêu cho mã 005930 từ 205.000 KRW lên 260.000 KRW, giữ nguyên khuyến nghị "Mua vào". Citi, ngày 12 tháng 05, nâng giá mục tiêu từ 300.000 KRW lên 460.000 KRW và đưa cổ phiếu vào danh sách theo dõi động lực tăng giá trong 90 ngày. Nomura thậm chí còn mạnh tay hơn, nâng giá mục tiêu từ 340.000 KRW lên 590.000 KRW vào ngày 18 tháng 05.
Tuy nhiên, điều thực sự khiến thị trường phải suy ngẫm không phải là các con số tài chính đã phản ánh đầy đủ vào giá, mà là một phát biểu bình thản của ban lãnh đạo trong buổi họp công bố kết quả kinh doanh: Ở thời điểm hiện tại, DRAM truyền thống thực tế còn có lợi nhuận cao hơn cả HBM.
Nhận định này đi ngược hoàn toàn với giả định phổ biến trên thị trường. Trong câu chuyện về "siêu chu kỳ bộ nhớ AI", HBM được xem là phân khúc có lợi nhuận và rào cản cao nhất. Vậy tại sao ban lãnh đạo lại phát đi tín hiệu "nghịch lý" như vậy trong một quý lập kỷ lục? Lý do kinh doanh phía sau phức tạp hơn nhiều so với những con số tài chính đơn thuần.
Cấu Trúc Lợi Nhuận "Nghịch Lý"
Việc DRAM truyền thống có lợi nhuận cao hơn HBM không chỉ là quan điểm riêng của Samsung – mà còn được củng cố bởi dữ liệu ngành rõ ràng.
Theo báo cáo mới nhất của công ty nghiên cứu bán dẫn TrendForce công bố ngày 27 tháng 05 năm 2026, do cơ chế định giá theo năm và các yếu tố khác, giá trị tấm wafer và biên lợi nhuận của HBM đã bị DDR5 RDIMM vượt qua trong quý 1 năm 2026. TrendForce từng ghi nhận từ tháng 01 rằng giá bán và biên lợi nhuận trên mỗi đơn vị DRAM máy chủ đã vượt HBM, trở thành mặt hàng sinh lời nhất.
Cụ thể, chu kỳ định giá của HBM có cấu trúc khác biệt so với DRAM tiêu chuẩn. Hợp đồng HBM thường được thương thảo theo năm, thời gian khóa giá dài và điều chỉnh giá chậm hơn thị trường giao ngay. Trong khi đó, DRAM truyền thống (như DDR5) sử dụng cơ chế phát hiện giá linh hoạt hơn, phản ánh nhanh biến động cung cầu và đà tăng giá.
Dữ liệu giá cả càng làm nổi bật sự tương phản này. Trong quý 1 năm 2026, giá hợp đồng DRAM phổ thông tăng mạnh 90% đến 95% so với quý trước, còn giá NAND Flash tăng 55% đến 60%. Khi HBM mở rộng sản xuất quy mô lớn, phần lớn năng lực sản xuất bị chiếm dụng, nguồn cung DRAM truyền thống co lại nhanh hơn tốc độ tăng trưởng nhu cầu, tạo ra vòng xoáy tích cực: khan hiếm đẩy giá lên cao, giá cao lại thúc đẩy lợi nhuận tăng mạnh.
Hiệu suất thị trường DRAM toàn cầu cũng xác nhận xu hướng này. Theo dữ liệu Counterpoint Research công bố ngày 27 tháng 05 năm 2026, doanh thu DRAM toàn cầu trong quý 1 tăng vọt 80% so với quý trước và 260% so với cùng kỳ, đạt mức kỷ lục 97 tỷ USD – chỉ còn cách mốc 100 tỷ USD trong một quý. Samsung duy trì vị trí dẫn đầu với 38% thị phần doanh thu DRAM toàn cầu.
Ẩn sau biên lợi nhuận đảo ngược này là logic về năng lực sản xuất: hiệu ứng "thắt chặt công suất". Kích thước die của HBM lớn hơn đáng kể so với DRAM tiêu chuẩn cùng loại, tiêu tốn nhiều năng lực sản xuất wafer hơn. Khi sản lượng HBM tăng mạnh, phần lớn công suất quy trình tiên tiến bị chiếm dụng, khiến nguồn cung DRAM truyền thống thực tế bị thu hẹp. Sự kết hợp giữa mất cân đối cung cầu và cơ chế định giá linh hoạt cuối cùng cho phép DRAM truyền thống vượt qua HBM – vốn có giá bán cứng nhắc hơn – về lợi nhuận biên.
Phân Khúc HBM: Thực Tế Cạnh Tranh Dưới "Hào Quang"
Để lý giải nghịch lý lợi nhuận giữa DRAM truyền thống và HBM, cần nhìn vào cục diện cạnh tranh trên thị trường HBM.
Với thế hệ HBM4 then chốt, Samsung đã đạt được cột mốc sản xuất hàng loạt và giao hàng thương mại đầu tiên trên thế giới vào tháng 02 năm 2026. Công ty kỳ vọng doanh số HBM năm 2026 sẽ gấp hơn ba lần năm trước, với doanh thu HBM4 chiếm trên 50% tổng doanh thu HBM từ quý 3.
Về công nghệ, Samsung đẩy nhanh phát triển HBM4E. Tại hội nghị GTC tháng 03 năm 2026, Samsung đã trình diễn mẫu vật lý HBM4E, tốc độ mỗi chân đạt 16 Gbps, tổng băng thông vượt 4,0 TB/s – cao hơn khoảng 21% so với HBM4. Lô mẫu kỹ thuật HBM4E đầu tiên đã bắt đầu sản xuất trong quý 2, ưu tiên giao cho các khách hàng lớn kiểm thử ở cấp hệ thống.
Tuy nhiên, dữ liệu thị phần lại cho thấy bức tranh khác. TrendForce ước tính SK Hynix sẽ chiếm khoảng 50% thị phần HBM năm 2026, Micron tăng lên 28%. Xếp hạng doanh thu DRAM toàn cầu của Counterpoint Research cho thấy Samsung dẫn đầu với 38%, tiếp theo là SK Hynix 29% và Micron 22%.
Dù Samsung có lợi thế thời điểm với HBM4 sản xuất hàng loạt đầu tiên, SK Hynix vẫn giữ ưu thế phân bổ nguồn cung nhờ quan hệ đối tác lâu năm với NVIDIA trong lĩnh vực HBM. "Rào cản người đi trước" này không chỉ đến từ thông số kỹ thuật, mà còn là kết quả của chu kỳ kiểm định kéo dài, lịch sử đồng phát triển sản phẩm và niềm tin chuỗi cung ứng tích lũy. Việc Samsung có thể bứt phá trong HBM4 và các thế hệ tiếp theo hay không phụ thuộc vào khả năng chuyển hóa vị thế dẫn đầu sản xuất hàng loạt thành thị phần cung ứng thực tế cho khách hàng, đồng thời duy trì tiến độ công nghệ.
Cuộc Chiến Quyền Lực Định Giá: Lợi Nhuận HBM Bị "Trễ Nhịp" Do Hợp Đồng Năm
Báo cáo tháng 05 năm 2026 của TrendForce chỉ ra mâu thuẫn cốt lõi trong cơ chế định giá HBM: Hợp đồng HBM năm 2026 sử dụng khung giá cố định theo năm, được khóa từ tận nửa cuối năm 2025. Khi thị trường DRAM bước vào giai đoạn thiếu hụt nghiêm trọng do nhu cầu AI tăng vọt trong quý 1 năm 2026, giá hợp đồng HBM vẫn "đóng băng" ở mức thấp, không thể tăng cùng nhịp với DRAM tiêu chuẩn.
Bên cạnh đó, năm 2026 chứng kiến nhiều nhà cung cấp mới chính thức gia nhập thị trường HBM, làm tăng nguồn cung và trao thêm quyền mặc cả cho bên mua trong đàm phán hợp đồng, càng hạn chế dư địa tăng giá HBM trong ngắn hạn.
Cơ chế định giá bị trễ này đã khiến các nhà cung cấp phản ứng mạnh. TrendForce cho biết khi đàm phán hợp đồng HBM4 năm 2027 khởi động từ quý 2 năm 2026, các nhà sản xuất sẽ nâng giá HBM đáng kể để phản ánh sự mất cân đối cung cầu và chi phí sản xuất thế hệ mới. Lợi nhuận DRAM truyền thống tăng mạnh giúp các nhà cung cấp có vị thế thương lượng tốt hơn – nếu lợi nhuận HBM tiếp tục thấp hơn sản phẩm truyền thống, các nhà sản xuất không có động lực kinh tế để mở rộng sản lượng HBM, buộc bên mua phải chấp nhận giá hợp đồng HBM cao hơn.
Chiến lược của SK Hynix có sự khác biệt. Theo TrendForce, khi giá RDIMM vượt HBM, SK Hynix tuyên bố "không theo đuổi lợi nhuận ngắn hạn mà hướng tới phát triển cân bằng dài hạn giữa HBM và DRAM truyền thống". Quan điểm này cho thấy Samsung và SK Hynix có thể đang tách biệt về chiến lược phân bổ công suất: Samsung dường như ưu tiên tối đa hóa lợi nhuận ngắn hạn từ DRAM truyền thống sinh lời cao, trong khi SK Hynix tập trung củng cố vị thế cung ứng lâu dài của HBM.
Đình Công Tháng 05/2026: Rủi Ro Nguồn Cung Trong Siêu Chu Kỳ
Trong bối cảnh công suất đã căng thẳng, Samsung Electronics còn đối mặt với cuộc xung đột lao động lớn nhất lịch sử vào tháng 05 năm 2026. Nghiệp đoàn Quốc gia Samsung Electronics công bố kế hoạch đình công toàn diện kéo dài 18 ngày, yêu cầu phân bổ 15% lợi nhuận hoạt động hàng năm vào quỹ thưởng nhân viên, trong khi ban lãnh đạo chỉ đồng ý 10% và từ chối cam kết duy trì chế độ thưởng này lâu dài.
Ngày 18 tháng 05, Tòa án quận Suwon đã chấp thuận một phần yêu cầu của Samsung, buộc phải duy trì nhân sự và công việc liên quan đến an toàn trong thời gian đình công, đồng thời không để vật tư sản xuất bị hư hỏng. Mọi vi phạm sẽ bị phạt 300 triệu KRW mỗi ngày. Quá trình hòa giải lao động đổ vỡ ngày 20 tháng 05, nhưng hai bên cuối cùng cũng đạt được thỏa thuận tạm thời về lương vào cuối tháng. Sau cuộc bỏ phiếu toàn nghiệp đoàn, 73,7% thành viên đồng ý với thỏa thuận, giúp tránh được cuộc đình công quy mô lớn dự kiến.
Nguyên nhân sâu xa của cuộc đình công xuất phát từ sự bất cân xứng trong phân chia lợi ích giữa siêu chu kỳ AI. Lợi nhuận hoạt động của Samsung tăng 756% trong quý 1, nhưng nhân viên bộ phận chip cho rằng họ không được hưởng phần tương xứng từ "cơn sốt" lợi nhuận do AI mang lại. Trong khi đó, SK Hynix đã đạt thỏa thuận với nghiệp đoàn từ tháng 09 năm 2025, bãi bỏ trần thưởng cũ (tối đa 1.000% lương cơ bản) và phân bổ 10% lợi nhuận hoạt động hàng năm vào quỹ thưởng cho toàn bộ nhân viên, áp dụng trong 10 năm. Ước tính nhân viên SK Hynix có thể nhận thưởng 600 triệu đến 700 triệu KRW trong năm 2026, còn nhân viên bộ phận chip Samsung cùng vị trí chỉ nhận chưa tới một phần ba. Khoảng cách thu nhập này đã khiến khoảng 200 kỹ sư chủ chốt của Samsung chuyển sang SK Hynix trong vài tháng gần đây.
Xét trên toàn ngành, bất kỳ cuộc đình công tiếp theo nào làm gián đoạn sản xuất đều sẽ tác động dây chuyền lên chuỗi cung ứng bán dẫn toàn cầu. JPMorgan ước tính đình công kéo dài tại Samsung có thể khiến lợi nhuận hoạt động năm 2026 giảm 2,1 đến 3,5 nghìn tỷ KRW, doanh thu bộ phận bán dẫn giảm 1% đến 2%. KB Securities (Hàn Quốc) dự báo nếu chỉ 30% đến 40% thành viên nghiệp đoàn tham gia, có thể làm gián đoạn khoảng 3% đến 4% nguồn cung DRAM toàn cầu. Trong bối cảnh cung cầu ngày càng căng thẳng, bất kỳ tổn thất thực tế nào về công suất cũng sẽ tiếp tục đẩy giá chip nhớ tăng cao.
Ba Tầng Cấu Trúc Của Siêu Chu Kỳ
Tổng hợp các yếu tố trên, có thể nhận diện rõ cấu trúc ba tầng của siêu chu kỳ bộ nhớ AI hiện nay:
Tầng một: Động lực cầu mang tính cấu trúc. Khác với các đợt phục hồi ngắn hạn do chu kỳ nâng cấp thiết bị điện tử tiêu dùng trước đây, đợt tăng trưởng này xuất phát từ nhu cầu bộ nhớ được đánh giá lại về mặt cấu trúc, đến từ đào tạo AI, suy luận và mở rộng trung tâm dữ liệu quy mô lớn. Chứng khoán Nomura nhận định khi nhu cầu bán dẫn AI chuyển từ khối lượng đào tạo sang khối lượng suy luận, nhu cầu bộ nhớ sẽ bước vào giai đoạn tăng trưởng theo hàm mũ. Nhu cầu bộ nhớ KV-cache trong các kịch bản suy luận là hàm bội số của lượng người dùng, thời gian tương tác, độ phức tạp tác vụ AI và số token tiêu thụ – nghĩa là nhu cầu bộ nhớ có thể tăng gấp hàng nghìn lần trong 5 năm tới.
Tầng hai: Thắt chặt công suất và độ cứng nguồn cung. Việc mở rộng HBM quy mô lớn đang chiếm dụng phần lớn năng lực sản xuất wafer tiên tiến, trực tiếp bóp nghẹt nguồn cung DRAM truyền thống. Sau giai đoạn suy thoái trước, các nhà sản xuất bộ nhớ trở nên thận trọng hơn trong đầu tư mở rộng, chu kỳ ra mắt công suất mới thường kéo dài 12 đến 18 tháng. Ông Chu Chính Cương, Phó Chủ tịch IDC Trung Quốc, dự báo chu kỳ tăng giá bộ nhớ này sẽ kéo dài trong năm 2026 và có thể tiếp diễn sang 2027 hoặc 2028.
Tầng ba: Tái phân phối quyền lực định giá. Khi các nhà cung cấp dịch vụ đám mây ký hợp đồng cung ứng dài hạn với giá sàn cố định, mặt bằng giá DRAM năm 2026 xuất hiện cấu trúc "khó tăng, càng khó giảm". Trong khi đó, cơ chế định giá theo năm của HBM đang đối mặt với sự thiết lập lại cơ bản, các hợp đồng năm 2027 dự kiến sẽ tăng giá mạnh vượt xa kỳ vọng thị trường trước đây. TrendForce nhấn mạnh các nhà sản xuất sẽ điều chỉnh phân bổ công suất linh hoạt dựa trên so sánh lợi nhuận giữa HBM và DRAM truyền thống.
Sự tương tác giữa ba tầng này tạo nên tính chất đặc biệt của siêu chu kỳ: Không chỉ là bùng nổ do cầu tăng, mà còn là "sự thịnh vượng có kỷ luật" bị ràng buộc bởi độ cứng nguồn cung – các nhà sản xuất, với mục tiêu tối đa hóa lợi nhuận, có động lực duy trì thay vì phá vỡ cấu trúc cung cầu hiện tại. Điều này khiến độ dài và tính ổn định của siêu chu kỳ khác biệt rõ rệt so với các chu kỳ "bùng nổ – dư thừa – suy thoái" truyền thống của ngành bộ nhớ.
Kết Luận: "Căng Thẳng Nội Tại" Trong Siêu Chu Kỳ
Báo cáo tài chính quý 1 năm 2026 của Samsung trên bề mặt là minh chứng hoàn hảo cho "siêu chu kỳ bộ nhớ AI" – doanh thu, lợi nhuận kỷ lục, tốc độ tăng trưởng gấp nhiều lần, sản lượng HBM tăng gấp ba. Tuy nhiên, ẩn sau những con số rực rỡ đó, phát biểu của ban lãnh đạo rằng "DRAM truyền thống hiện có lợi nhuận cao hơn HBM" đã hé lộ một sự căng thẳng nội tại thường bị bỏ qua trong câu chuyện siêu chu kỳ.
Sự căng thẳng này thể hiện trên nhiều phương diện: cấu trúc lợi nhuận đảo ngược giữa DRAM truyền thống và HBM, cơ chế định giá HBM theo năm bị trễ và sắp được thiết lập lại, cuộc cạnh tranh giữa Samsung và SK Hynix về thị phần và tiến độ công nghệ, cùng cuộc giằng co giữa lợi nhuận AI tăng vọt và phân phối lợi ích nội bộ. Những căng thẳng này không phủ nhận siêu chu kỳ, mà ngược lại, chính là chìa khóa để hiểu rõ đặc trưng của nó.
Xét từ góc độ đầu tư, câu chuyện định giá hiện tại của mã 005930 đang ở điểm chuyển giao then chốt. Khi đà tăng trưởng lợi nhuận bùng nổ đã được phản ánh đầy đủ vào giá, trọng tâm tiếp theo sẽ là chất lượng và tính bền vững của cấu trúc lợi nhuận – liệu giá hợp đồng HBM có bắt kịp trong năm 2027, rủi ro lao động có được giải quyết về mặt thể chế, và thị phần cung ứng HBM có đột phá hay không. Diễn biến của các biến số này sẽ quyết định liệu Samsung Electronics có thể chuyển mình từ "người hưởng lợi theo chu kỳ" thành "người dẫn đầu về cấu trúc" trong siêu chu kỳ bộ nhớ AI.


