Trade
Basic
Futures
Futures
Hundreds of contracts settled in USDT or BTC
TradFi
Gold
Trade global traditional assets with USDT in one place
Options
Hot
Trade European-style vanilla options
Unified Account
Maximize your capital efficiency
Demo Trading
Futures Kickoff
Get prepared for your futures trading
Futures Events
Participate in events to win generous rewards
Demo Trading
Use virtual funds to experience risk-free trading
Earn
Launch
CandyDrop
Collect candies to earn airdrops
Launchpool
Quick staking, earn potential new tokens
HODLer Airdrop
Hold GT and get massive airdrops for free
Launchpad
Be early to the next big token project
Alpha Points
Trade on-chain assets and enjoy airdrop rewards!
Futures Points
Earn futures points and claim airdrop rewards
Investment
Simple Earn
Earn interests with idle tokens
Auto-Invest
Auto-invest on a regular basis
Dual Investment
Buy low and sell high to take profits from price fluctuations
Soft Staking
Earn rewards with flexible staking
Crypto Loan
0 Fees
Pledge one crypto to borrow another
Lending Center
One-stop lending hub
VIP Wealth Hub
Customized wealth management empowers your assets growth
Private Wealth Management
Customized asset management to grow your digital assets
Quant Fund
Top asset management team helps you profit without hassle
Staking
Stake cryptos to earn in PoS products
Smart Leverage
New
No forced liquidation before maturity, worry-free leveraged gains
GUSD Minting
Use USDT/USDC to mint GUSD for treasury-level yields
More
LeYi
No content yet
LeYi
March 4th Evening Bitcoin / Ethereum Market Update
Bitcoin ultimately experienced a surge, with the price breaking through 72,000. Currently, it is consolidating sideways. Since the price has broken the 70,000 level, we need to redefine the market direction moving forward.
Ethereum is also approaching the 2,100 level following Bitcoin, but there is obvious selling pressure above. The price needs to pull back before attempting to push higher. As long as it does not break 1,950, the current support levels can be maintained.
Personal suggestions:
Bitcoin can move north around 70,500-70,000, with
View OriginalBitcoin ultimately experienced a surge, with the price breaking through 72,000. Currently, it is consolidating sideways. Since the price has broken the 70,000 level, we need to redefine the market direction moving forward.
Ethereum is also approaching the 2,100 level following Bitcoin, but there is obvious selling pressure above. The price needs to pull back before attempting to push higher. As long as it does not break 1,950, the current support levels can be maintained.
Personal suggestions:
Bitcoin can move north around 70,500-70,000, with

- Reward
- 2
- Comment
- Repost
- Share
March 4th BNB Silk Road
The market has stabilized, and the 620 support is effective. Currently, it is pushing upward along the upper band of the Bollinger Bands. MACD has a golden cross, and KDJ is turning upward, indicating healthy signals.
Personal suggestion
From 620 to around 600, first target 660, second target 680
$BNB
BNB3.62%
- Reward
- like
- Comment
- Repost
- Share
March 4th SOL Silk Road
The current market situation is very clear. There is a lot of selling pressure above 90, and it’s very difficult to break through in the short term.
The MACD histogram is showing increasing volume, but the momentum is actually weakening, and a death cross is about to form. The RSI is also heading downward, and the bulls are losing strength.
Personal suggestion
You can consider buying around 90-95, with initial targets at 80, then 75.
$SOL
SOL5.7%
- Reward
- like
- Comment
- Repost
- Share
March 4 Morning Two-Biscuit Silk Road
Two biscuits are moving faster than the big biscuit, but they also fall back more quickly. Currently, the bulls are clearly losing momentum. The KDJ has already turned downward to form a death cross, and trading volume is also decreasing, indicating short-term weakness.
Personal suggestion:
Rebound to around 2000–2030, with the first target at 1900, then at 1850
$BTC $ETH
View OriginalTwo biscuits are moving faster than the big biscuit, but they also fall back more quickly. Currently, the bulls are clearly losing momentum. The KDJ has already turned downward to form a death cross, and trading volume is also decreasing, indicating short-term weakness.
Personal suggestion:
Rebound to around 2000–2030, with the first target at 1900, then at 1850
$BTC $ETH
- Reward
- like
- Comment
- Repost
- Share
March 4th Morning Bitcoin Silk Road
On the 1-hour chart, the price surged past the 70,000 mark but then retreated again, with obvious selling pressure above. The 70,000 level is temporarily unbreakable; the market is likely to first consolidate and then attempt to push higher. In the short term, focus on buying low and selling high.
Personal suggestion:
Around 69,000–70,000, with a target of 67,000–66,000
$BTC $ETH
View OriginalOn the 1-hour chart, the price surged past the 70,000 mark but then retreated again, with obvious selling pressure above. The 70,000 level is temporarily unbreakable; the market is likely to first consolidate and then attempt to push higher. In the short term, focus on buying low and selling high.
Personal suggestion:
Around 69,000–70,000, with a target of 67,000–66,000
$BTC $ETH
- Reward
- like
- Comment
- Repost
- Share
March 2nd, Two Biscuit Silk Road
The price surged to 1988 and then immediately pulled back, clearly showing strong selling pressure above. From a technical perspective, the monthly EMA is about to cross below the weekly EMA, which is a clear downward trend signal; the MACD red histogram is still expanding, indicating that the momentum is building up and may trigger a decline at any time.
Trading Suggestions
You can consider trading within the 1980-2030 range, with the first target at 1900 and further downside at 1850.
$BTC $ETH
View OriginalThe price surged to 1988 and then immediately pulled back, clearly showing strong selling pressure above. From a technical perspective, the monthly EMA is about to cross below the weekly EMA, which is a clear downward trend signal; the MACD red histogram is still expanding, indicating that the momentum is building up and may trigger a decline at any time.
Trading Suggestions
You can consider trading within the 1980-2030 range, with the first target at 1900 and further downside at 1850.
$BTC $ETH
- Reward
- like
- Comment
- Repost
- Share
March 2nd Bitcoin Silk Road
On the 1-hour chart, the price started to pull back after reaching around 65,000. The battle between the bulls and bears is particularly intense, but the overall downward trend has not changed. From a technical perspective, the KDJ indicator has entered the overbought zone, and the RSI indicator is also beginning to decline, clearly showing that the buying momentum is weakening.
Trading Suggestions
You can consider buying in the 67,000-68,000 range, with an initial target of 65,000 and further downside potential to 64,000.
$BTC $ETH
View OriginalOn the 1-hour chart, the price started to pull back after reaching around 65,000. The battle between the bulls and bears is particularly intense, but the overall downward trend has not changed. From a technical perspective, the KDJ indicator has entered the overbought zone, and the RSI indicator is also beginning to decline, clearly showing that the buying momentum is weakening.
Trading Suggestions
You can consider buying in the 67,000-68,000 range, with an initial target of 65,000 and further downside potential to 64,000.
$BTC $ETH
- Reward
- like
- Comment
- Repost
- Share
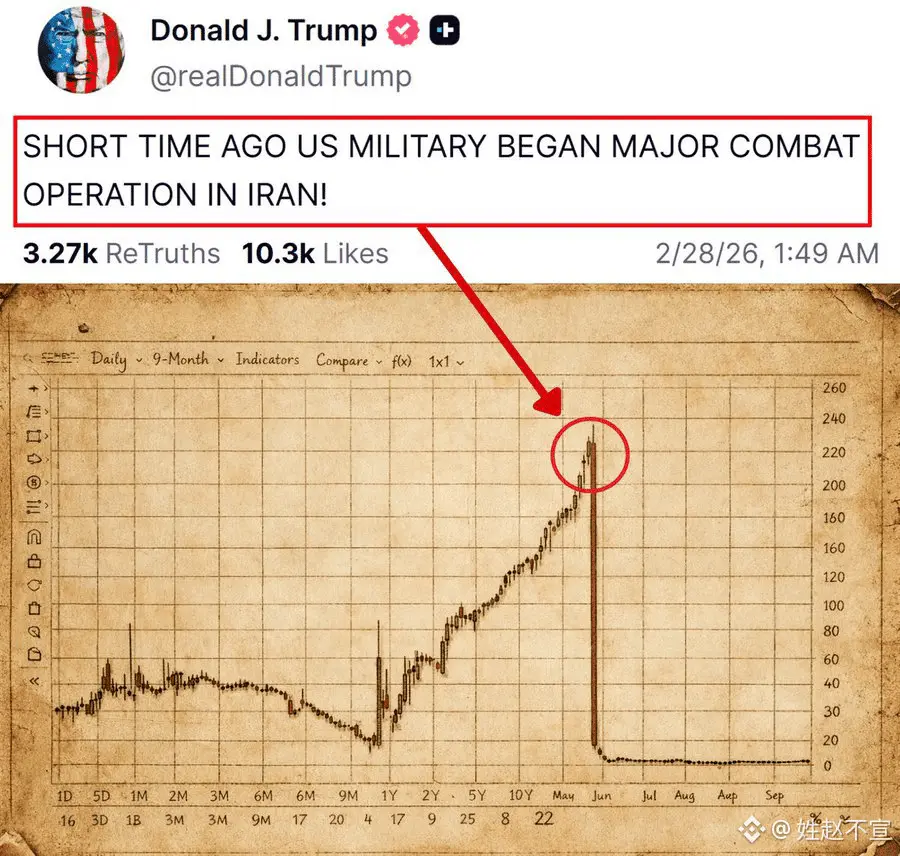
This time, the US and Israel are going to fight Iran, and it's not a joke—it's a real black swan landing.
Unlike those symbolic conflicts before, the US military is clearly planning to carry out sustained operations for several weeks, with risks pushed to the maximum. The market simply can't handle this calmly.
How the market will develop next depends on the situation, which can be divided into three scenarios:
1. If the fighting stops after a few days: the market will at most panic briefly in the short term, then emotions will settle, and it will gradually return to normal;
2. If the conflict
View OriginalUnlike those symbolic conflicts before, the US military is clearly planning to carry out sustained operations for several weeks, with risks pushed to the maximum. The market simply can't handle this calmly.
How the market will develop next depends on the situation, which can be divided into three scenarios:
1. If the fighting stops after a few days: the market will at most panic briefly in the short term, then emotions will settle, and it will gradually return to normal;
2. If the conflict
- Reward
- like
- Comment
- Repost
- Share
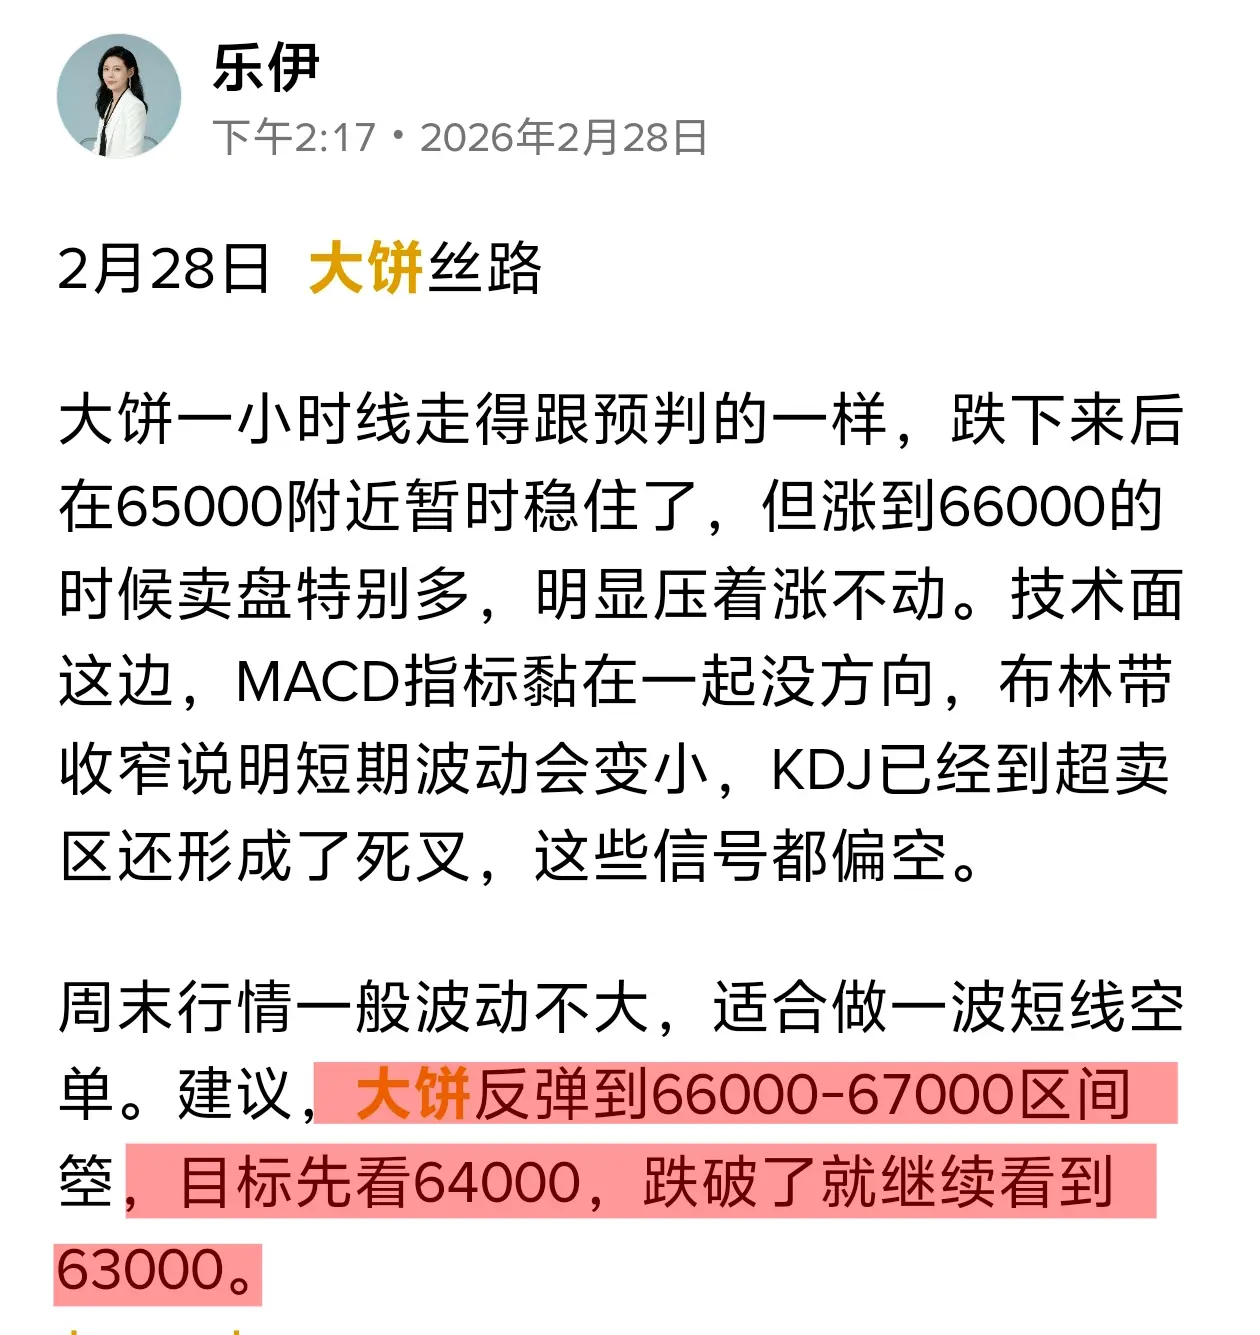
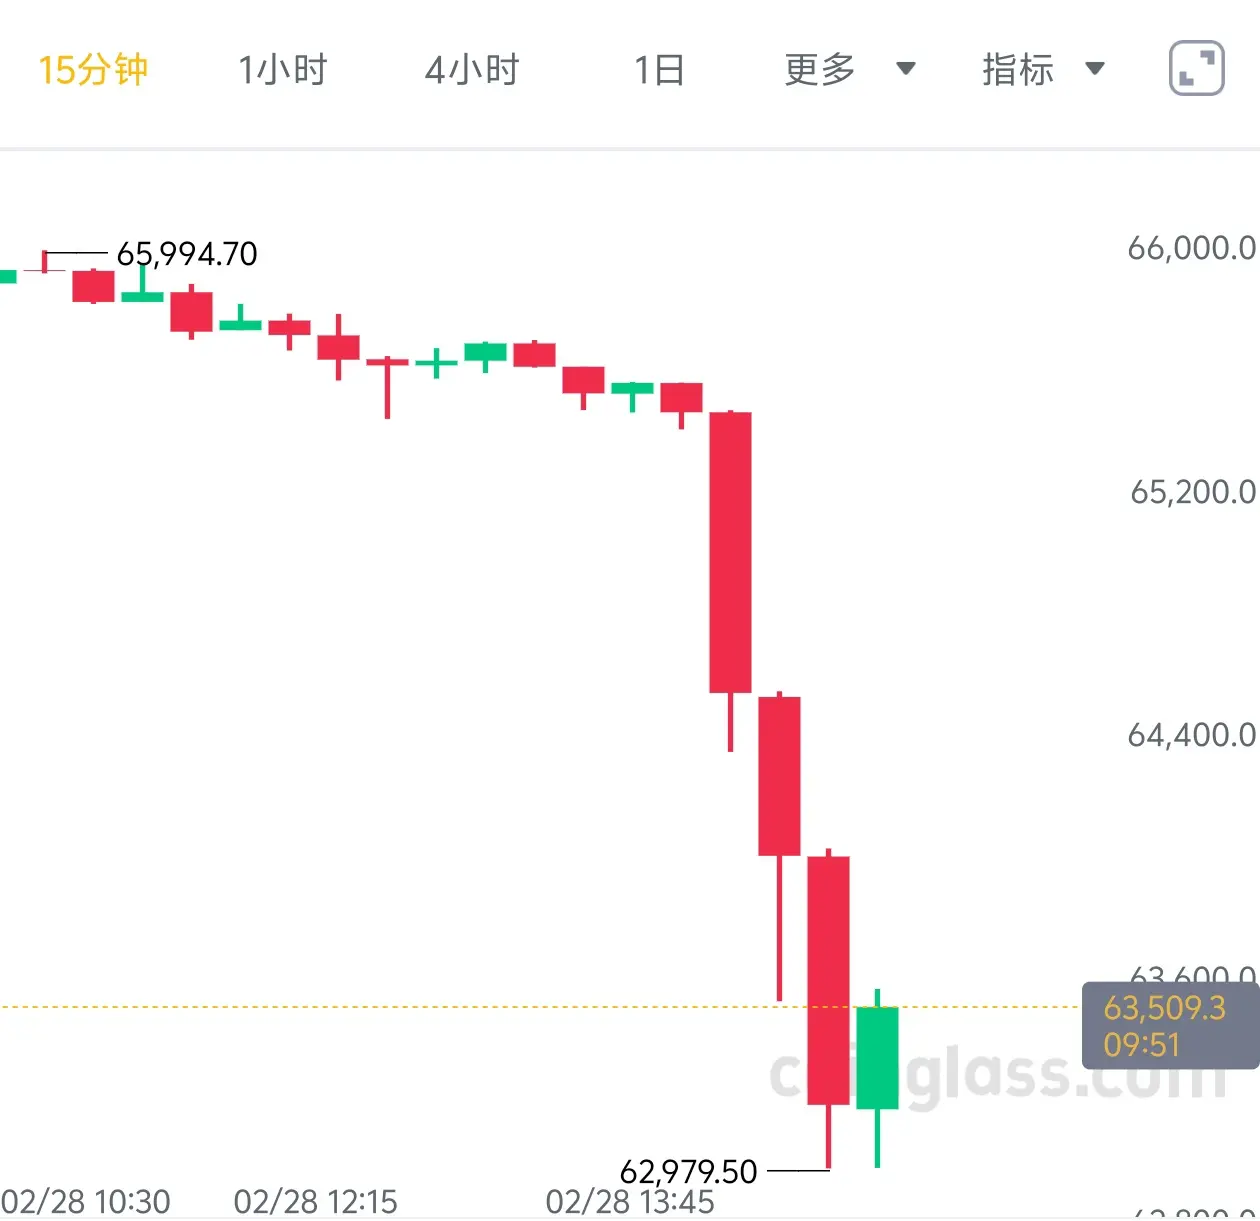

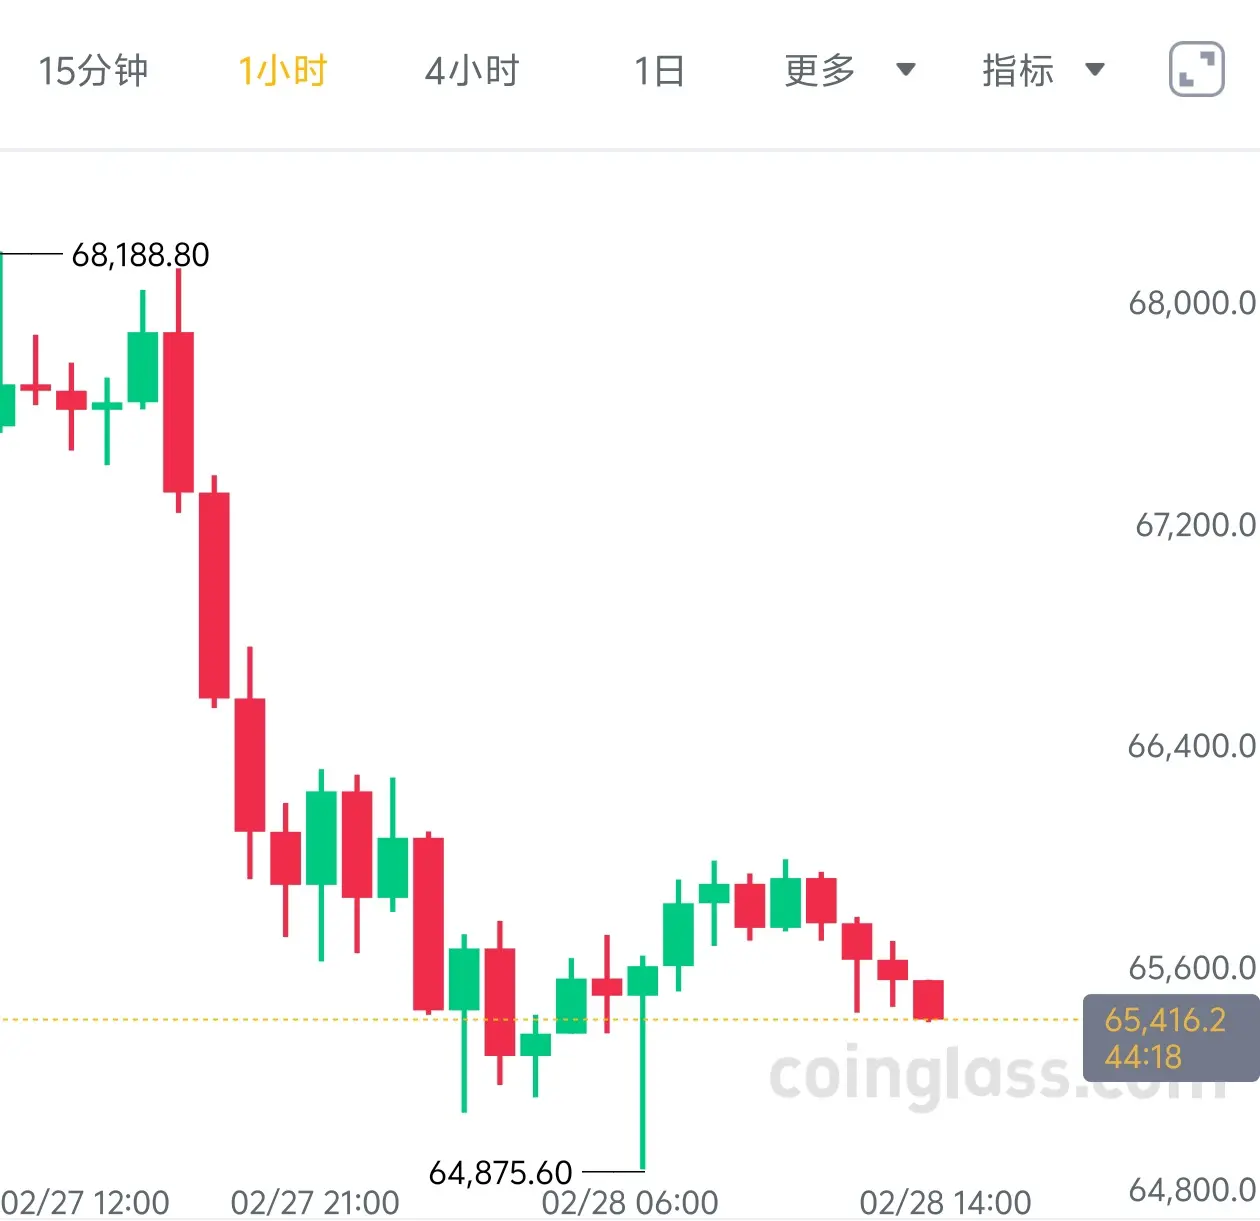
February 28th, Bitcoin Silk Road
Bitcoin's 1-hour chart is playing out as expected. After dropping, it temporarily stabilized around 65,000. However, when it rose to 66,000, there was a lot of selling pressure, clearly preventing it from moving higher. On the technical side, the MACD indicator is stuck together with no clear direction, the Bollinger Bands are narrowing indicating reduced short-term volatility, and the KDJ has already entered the oversold zone with a dead cross forming. These signals are mostly bearish.
Weekend trading usually sees less volatility, making it suitable for a shor
View OriginalBitcoin's 1-hour chart is playing out as expected. After dropping, it temporarily stabilized around 65,000. However, when it rose to 66,000, there was a lot of selling pressure, clearly preventing it from moving higher. On the technical side, the MACD indicator is stuck together with no clear direction, the Bollinger Bands are narrowing indicating reduced short-term volatility, and the KDJ has already entered the oversold zone with a dead cross forming. These signals are mostly bearish.
Weekend trading usually sees less volatility, making it suitable for a shor
- Reward
- 1
- Comment
- Repost
- Share

February 25th BNB Silk Road
Currently, after hitting a bottom at 576, it has rebounded and stabilized. Although the MACD red histogram is shrinking, the KDJ continues to move upward, making it suitable for a short-term long position.
Trading Suggestions
Gradually buy in the 580–590 range, with a target of 620–630.
$BNB
Currently, after hitting a bottom at 576, it has rebounded and stabilized. Although the MACD red histogram is shrinking, the KDJ continues to move upward, making it suitable for a short-term long position.
Trading Suggestions
Gradually buy in the 580–590 range, with a target of 620–630.
$BNB
BNB3.62%
- Reward
- like
- Comment
- Repost
- Share
February 25th, Bitcoin and Altcoins Silk Road
Today at noon, the market was very volatile. Influenced by the US tariff news, Bitcoin briefly dropped to around 62,400. After stabilizing sentiment, it quickly rebounded to 66,000. Currently, the competition is very intense. On the four-hour chart, the MACD has already formed a golden cross, and although the middle band of the Bollinger Bands shows some resistance, the price is attempting to break through, indicating a clear rebound signal.
Currently, on the daily chart, Bitcoin is still consolidating sideways, but a doji star indicating a bottom
View OriginalToday at noon, the market was very volatile. Influenced by the US tariff news, Bitcoin briefly dropped to around 62,400. After stabilizing sentiment, it quickly rebounded to 66,000. Currently, the competition is very intense. On the four-hour chart, the MACD has already formed a golden cross, and although the middle band of the Bollinger Bands shows some resistance, the price is attempting to break through, indicating a clear rebound signal.
Currently, on the daily chart, Bitcoin is still consolidating sideways, but a doji star indicating a bottom
- Reward
- like
- Comment
- Repost
- Share
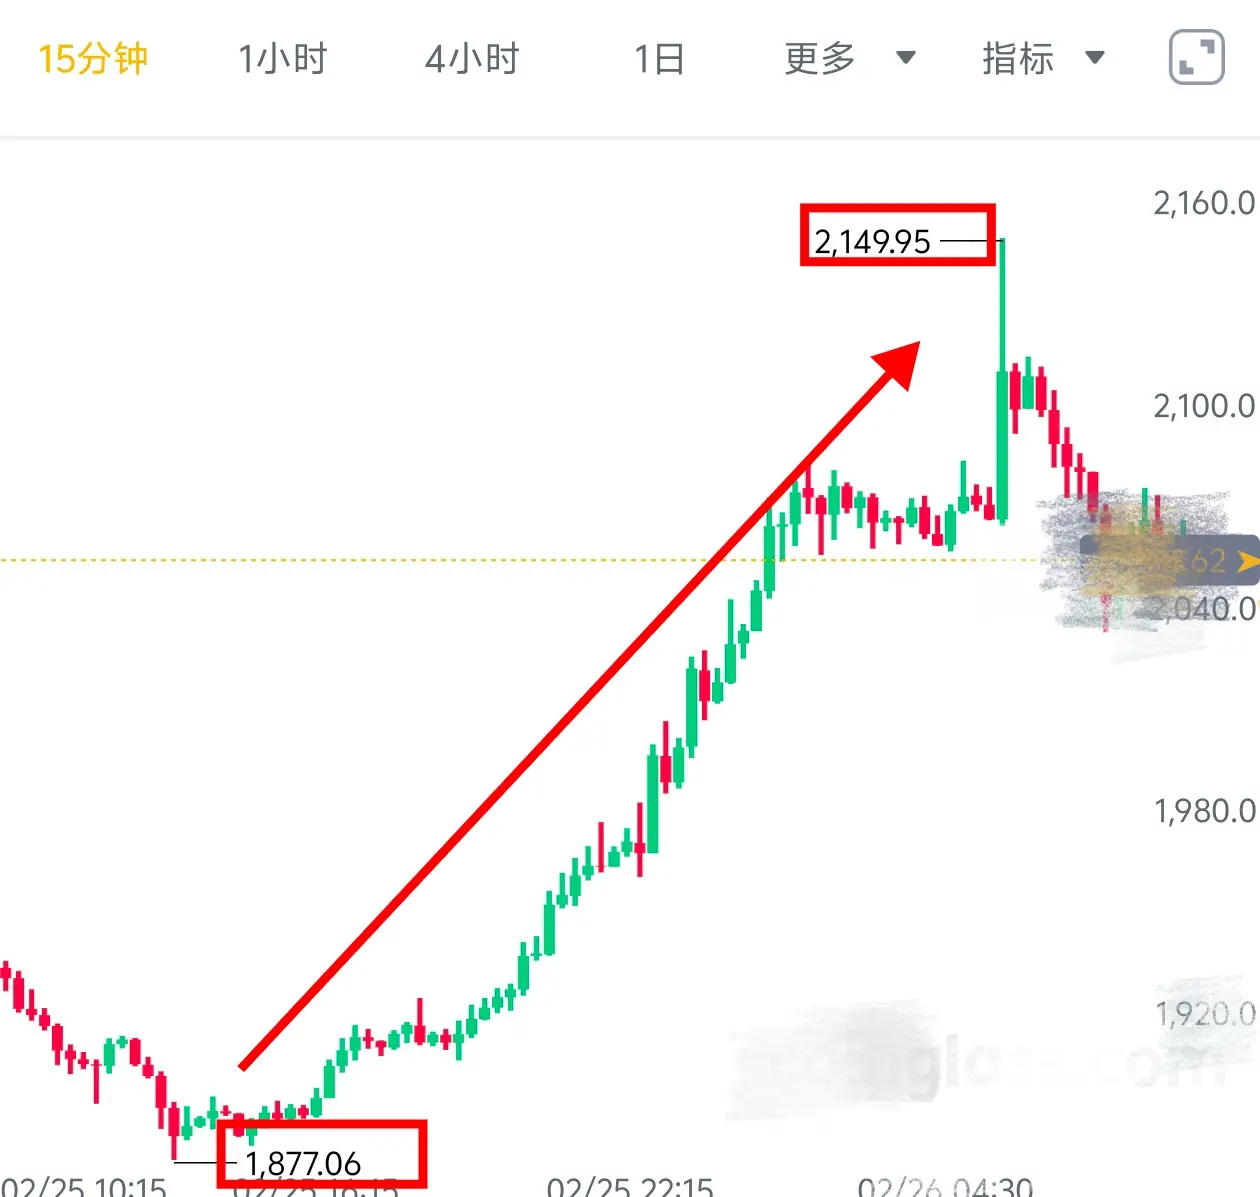
February 24th, Bitcoin and Ethereum Silk Road
On the daily chart, Bitcoin previously fluctuated in the 66,000-70,000 range for several days. It failed to hold the support, and the bears regained control. The downward trend has already emerged. Just follow the trend for trading.
Operation reference:
Bitcoin around 65,000-66,000, short, target 63,000-62,000
Ethereum around 1,880-1,920, short, target 1,800-1,750
$BTC $ETH
View OriginalOn the daily chart, Bitcoin previously fluctuated in the 66,000-70,000 range for several days. It failed to hold the support, and the bears regained control. The downward trend has already emerged. Just follow the trend for trading.
Operation reference:
Bitcoin around 65,000-66,000, short, target 63,000-62,000
Ethereum around 1,880-1,920, short, target 1,800-1,750
$BTC $ETH
- Reward
- like
- Comment
- Repost
- Share
February 10th, Bitcoin and Altcoins, Silk Road
On the 4-hour chart, Bitcoin just dropped to around 60,000 and was quickly pulled back. It is now oscillating around 70,000 to build a bottom. The Bollinger Bands are starting to narrow, with support at the middle band. The MACD bearish momentum is weakening, and it’s no longer falling.
Trading ideas:
Bitcoin retraces around 68,000–69,000, aiming for 71,000–72,000
Altcoins retrace around 2,050–2,090, aiming for 2,150–2,200
Overall, it’s about retracing to buy low and look for a rebound to recover. Don’t chase highs; buy in at the right levels be
View OriginalOn the 4-hour chart, Bitcoin just dropped to around 60,000 and was quickly pulled back. It is now oscillating around 70,000 to build a bottom. The Bollinger Bands are starting to narrow, with support at the middle band. The MACD bearish momentum is weakening, and it’s no longer falling.
Trading ideas:
Bitcoin retraces around 68,000–69,000, aiming for 71,000–72,000
Altcoins retrace around 2,050–2,090, aiming for 2,150–2,200
Overall, it’s about retracing to buy low and look for a rebound to recover. Don’t chase highs; buy in at the right levels be
- Reward
- like
- Comment
- Repost
- Share

February 8th, Bitcoin and Altcoins Roadmap
Over the weekend, there were no major fluctuations overall. Bitcoin has been oscillating around 70,000. From a technical perspective, the 1-hour Bollinger Bands are narrowing, with the middle band providing clear support; Altcoins are also steadily above the weekly EMA, indicating that the overall bullish momentum is gathering strength.
Personal trading suggestions:
Bitcoin can fluctuate within the 67,500-68,500 range, with targets at 71,200-72,000;
Altcoins can fluctuate within the 2,000-2,050 range, with targets at 2,150-2,200.
View OriginalOver the weekend, there were no major fluctuations overall. Bitcoin has been oscillating around 70,000. From a technical perspective, the 1-hour Bollinger Bands are narrowing, with the middle band providing clear support; Altcoins are also steadily above the weekly EMA, indicating that the overall bullish momentum is gathering strength.
Personal trading suggestions:
Bitcoin can fluctuate within the 67,500-68,500 range, with targets at 71,200-72,000;
Altcoins can fluctuate within the 2,000-2,050 range, with targets at 2,150-2,200.
- Reward
- like
- Comment
- Repost
- Share

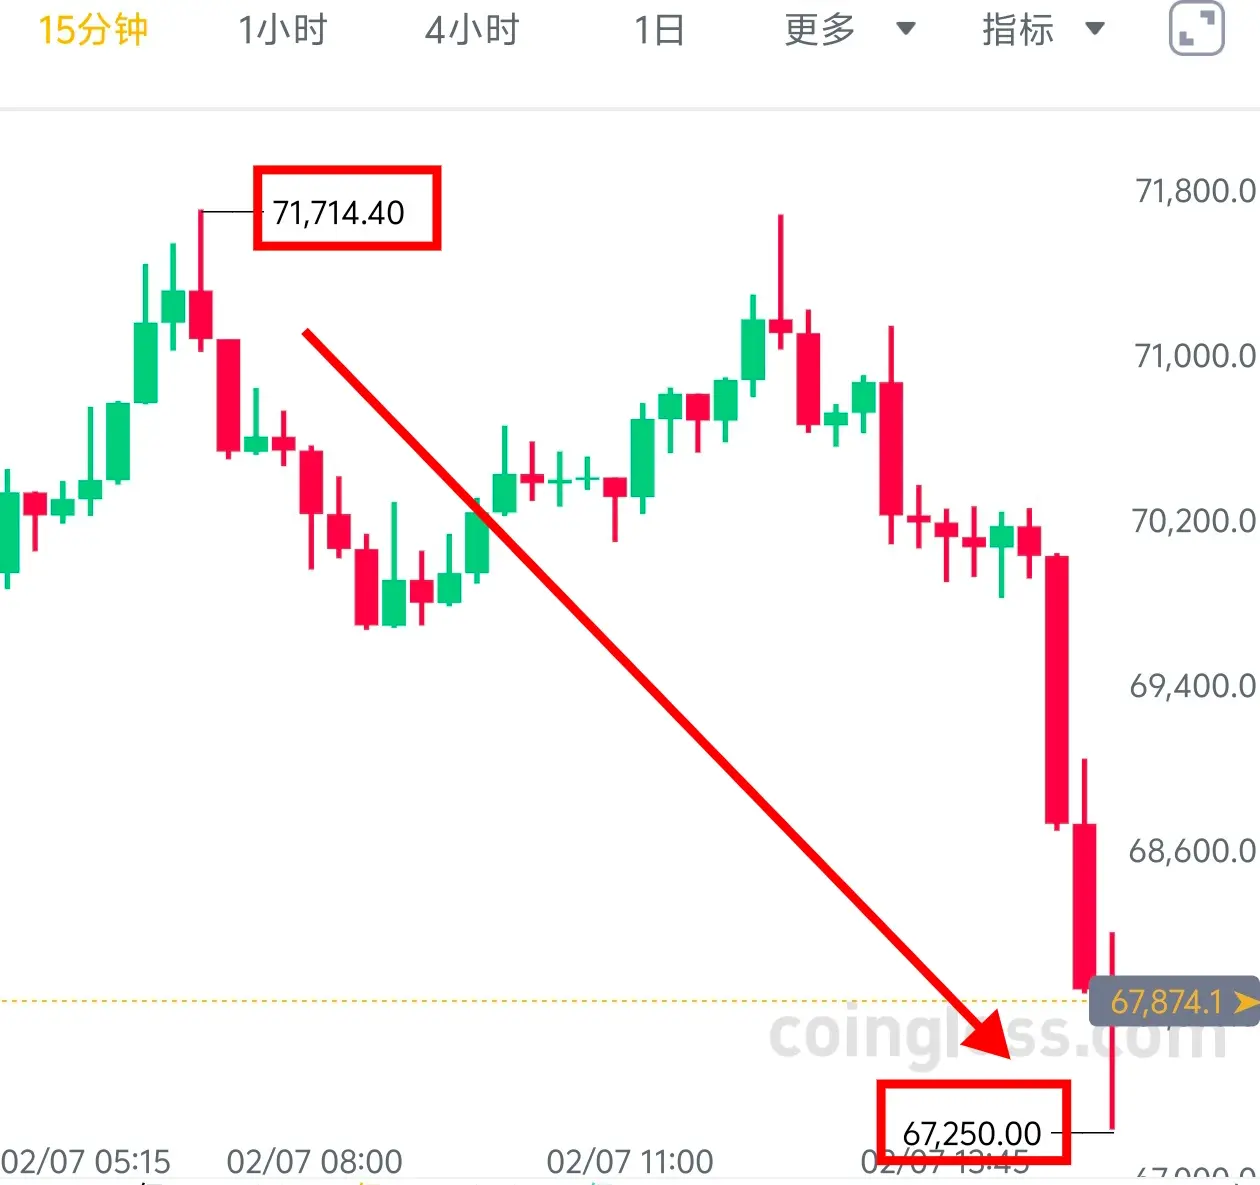
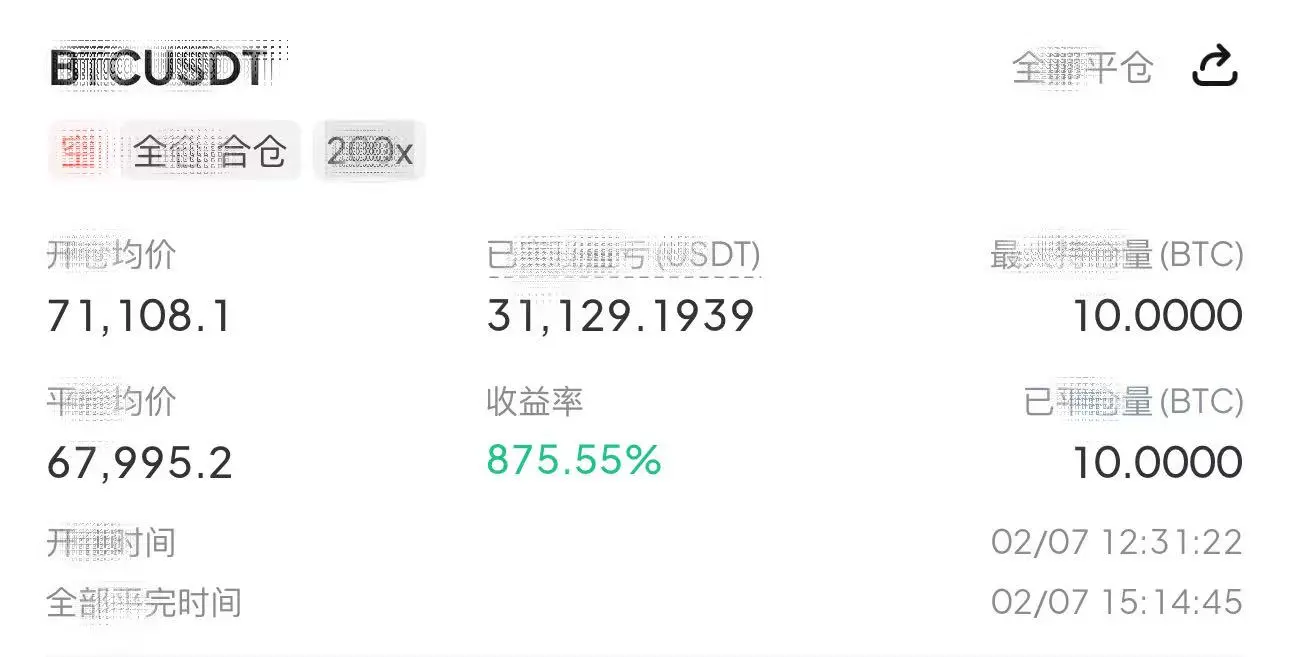
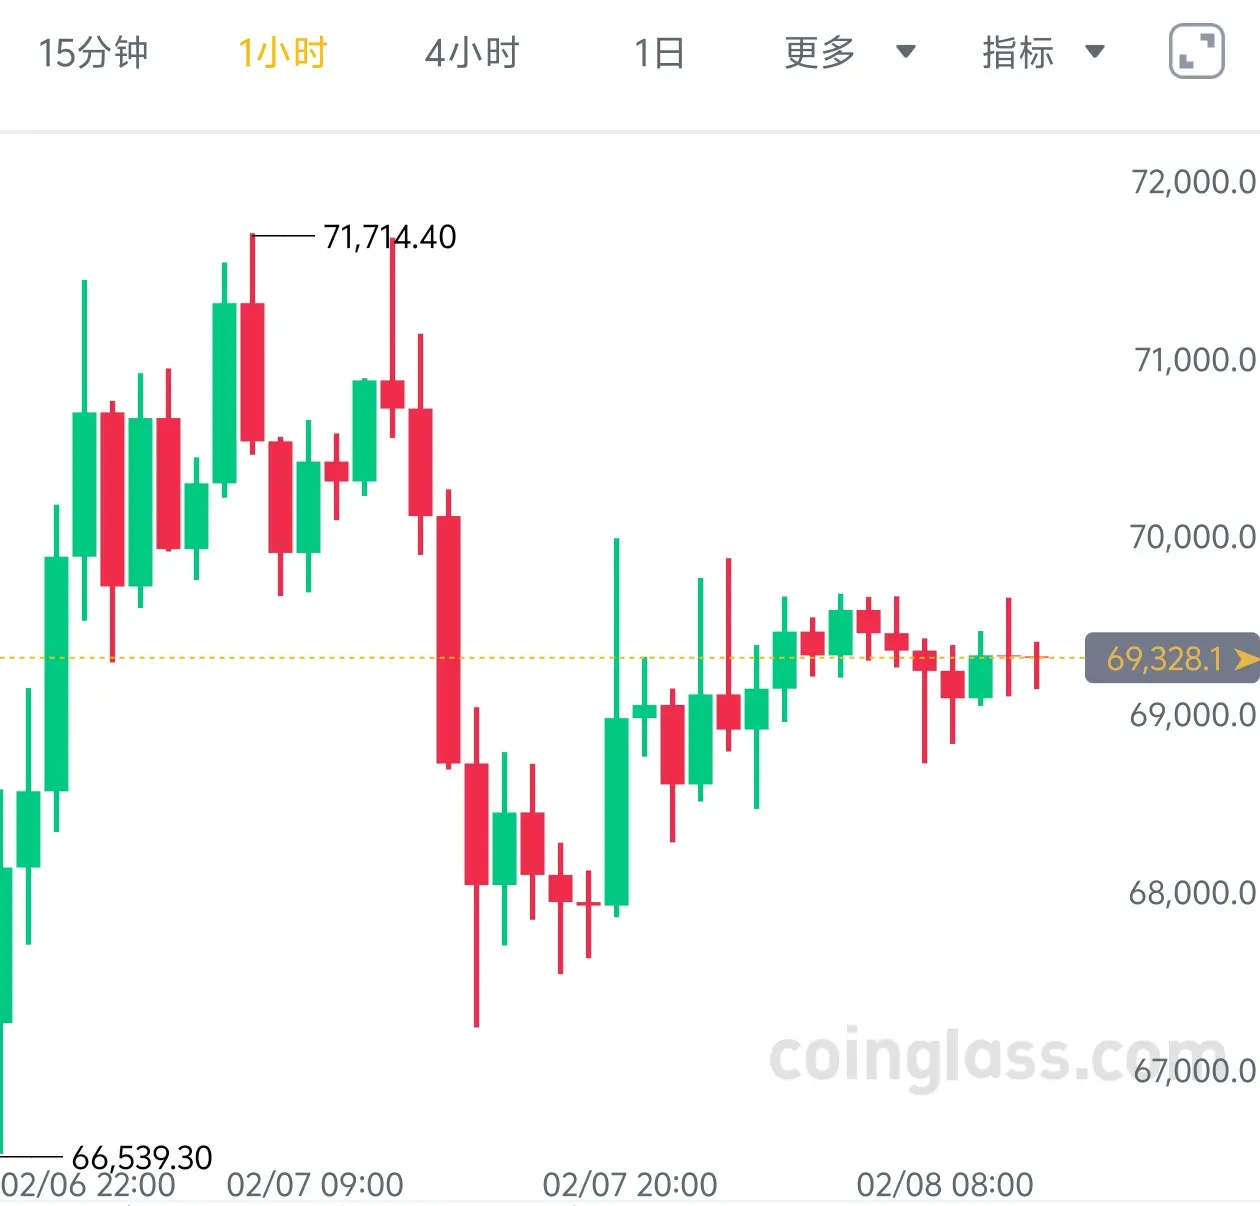
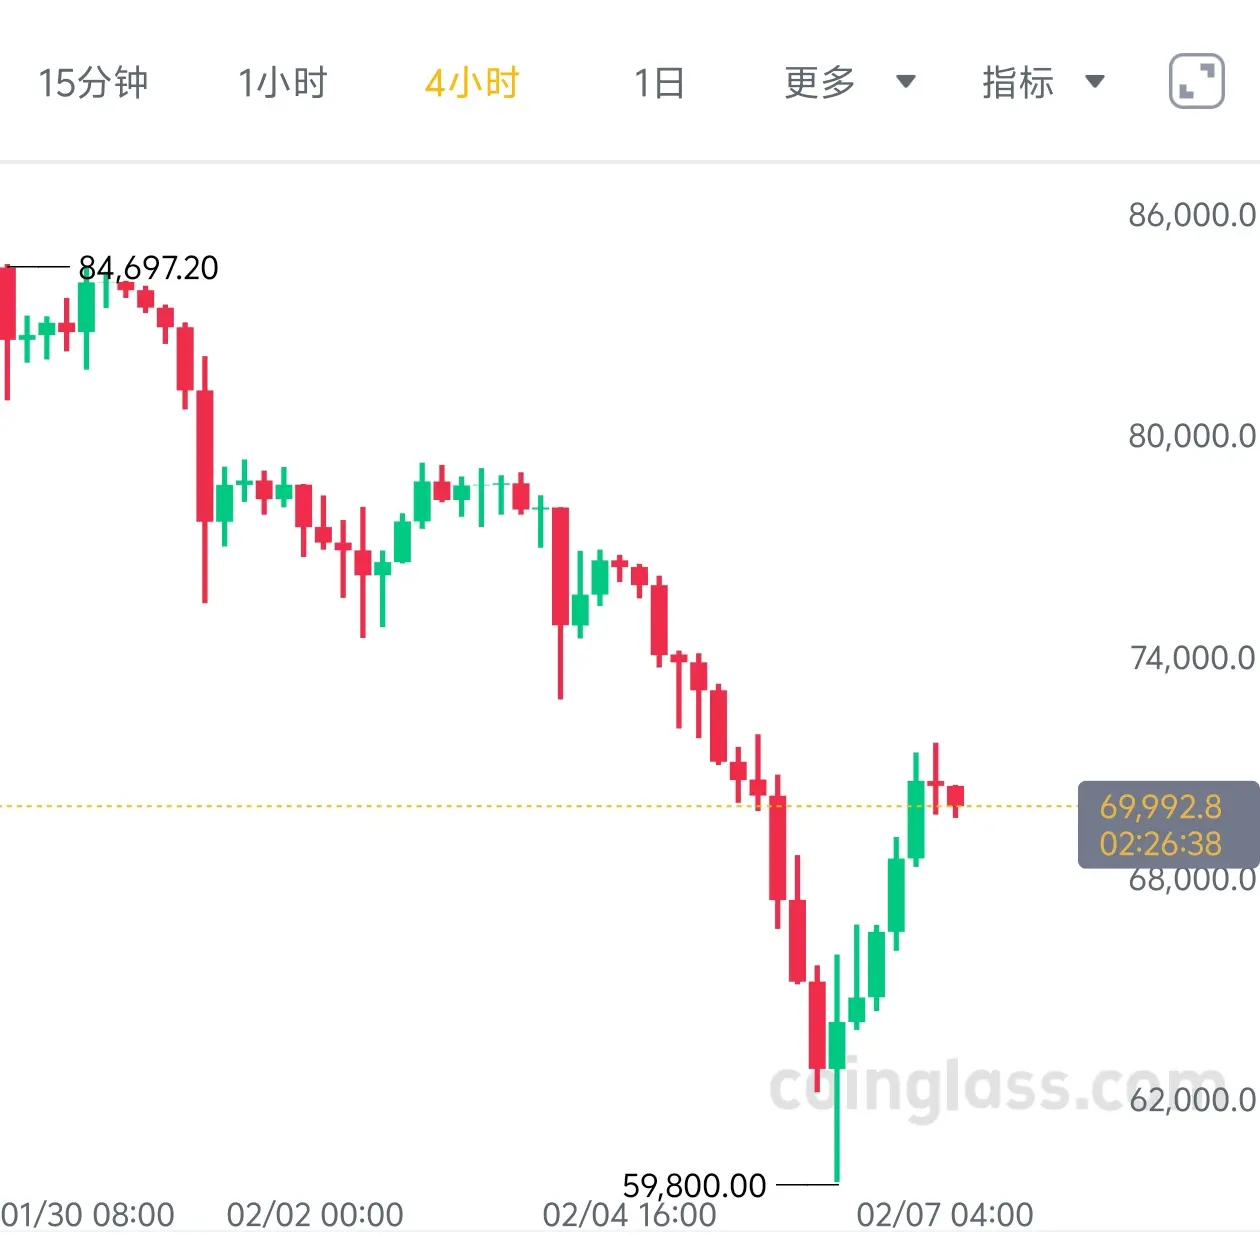
February 7th, Big Coin and Small Coin Silk Road
Big Coin dropped to 59,800 yesterday and then stabilized and rebounded, but the selling pressure at the 70,000 level is very strong. Technically, the MACD green bars are shrinking, but the RSI is heading downward. The 70,000 threshold is likely to be tested back and forth. The trend of Small Coin is basically synchronized with Big Coin. Today, it's generally suitable for light positions to make a short-term move.
Personal trading suggestions:
Big Coin can be bought in the 70,000-71,000 range, with targets at 68,000-66,000;
Small Coin can be bough
View OriginalBig Coin dropped to 59,800 yesterday and then stabilized and rebounded, but the selling pressure at the 70,000 level is very strong. Technically, the MACD green bars are shrinking, but the RSI is heading downward. The 70,000 threshold is likely to be tested back and forth. The trend of Small Coin is basically synchronized with Big Coin. Today, it's generally suitable for light positions to make a short-term move.
Personal trading suggestions:
Big Coin can be bought in the 70,000-71,000 range, with targets at 68,000-66,000;
Small Coin can be bough
- Reward
- like
- Comment
- Repost
- Share
February 6th, Bitcoin and Altcoins Silk Road
The Federal Reserve's hawkish stance and a pullback in the US stock market, combined with profit-taking and exiting positions, have led to a deep decline in Bitcoin, which directly broke below the key support level of 64,000, with the lowest approaching 59,800. Technically, the 7-day and 30-day moving averages have formed a death cross and are trending downward. The price is being suppressed by the moving averages. Today's rebound from the lows is merely a weak correction after a sharp decline. The candlestick pattern also shows long bearish shadows
View OriginalThe Federal Reserve's hawkish stance and a pullback in the US stock market, combined with profit-taking and exiting positions, have led to a deep decline in Bitcoin, which directly broke below the key support level of 64,000, with the lowest approaching 59,800. Technically, the 7-day and 30-day moving averages have formed a death cross and are trending downward. The price is being suppressed by the moving averages. Today's rebound from the lows is merely a weak correction after a sharp decline. The candlestick pattern also shows long bearish shadows
- Reward
- 1
- Comment
- Repost
- Share
Trending Topics
View More309.6K Popularity
93.82K Popularity
190.46K Popularity
18.36K Popularity
417.04K Popularity
Pin