Abstract
-
In March, both BTC and ETH traded under pressure, with the market lacking a clear dominant narrative. Structurally, a pronounced divergence emerged: small- and mid-cap assets demonstrated relative strength and became the primary source of alpha, while large-cap assets remained broadly weak.
-
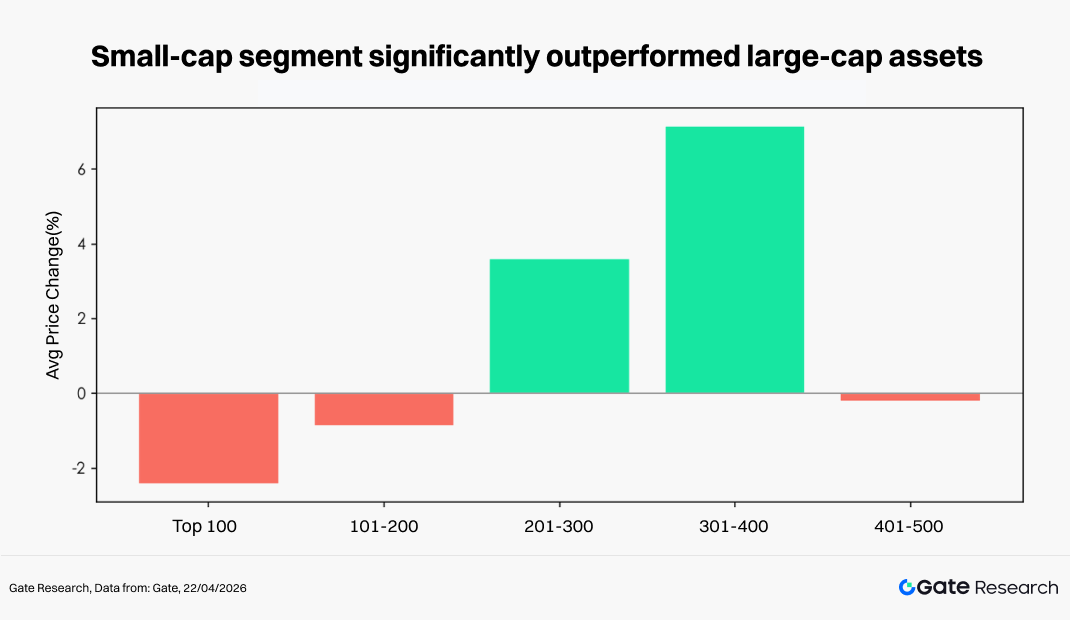
The distribution of price changes indicates that this cycle was characterized by “liquidity rotation within a zero-sum environment.” High-beta assets were repeatedly active in short cycles, but lacked sustainability. The top 500 tokens by market capitalization recorded an average decline of 7.71%, while the 201–400 segment bucked the trend with gains of 3.6%–7.1%, significantly outperforming the top 100.
-
At the individual token level, ARIA led with a 394.12% increase, highlighting capital concentration in high-elasticity small- and mid-cap assets, whereas PIPPIN plunged 91.64%, reflecting severe drawdowns among high-volatility tokens. Within the top 100, TAO rose 67.93% against the trend, underscoring the strong performance of the AI sector.
-
In terms of trading volume, SIREN recorded a 6.64x increase in volume alongside a 488.68% price surge, while ONT saw volume rise 24.24x with a 98.20% gain, reflecting strong capital-driven momentum. In contrast, NIGHT experienced a 73.22x spike in volume but declined 25.61%, indicating selling pressure and capital outflows.
-
Regarding correlation, OKB showed a high correlation of 0.86 with the broader market, while ICP stood at 0.71, suggesting that the market remains largely Beta-driven, although certain sectors have begun to exhibit independent trends.
1. Crypto Market Overview
In March, the global macro environment remained broadly volatile, with geopolitical risks easing marginally and risk appetite showing a slight recovery. On the economic front, U.S. inflation moderated but remained sticky, leading to repeated adjustments in market expectations for rate cuts. U.S. Treasury yields and the dollar fluctuated at elevated levels, and overall financial conditions remained tight. Against this backdrop, the crypto market trended downward with heightened volatility, as BTC and ETH faced capital outflows and weakening sentiment. Structurally, divergence intensified, with certain hot sectors and individual tokens rising against the trend, but lacking a sustained narrative.
On the DeFi side, according to DeFiLlama data, total value locked (TVL) stood at approximately $92 billion as of March 31, increasing by around $1.2 billion month-over-month. The incremental growth was mainly driven by Ethereum mainnet and leading Layer 2 networks (particularly Base), as well as the recovery of lending, staking, and yield-generating protocols such as Aave, Lido, and Pendle.
In terms of liquidity, stablecoin supply rose to approximately $315.5 billion by the end of March, with a notable structural divergence: USDC supply and on-chain transfer activity strengthened, while USDT showed relative weakness. This shift encouraged market-making, cross-chain, and arbitrage capital to favor more compliance-friendly assets and lower-friction pathways.
On the event side, multiple security incidents occurred in mid-to-late March, with cross-chain vulnerabilities and permission/private key issues remaining the primary sources of losses. Notably, Resolv suffered a loss of approximately $80 million, alongside several attacks on smaller protocols, reigniting market concerns over bridge security and critical contract risk management.
On the funding side, Web3 financing activity in March included approximately 92 deals, totaling around $3.5 billion. DeFi, CeFi, tools/wallets, and infrastructure remained the dominant sectors, with an increasing trend toward M&A-driven transactions.
This section groups the top 500 tokens by market capitalization and analyzes their average price changes between March 1 and March 31. From an equal-weighted perspective across the full sample, the monthly decline based on hourly average prices was approximately 7.71%. The market bottom occurred in late March (March 29), while the peak was concentrated in early March (March 4), indicating that after an initial rally, the market entered a sustained downward channel, with volatility significantly amplifying in the latter part of the month. Based on daily data, the recalculated decline was approximately -6.36%, which is largely consistent with the hourly results, confirming the overall weak market structure.
From a market capitalization perspective, the market exhibited a clear stratified pattern of “mid-cap strength, weakness at both ends.” The top 100 assets declined by an average of approximately 2.43%, reflecting pressure on core assets. The 101–200 segment saw a mild pullback, while the 201–400 segment rose against the trend by approximately +3.6% to +7.1%, making it the most prominent range in terms of relative returns during this cycle. The tail segment (ranked 401–500) weakened again, with an average decline of 0.2%. Overall, small- and mid-cap assets demonstrated higher elasticity and stronger capital absorption capacity during this period of market volatility.
At the individual token level, this structure is further confirmed: the top gainers were primarily dominated by high-beta small- and mid-cap tokens, reflecting capital preference for short-term elasticity and narrative-driven opportunities; meanwhile, the top losers were concentrated among previously high-performing, high-volatility assets, which experienced significant pullbacks. Even within the top 100 by market cap, divergence was evident—some AI and infrastructure narrative-driven assets still recorded positive returns, while previously crowded popular tokens underwent deeper corrections. Overall, this cycle was not characterized by a uniform decline, but rather by a typical “liquidity rotation within a zero-sum market.”
> Note: Market capitalization distribution is based on CoinGecko data. The top 500 tokens are grouped into intervals of 100 (e.g., ranks 1–100, 101–200, etc.). The price changes of tokens within each group are calculated over the period from March 1 to March 31, 2026, and the average value of each group is used as the representative return for that market cap segment.
>
2.1 Top Gainers and Losers Ranking
2.1.1 Top Gainers: High-Beta Small- and Mid-Cap Assets Dominate, Structural Trend Continues
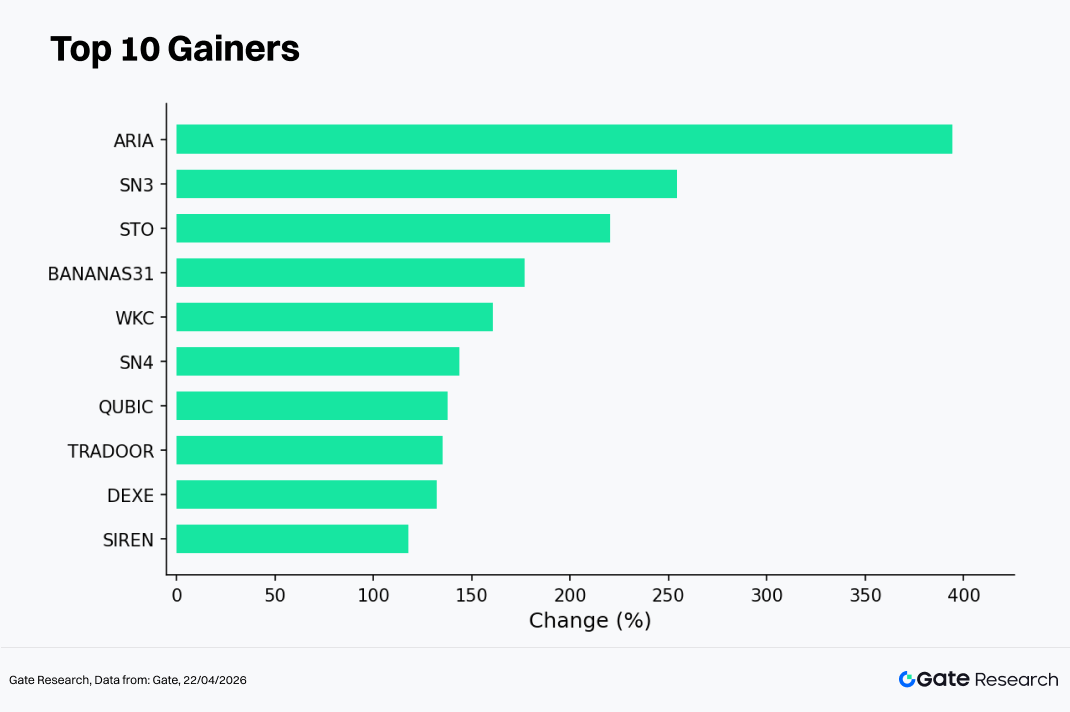
The top gainers list, ranked by hourly data, shows that in an overall weak and volatile market environment, capital continued to concentrate on high-elasticity assets, sustaining the structural trend characterized by “small- and mid-cap + narrative-driven” dynamics. The leading tokens in March included ARIA (+394.12%), SN3 (+254.30%), STO (+220.18%), BANANAS31 (+176.93%), and WKC (+160.85%), all significantly outperforming the market average and exhibiting typical high-beta characteristics.
From a driving factors perspective, the rally in this cycle was mainly concentrated in three key dynamics:
-
Narrative and thematic drivers: Certain tokens built narratives around AI, on-chain infrastructure, or emerging protocols, which allowed them to attract capital more easily in the absence of a unified market theme;
-
Small market cap amplification effect: Most of the tokens on the list have relatively small circulating supplies, making them more susceptible to rapid price appreciation during periods of marginal liquidity recovery;
-
Short-term capital rotation: In a weak and range-bound environment for major assets, trading capital tended to rotate into high-volatility tokens to capture excess returns.
In addition, SN4 (+143.81%), QUBIC (+137.58%), TRADOOR (+135.26%), DEXE (+132.14%), and SIREN (+117.95%) also recorded gains exceeding 100%, further reinforcing the structural characteristics of the market. Overall, the top gainers list is highly concentrated in mid- to lower-cap assets, aligning with the observed market cap segmentation performance, and reflecting that the market remains in a liquidity rotation phase where capital seeks localized opportunities rather than driving a broad-based rally.
2.1.2 Top Losers: High-Volatility Narratives Retrace, Speculative Sentiment Rapidly Cools
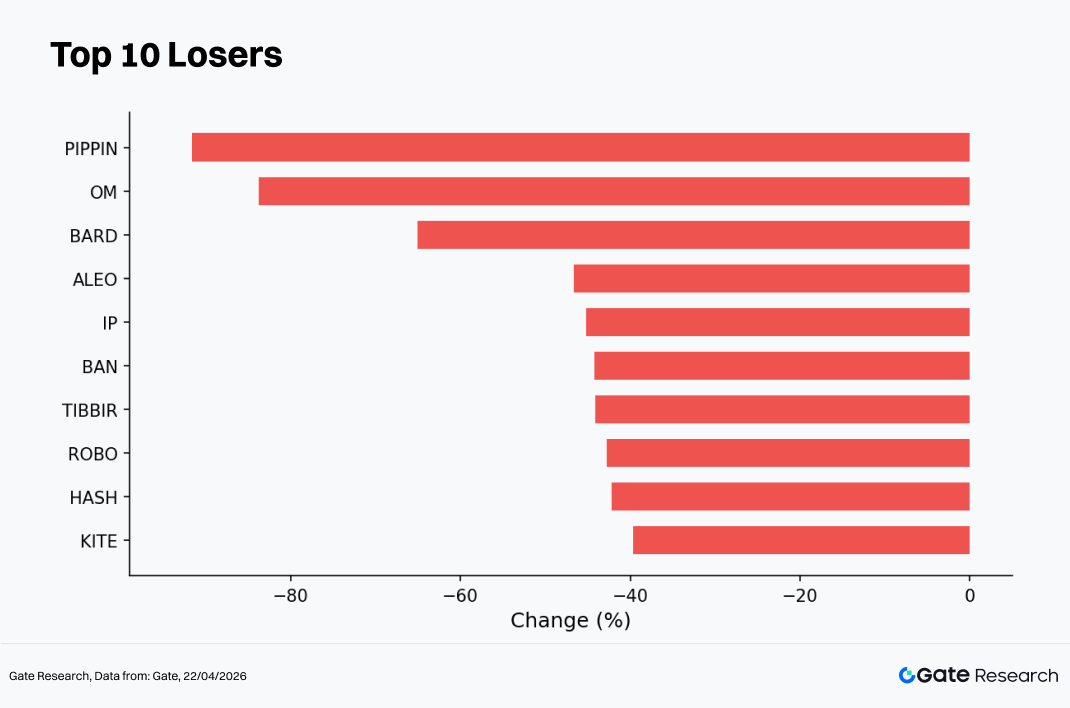
The top losers list in March shows that amid the overall market downturn, high-volatility narratives and previously strong-performing assets experienced concentrated pullbacks, reflecting a clear pattern of “sentiment cooling + valuation correction.” The tokens with the largest declines included PIPPIN (-91.64%), OM (-83.79%), BARD (-65.11%), ALEO (-46.60%), and IP (-45.22%), with some assets dropping more than 80%, significantly exceeding the market average in terms of drawdown magnitude.
Structurally, BAN (-44.24%), TIBBIR (-44.13%), ROBO (-42.76%), HASH (-42.15%), and KITE (-39.62%) also recorded substantial declines. These losses were mainly concentrated in small- and mid-cap high-beta tokens, forming a sharp contrast with the top gainers and reflecting rapid capital rotation and short-term trading dynamics.
The drivers of these declines can be summarized into three main factors:
-
Retracement of previous gains — some tokens had accumulated significant gains in earlier phases and saw concentrated profit-taking as the market weakened;
-
Liquidity contraction impact — under tightening liquidity conditions, small-cap assets are more prone to liquidity cascades and forced selling;
-
Narrative cooling and expectation reset — AI, meme, and other emerging narratives experienced rapid valuation normalization in the absence of sustained catalysts.
Overall, the top losers exhibit a typical “high-beta reversal” pattern, where assets that performed the strongest during the uptrend also suffered the most during the correction phase. This further confirms that the current market is dominated by short-term capital, lacking stable incremental inflows, which leads to amplified price volatility and intensified structural divergence.
2.2 Relationship Between Market Cap Ranking and Price Change
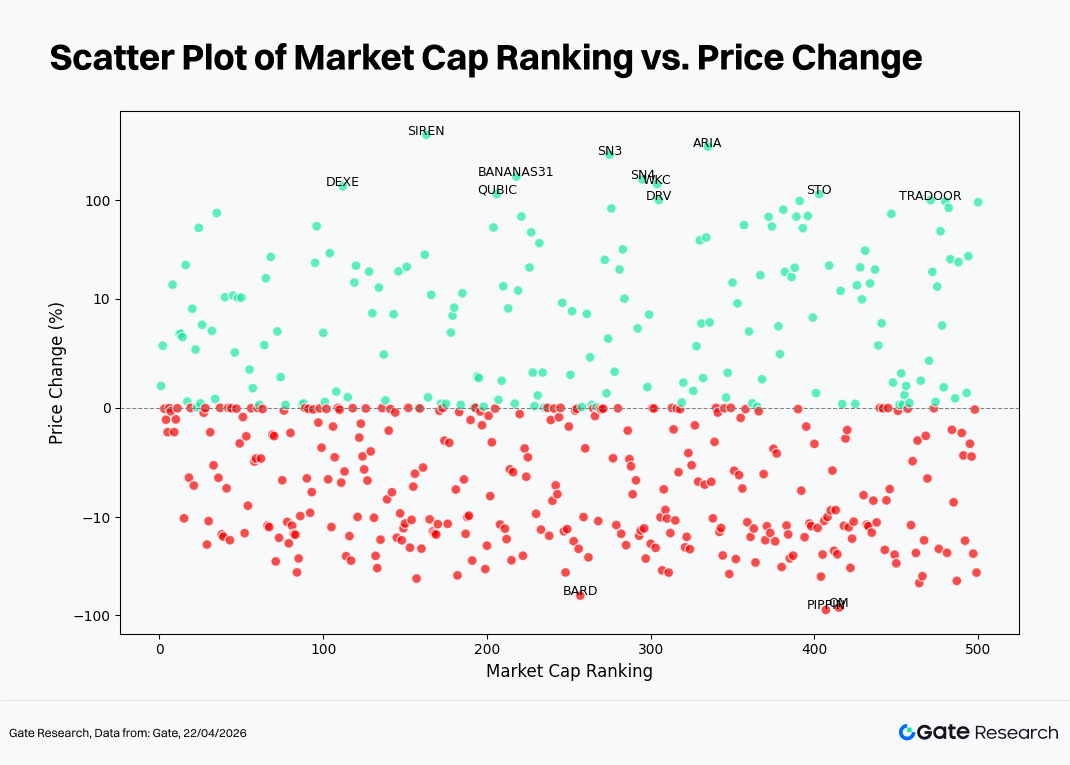
To examine the structural characteristics of token performance in this cycle, a scatter plot was constructed using the top 500 tokens by market capitalization. The x-axis represents market cap ranking (the smaller the value, the larger the market cap), and the y-axis represents price change (%) in March; green dots indicate gains, while red dots indicate losses. This chart is based on daily opening and closing prices to highlight distribution layers and extreme values; therefore, slight discrepancies may exist compared to the hourly data used in the gainers/losers tables.
First, a large number of data points are clustered around the zero axis (0%), indicating that a significant portion of assets experienced limited price changes in a volatile environment, with no clear directional trend. This is consistent with the overall monthly pattern of declining averages but relatively compressed volatility.
Second, from the distribution pattern, positive returns (green) are mainly concentrated in the mid-to-lower market cap range (approximately ranks 150–400), with a relatively high degree of dispersion. Several “spike” tokens recorded gains exceeding 100%, such as ARIA, SN3, and BANANAS31, highlighting the high elasticity and volatility of small- and mid-cap assets during capital rotation. In contrast, large-cap assets (top 100) mostly fluctuated narrowly around the zero axis, with limited upward breakout potential, reflecting cautious positioning by mainstream capital.
In the negative return (red) region, declines are more concentrated and skewed downward, forming a dense band particularly in the -10% to -40% range. At the same time, a few extreme downside cases (approaching -100%) are observed, primarily among mid- and lower-cap assets, indicating that tokens with weaker liquidity are more prone to cascading sell-offs during corrections.
Overall, the distribution exhibits a structure of “active mid-section, pressure at both ends”: small- and mid-cap assets provide the primary alpha opportunities but come with higher volatility and risk, while large-cap assets have entered a consolidation phase. The market remains in an environment dominated by liquidity rotation and structural reallocation rather than broad-based directional trends.
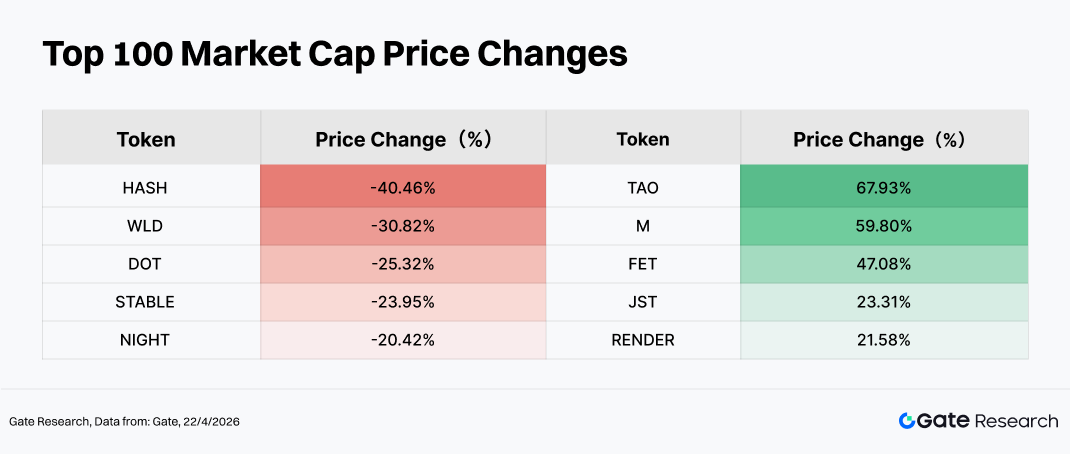
The overall performance of the top 100 assets by market capitalization was relatively weak, but with clear internal structural divergence. Among the largest decliners, HASH (-40.46%), WLD (-30.82%), and DOT (-25.32%) all recorded significant drawdowns, reflecting two main sources of pressure: first, post-rally valuation corrections following earlier overextensions, as seen in AI and identity-related narratives such as WLD, where profit-taking intensified; second, weakening ecosystem expectations or lack of catalysts, as in the case of DOT, which faced pressure amid fading cross-chain narrative momentum. In addition, STABLE (-23.95%) experienced a relatively large pullback due to approximately $29.97 million in token unlocks and reward distributions in the previous month, which created short-term selling pressure.
On the other hand, top performers such as TAO (+67.93%), M (+59.80%), FET (+47.08%), and RENDER (+21.58%) were concentrated in the AI and compute infrastructure narrative, indicating that capital continued to allocate toward a limited number of high-growth sectors even in a volatile market environment. TAO and FET benefited from sustained strengthening of AI narratives and renewed market attention, while RENDER was supported by expectations of growing demand for decentralized compute resources. The gain in JST (+23.31%) was more closely related to capital inflows into the DeFi ecosystem and demand for stable yield strategies.
Overall, in the absence of a clear macro narrative, capital showed a preference for structural allocation toward sectors with strong narrative support, while simultaneously taking profits and rotating out of previously crowded trades.
3. Analysis of Volume Expansion in This Cycle
3.1 Trading Volume Growth Analysis
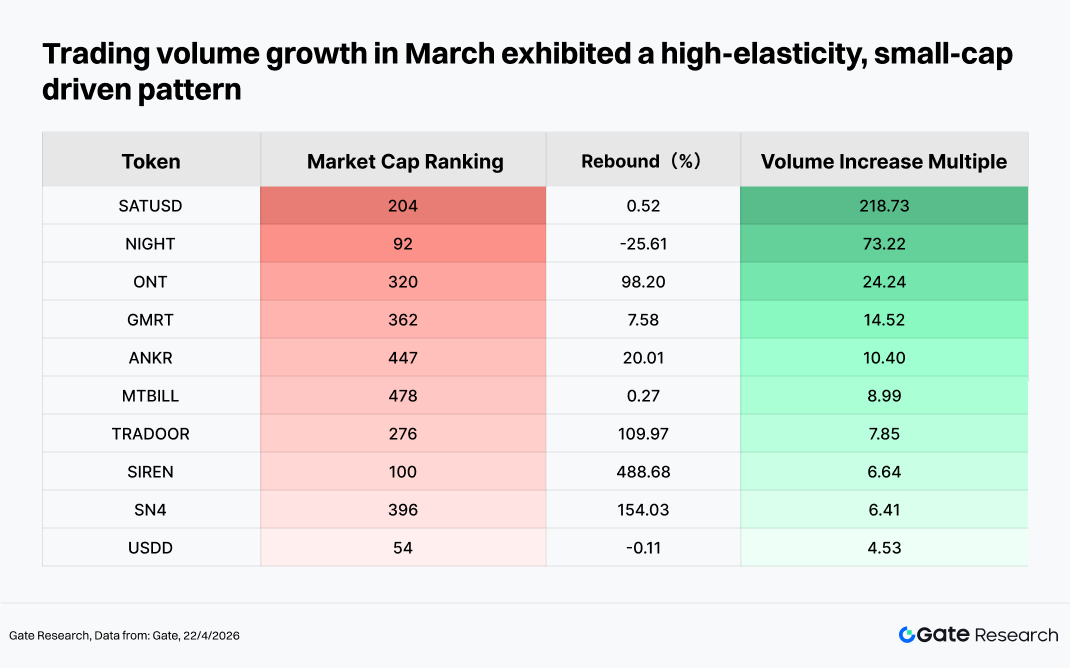
In March, trading volume growth exhibited a clear pattern driven by high-elasticity small-cap assets combined with event-driven capital flows. Among the leading performers, SIREN (+488%), SN4 (+154%), and TRADOOR (+110%) stood out, indicating that capital showed a preference for low market cap, high-volatility assets for speculative trading. Meanwhile, ONT recorded a nearly 100% rebound alongside significant volume expansion, reflecting a recovery driven by narrative catalysts or capital rotation.
On the other hand, NIGHT displayed a divergence where price declined despite a sharp increase in trading volume, suggesting notable capital outflows or intensified turnover. It is also worth noting that SATUSD saw trading volume surge by over 200%, while its price gains remained limited, indicating that the activity was primarily driven by short-term trading rather than sustained capital inflows. Overall, market capital remains concentrated in short-cycle trading of high-beta assets, and trend-following capital has not yet fully returned.
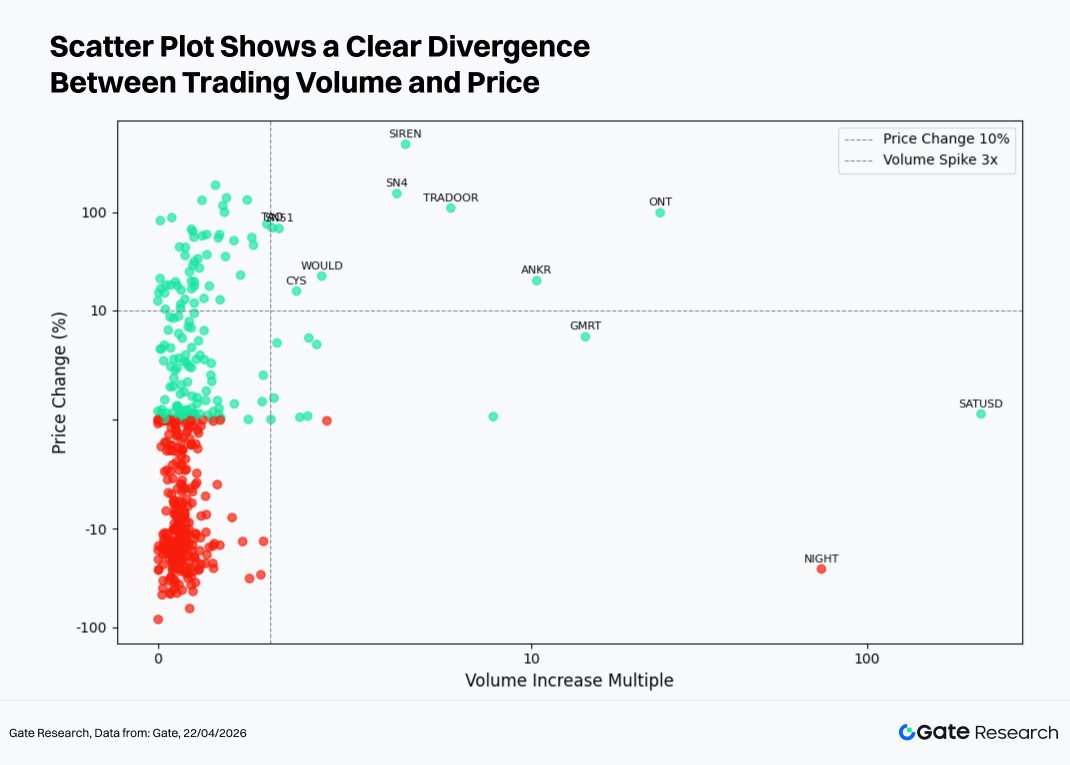
Building on the observation of abnormal volume activity, this section further combines price performance to construct a scatter plot of Volume Increase Multiple versus Price Change (%). The x-axis represents the multiple increase in trading volume over the past two weeks relative to a baseline period, while the y-axis represents the corresponding price change percentage. A symmetric logarithmic scale is applied to clearly present the structural relationship between “volume expansion” and “price movement.”
From the scatter distribution, most assets are clustered in the region characterized by “low volume increase + small price changes,” indicating that the market remains dominated by liquidity rotation, with only a limited number of tokens attracting significant capital attention. In the high volume expansion region on the right side, SATUSD recorded over a 200x increase in trading volume but limited price gains, suggesting dominance of high-frequency trading or short-term speculation; in contrast, ONT, SN4, and TRADOOR exhibited both strong volume expansion and price appreciation, representing typical capital-driven rallies.
Conversely, NIGHT experienced a sharp price decline despite increased trading volume, reflecting selling pressure and capital outflows. At the upper end, SIREN recorded extremely high price gains but relatively limited volume expansion, indicating that its movement was more event-driven in nature. Overall, there is no broad-based resonance between volume and price, and the market remains in a phase of structural rotation.
3.3 Correlation Analysis
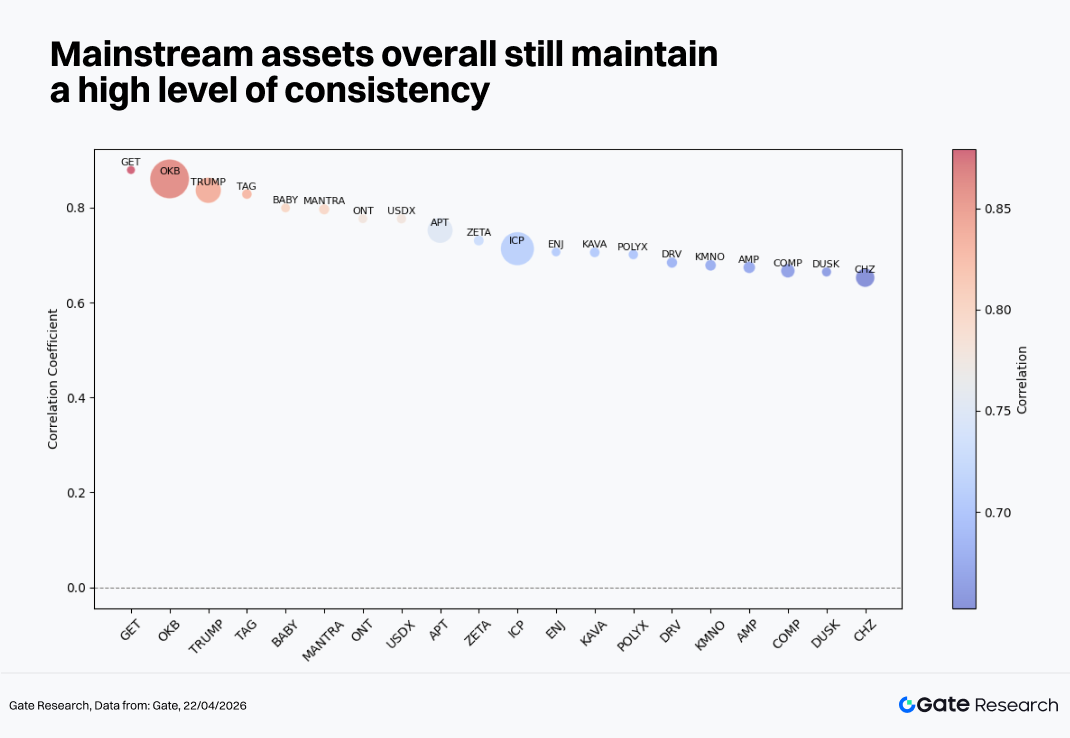
Following the examination of the relationship between trading volume and price performance, this section further analyzes their systemic correlation from a statistical perspective. To measure the impact of capital activity on price fluctuations, the metric “trading volume growth rate divided by market cap” is used as a proxy for relative activity, and its correlation with price changes is calculated to identify which types of tokens are most sensitive to capital flows.
The correlation distribution in March shows that mainstream assets still maintain a relatively high level of consistency (in the range of 0.65–0.90), indicating that the market remains largely driven by systemic factors, with limited independent performance at the individual token level. Among them, OKB, TRUMP, and TAG exhibit correlations above 0.85, with price movements closely aligned with the broader market, reflecting that capital allocation is still concentrated around primary market trends. Mid-tier assets such as ICP, APT, and KAVA maintain correlations in the 0.70–0.75 range, representing sector rotation assets that generally follow the market but with slight differences in elasticity. At the lower end, assets such as CHZ and DUSK show correlations around 0.65, indicating a certain degree of independence or narrative-driven behavior.
Overall, the high-correlation structure suggests that the market has not yet entered a phase of full fragmentation, and Beta remains the dominant source of returns.
Reference:
-
CoinGecko, https://www.coingecko.com/
-
Gate, https://www.gate.com/trade/BTC_USDT
Gate Research is a comprehensive blockchain and cryptocurrency research platform that provides deep content for readers, including technical analysis, market insights, industry research, trend forecasting, and macroeconomic policy analysis.
Disclaimer
Investing in cryptocurrency markets involves high risk. Users are advised to conduct their own research and fully understand the nature of the assets and products before making any investment decisions. Gate is not responsible for any losses or damages arising from such decisions.