LinSenBit
Qié:1925310372
LinsenBit
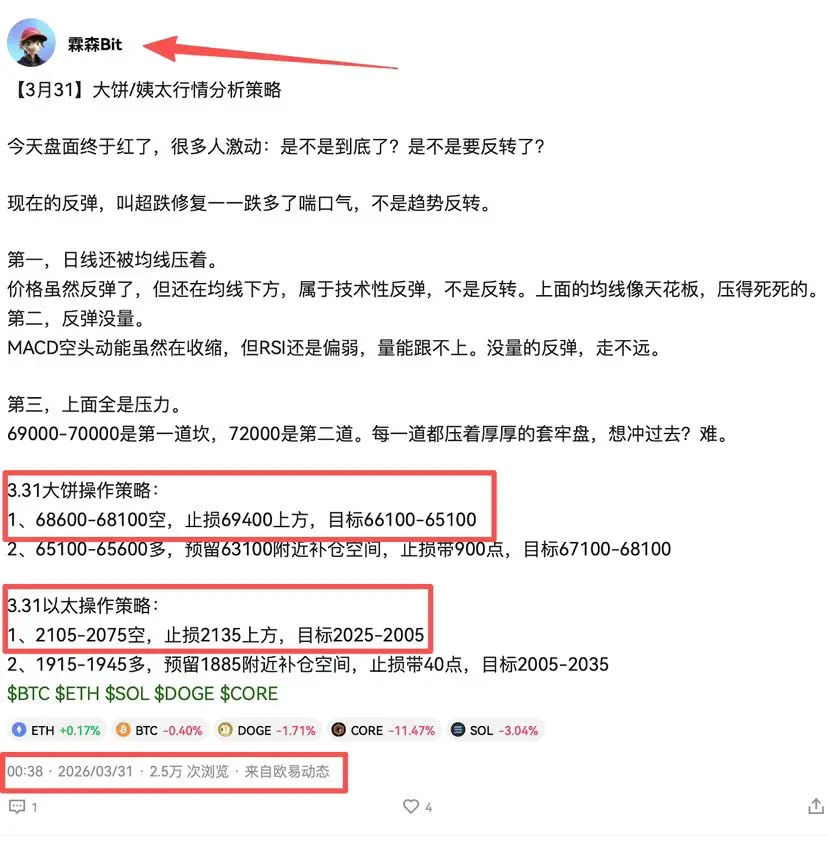
【4月21】ビットコイン/姨太行情分析戦略
兄弟たち、ビットコインは現在75500付近で行ったり来たりしており、ゆっくりと回復中だ。幸いにも大多数の強気の土台はまだ崩れていない。
日足は依然として上昇チャネル内にあり、以前の過熱状態はすべて消化され、指標は穏やかに強気に傾いている。下値の73600-73000は強気の最終的な生命線であり、これを守れば問題ない;上値の76500-77500は重い売り圧力に覆われており、短期的には急激に上昇するのは難しそうだ。
4時間足は安値から反発して温まり、売り圧力はかなり消耗されており、再びサポートラインを超えている。短期的にはゆっくりと回復しているが、反発の勢いは限定的で、高値に達すると抵抗に遭って下落しやすい。
1時間足は取引量が縮小し、買いと売りが拮抗しており、一方的なトレンドは見られない。76000をしっかりと超えた状態であれば上昇の勢いが続くが、75000を割ると74000の防衛ラインを下回る可能性がある。
今日は74000-77000の範囲内で高値で売り、安値で買いを繰り返す戦略。77000付近では空売り、74000付近では買い、中間地点で様子見。
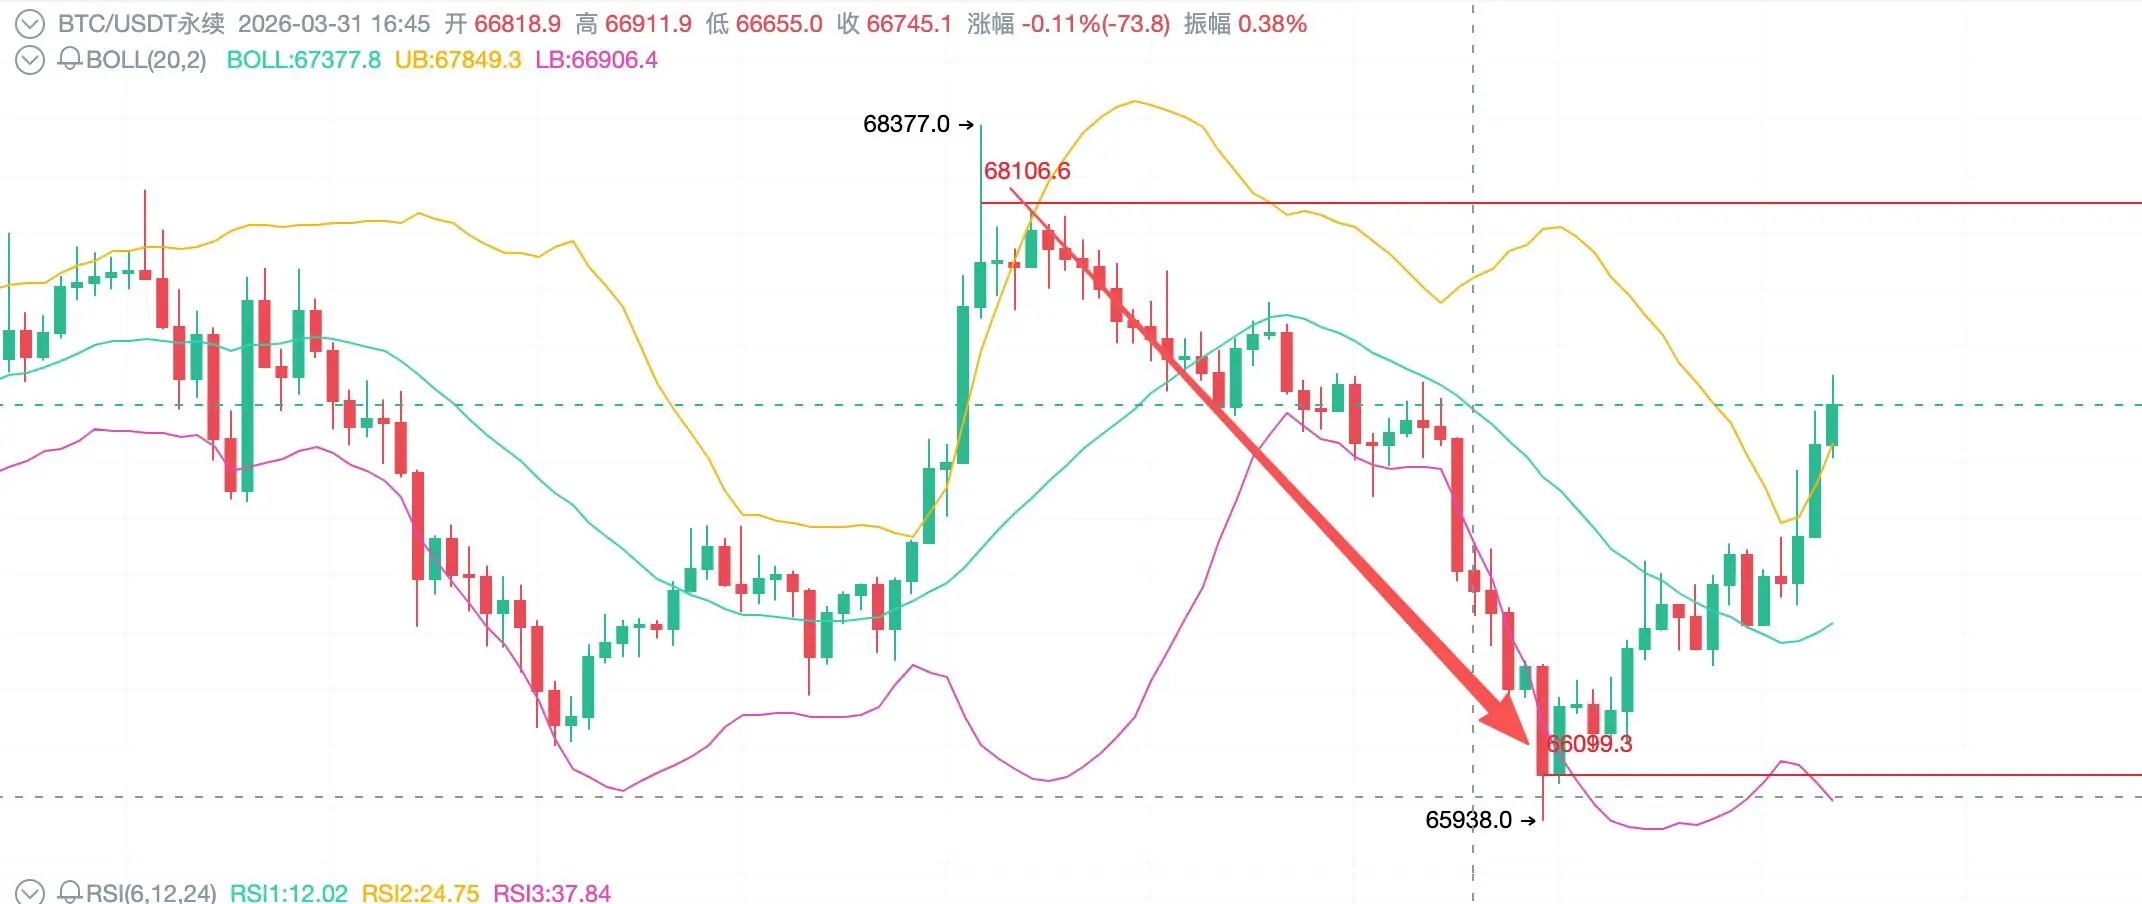
4.21ビットコイン操作戦略:
1、77200付近で空、77800を保護、目標76200付近
2、74500付近で買い、73500を保護、目標76500付近
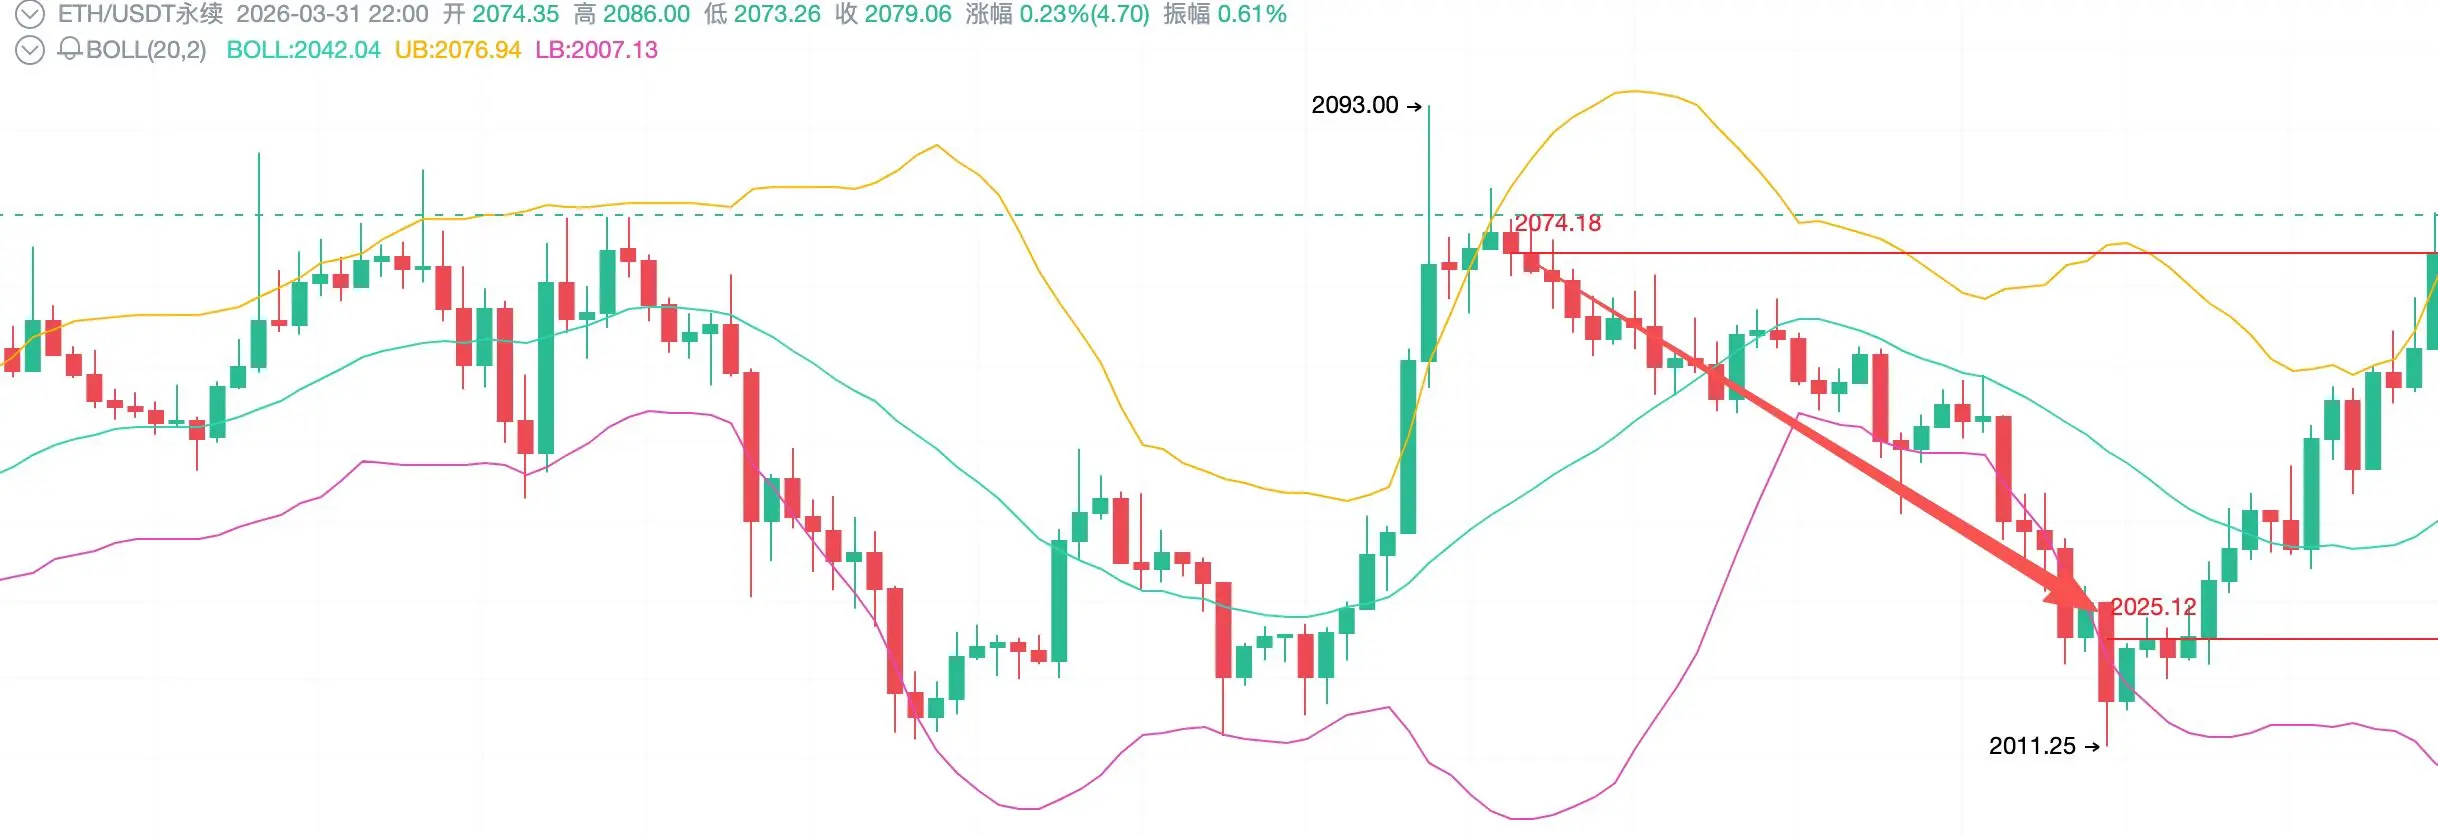
4.21イーサリアム操作戦略:
原文表示兄弟たち、ビットコインは現在75500付近で行ったり来たりしており、ゆっくりと回復中だ。幸いにも大多数の強気の土台はまだ崩れていない。
日足は依然として上昇チャネル内にあり、以前の過熱状態はすべて消化され、指標は穏やかに強気に傾いている。下値の73600-73000は強気の最終的な生命線であり、これを守れば問題ない;上値の76500-77500は重い売り圧力に覆われており、短期的には急激に上昇するのは難しそうだ。
4時間足は安値から反発して温まり、売り圧力はかなり消耗されており、再びサポートラインを超えている。短期的にはゆっくりと回復しているが、反発の勢いは限定的で、高値に達すると抵抗に遭って下落しやすい。
1時間足は取引量が縮小し、買いと売りが拮抗しており、一方的なトレンドは見られない。76000をしっかりと超えた状態であれば上昇の勢いが続くが、75000を割ると74000の防衛ラインを下回る可能性がある。
今日は74000-77000の範囲内で高値で売り、安値で買いを繰り返す戦略。77000付近では空売り、74000付近では買い、中間地点で様子見。
4.21ビットコイン操作戦略:
1、77200付近で空、77800を保護、目標76200付近
2、74500付近で買い、73500を保護、目標76500付近
4.21イーサリアム操作戦略:
- 報酬
- いいね
- コメント
- リポスト
- 共有
【4月20日】ビットコイン/姉太行情分析戦略
現在ビットコイン73600、ちょうど底値から少し反発したところで、動きは平坦になっている。日足の大きなトレンドはまだ強気崩れていないが、長く上昇しすぎて、勢いが尽き、買われ過ぎも解消された。ここ数日は正常な調整・押し戻しの段階。下値の73500-73000は依然として強気の命綱サポートライン、上値の76000は第一の高圧線であり、短期的にはここを突破できず、再び空売りを仕掛けることも可能。
4時間足:弱含みの調整、MACD死叉、弱気優勢、移動平均線が価格を抑えており、調整はまだ終わっていない。抵抗ラインに達したら追いかけないこと。
1時間足:横ばいで揉み合い、多空が膠着状態。74800を突破すれば反発継続、73600を割れば73000へ。
操作面では短期的に高空を中心に、押し目サポートを待ってからロングを検討し、買い急ぎ・売り急ぎは避けること!
4.20ビットコイン操作戦略:
1、75000付近で空売り、76200を保護ラインに、目標は73600-73000付近
2、73400付近で買い、72200を保護ラインに、目標は74500-75200付近
4.20イーサリアム操作戦略:
1、2290付近で空売り、2340を保護ラインに、目標は2235付近
2、2225付近で買い、2180を保護ラインに、目標は2290付近
$BTC $ETH #
原文表示現在ビットコイン73600、ちょうど底値から少し反発したところで、動きは平坦になっている。日足の大きなトレンドはまだ強気崩れていないが、長く上昇しすぎて、勢いが尽き、買われ過ぎも解消された。ここ数日は正常な調整・押し戻しの段階。下値の73500-73000は依然として強気の命綱サポートライン、上値の76000は第一の高圧線であり、短期的にはここを突破できず、再び空売りを仕掛けることも可能。
4時間足:弱含みの調整、MACD死叉、弱気優勢、移動平均線が価格を抑えており、調整はまだ終わっていない。抵抗ラインに達したら追いかけないこと。
1時間足:横ばいで揉み合い、多空が膠着状態。74800を突破すれば反発継続、73600を割れば73000へ。
操作面では短期的に高空を中心に、押し目サポートを待ってからロングを検討し、買い急ぎ・売り急ぎは避けること!
4.20ビットコイン操作戦略:
1、75000付近で空売り、76200を保護ラインに、目標は73600-73000付近
2、73400付近で買い、72200を保護ラインに、目標は74500-75200付近
4.20イーサリアム操作戦略:
1、2290付近で空売り、2340を保護ラインに、目標は2235付近
2、2225付近で買い、2180を保護ラインに、目標は2290付近
$BTC $ETH #
- 報酬
- いいね
- コメント
- リポスト
- 共有
【4月17日】ビットコイン/イータリアムの市場分析と戦略
数日間のレンジ相場の後、昨日やっと少し動きが出た——73600を下回り、小さな一歩を踏み出したが、すぐに引き戻された。
日足は全体的に上昇傾向だが、指標はやや買われ過ぎの兆候があり、上昇の勢いは弱まっている。
下値の73000付近は弱いサポートラインで、支えられなければ下に向かう;上値の76000付近は小さな抵抗線で、突破できなければ戻る。
4時間足は依然として上昇チャネル内だが、勢いは弱まっており、74000-75000の間で揺れながら休憩している。
1時間足は買いと売りが膠着状態——74000を下回ると73000を試しに行き、75000をしっかり超えれば再び上昇を目指す。
大局的には強気だが、無理に追いかけず、押し目待ちで買いを入れる。
上値は75500を超えなければ、空売りの高空戦略も検討できる。
短期的には引き続きレンジ内での動きを狙い、行ったり来たりの範囲内で取引する方が、一方向への賭けより安定している。
4.17ビットコインの取引戦略:
1、73500付近で買い、72200を保護ラインに、目標は75300付近
2、75500付近で売り、76500を保護ラインに、目標は73500付近
4.17イーサリアムの取引戦略:
1、2270付近で買い、2230を保護ラインに、目標は2370付近
2、2365付近で売り、241
原文表示数日間のレンジ相場の後、昨日やっと少し動きが出た——73600を下回り、小さな一歩を踏み出したが、すぐに引き戻された。
日足は全体的に上昇傾向だが、指標はやや買われ過ぎの兆候があり、上昇の勢いは弱まっている。
下値の73000付近は弱いサポートラインで、支えられなければ下に向かう;上値の76000付近は小さな抵抗線で、突破できなければ戻る。
4時間足は依然として上昇チャネル内だが、勢いは弱まっており、74000-75000の間で揺れながら休憩している。
1時間足は買いと売りが膠着状態——74000を下回ると73000を試しに行き、75000をしっかり超えれば再び上昇を目指す。
大局的には強気だが、無理に追いかけず、押し目待ちで買いを入れる。
上値は75500を超えなければ、空売りの高空戦略も検討できる。
短期的には引き続きレンジ内での動きを狙い、行ったり来たりの範囲内で取引する方が、一方向への賭けより安定している。
4.17ビットコインの取引戦略:
1、73500付近で買い、72200を保護ラインに、目標は75300付近
2、75500付近で売り、76500を保護ラインに、目標は73500付近
4.17イーサリアムの取引戦略:
1、2270付近で買い、2230を保護ラインに、目標は2370付近
2、2365付近で売り、241
- 報酬
- 1
- コメント
- リポスト
- 共有
【4月16日】大きなコイン/姨太(アシスタント)市場分析戦略
大きなコインの日足は74800付近で終わり、上の75000という壁はまだ突破できていない。依然として圧力は有効。下のサポートは73800-73000、昨日のリトライはほぼ第一サポート付近で止まった。4時間足では、大きなコインは2回目の76000に触れたが、押し戻されている。現在の圧力は75500-76000、下のサポートは74000-73000。
姨太(アシスタント)の日足は2358付近で終わり、上の2360-2400の圧力ゾーンはまだ突破していない。下のサポートは2300-2280。4時間足でも2回目の2400への上昇を試みたが押し戻された。圧力は2380-2400、サポートは2300-2250。
両者とも圧力帯付近で揉み合っており、2回の上昇も突破できず、下落もサポート付近で耐えている。今はレンジ内の動きで、上下ともに突破していない状態。操作としては高値追いは避け、リトライしてサポート付近で買い増しを検討、または圧力突破を待って追撃。中間付近では様子見が良い。
4.16大きなコインの操作戦略
75300付近で空売り、76200を保護、目標74200付近
73800付近で買い、72800を保護、目標75100付近
4.16姨太の操作戦略
2370付近で空売り、2410を保護、目標2300付近
2260付近で買い、224
原文表示大きなコインの日足は74800付近で終わり、上の75000という壁はまだ突破できていない。依然として圧力は有効。下のサポートは73800-73000、昨日のリトライはほぼ第一サポート付近で止まった。4時間足では、大きなコインは2回目の76000に触れたが、押し戻されている。現在の圧力は75500-76000、下のサポートは74000-73000。
姨太(アシスタント)の日足は2358付近で終わり、上の2360-2400の圧力ゾーンはまだ突破していない。下のサポートは2300-2280。4時間足でも2回目の2400への上昇を試みたが押し戻された。圧力は2380-2400、サポートは2300-2250。
両者とも圧力帯付近で揉み合っており、2回の上昇も突破できず、下落もサポート付近で耐えている。今はレンジ内の動きで、上下ともに突破していない状態。操作としては高値追いは避け、リトライしてサポート付近で買い増しを検討、または圧力突破を待って追撃。中間付近では様子見が良い。
4.16大きなコインの操作戦略
75300付近で空売り、76200を保護、目標74200付近
73800付近で買い、72800を保護、目標75100付近
4.16姨太の操作戦略
2370付近で空売り、2410を保護、目標2300付近
2260付近で買い、224
- 報酬
- いいね
- コメント
- リポスト
- 共有
一波の取引を終えた後、大きなキャンバスは現在74,000付近に戻っており、無理に押し下げたりせず、ゆっくりと揺らいでいる。
慌てるな——これは上昇できなくなったわけではなく、上昇途中の静かな一休みだ。
日足は引き続き着実に上昇しており、移動平均線が価格を支え、指標も反転していない。大きなトレンドは依然として強気寄りだ。
以下の72,500〜73,000は強気の守備範囲であり、ここを割らなければ大きな問題はない。
上は76,000が次の攻めるべき山頂だ。
4時間足の上昇構造は完全に整っており、崩れていない。今はただ、上昇しすぎて少し息を整えている状態だ。
押し目買いのチャンスでもある。
1時間足はレンジ内を横ばいで動いており、方向性はまだ決まっていないが、全体的に強気の基調は変わっていない。
4月15日のビットコイン操作戦略:
1、73500付近で買い、72300を守り、目標は75500付近
2、75800付近で売り、76800を守り、目標は73500付近
4月15日のイーサリアム操作戦略:
1、2265付近で買い、2220を守り、目標は2370付近
2、2380付近で売り、2420を守り、目標は2295付近
$BTC $GT $ETH #WCTC交易赛瓜分800万USDT
原文表示慌てるな——これは上昇できなくなったわけではなく、上昇途中の静かな一休みだ。
日足は引き続き着実に上昇しており、移動平均線が価格を支え、指標も反転していない。大きなトレンドは依然として強気寄りだ。
以下の72,500〜73,000は強気の守備範囲であり、ここを割らなければ大きな問題はない。
上は76,000が次の攻めるべき山頂だ。
4時間足の上昇構造は完全に整っており、崩れていない。今はただ、上昇しすぎて少し息を整えている状態だ。
押し目買いのチャンスでもある。
1時間足はレンジ内を横ばいで動いており、方向性はまだ決まっていないが、全体的に強気の基調は変わっていない。
4月15日のビットコイン操作戦略:
1、73500付近で買い、72300を守り、目標は75500付近
2、75800付近で売り、76800を守り、目標は73500付近
4月15日のイーサリアム操作戦略:
1、2265付近で買い、2220を守り、目標は2370付近
2、2380付近で売り、2420を守り、目標は2295付近
$BTC $GT $ETH #WCTC交易赛瓜分800万USDT
- 報酬
- いいね
- コメント
- リポスト
- 共有
【4月14】ビットコイン/姉太行情戦略分析
交渉再開だが、この波を掴んだか?やはり、また交渉し直すことになった。
今の相場は米伊情勢と密接に連動しており、刺激が強い。今朝は直接74,800付近まで上昇し、幸い昨日の空売りは欲張らずに済んだ。70,800付近ですべて手放した。
なぜ手放したのか?昨日の70,500の位置で、三回試したが下がりきらなかったからだ。これは何か起こると直感した——案の定!
買い軍が大勝利だが、焦ってこの暴騰を追わないこと。買い軍は確かに勝ちすぎている。
日足は直接抵抗線を突破し、指標も絶好調。73,000は今や抵抗から鉄壁の底になり、上の75,000-76,000を突破待ちだ。
4時間足は急激に上昇しすぎているため、少し息を整える必要があるが、上昇トレンドは継続中。押し目はむしろ仕込みのチャンスだ。
1時間足は高値で揺れており、単に上昇疲れの休憩。重点は73,000-72,500付近を見守ること。ここを守り抜けば、さらに上昇し続ける可能性が高い。
4.14ビットコイン操作戦略:
1、73500付近で買い、72500を守り、目標は74800付近
2、75000付近で売り、45800を守り、目標は73500付近
4.14イーサリアム操作戦略:
1、2290付近で買い、2250を守り、目標は2380付近
2、2380付近で売り、2420を守り、目標は2290付近
原文表示交渉再開だが、この波を掴んだか?やはり、また交渉し直すことになった。
今の相場は米伊情勢と密接に連動しており、刺激が強い。今朝は直接74,800付近まで上昇し、幸い昨日の空売りは欲張らずに済んだ。70,800付近ですべて手放した。
なぜ手放したのか?昨日の70,500の位置で、三回試したが下がりきらなかったからだ。これは何か起こると直感した——案の定!
買い軍が大勝利だが、焦ってこの暴騰を追わないこと。買い軍は確かに勝ちすぎている。
日足は直接抵抗線を突破し、指標も絶好調。73,000は今や抵抗から鉄壁の底になり、上の75,000-76,000を突破待ちだ。
4時間足は急激に上昇しすぎているため、少し息を整える必要があるが、上昇トレンドは継続中。押し目はむしろ仕込みのチャンスだ。
1時間足は高値で揺れており、単に上昇疲れの休憩。重点は73,000-72,500付近を見守ること。ここを守り抜けば、さらに上昇し続ける可能性が高い。
4.14ビットコイン操作戦略:
1、73500付近で買い、72500を守り、目標は74800付近
2、75000付近で売り、45800を守り、目標は73500付近
4.14イーサリアム操作戦略:
1、2290付近で買い、2250を守り、目標は2380付近
2、2380付近で売り、2420を守り、目標は2290付近
- 報酬
- いいね
- コメント
- リポスト
- 共有
【4月13】大きなキャンドル/サイドチェーンの市場戦略分析
兄弟たち、昨日はレンジ相場で、私たちのエントリーポイントはかなり正確だったと思います。皆さん少しは利益を得たはずです。今、大きなキャンドルは71100付近を行ったり来たりしており、ちょうど叩き落とされたばかりで、まだその場で息を整えている状態です。動きは明らかに弱気です。
日足は高値圏で頭を打ち、トップ・ダイバージェンスはまだ解消されていません。MACDはデッドクロス寸前、RSIも下向きに鈍くなっています。上方の72000-72600は圧力の山積みで、壁のように阻んでいます。下方の70500は第一防衛線で、これを割ると69000以下へ一直線です。
4時間足は標準的な下降チャネルを形成し、反発は全て力不足の誘い買いに過ぎず、移動平均線にしっかり抑えられています。弱気が依然優勢です。トレンド転換を狙うには?まず72000以上でしっかり立ち位置を確保しなければなりません。そうでなければ無理に底を拾わないこと。
1時間足は狭いレンジで横ばい、疲れた売り圧力の休憩段階です。72000を超えられず、再び下値を試す可能性が高いです。
日中は引き続き高値売りを中心に、安値短期買いを補助的に行います。72000-70500の区間を注視し、どちらか突破したらその方向に順張りします。欲張らず、無理に持ちこたえず。
4.13大きなキャンドルの操作
原文表示兄弟たち、昨日はレンジ相場で、私たちのエントリーポイントはかなり正確だったと思います。皆さん少しは利益を得たはずです。今、大きなキャンドルは71100付近を行ったり来たりしており、ちょうど叩き落とされたばかりで、まだその場で息を整えている状態です。動きは明らかに弱気です。
日足は高値圏で頭を打ち、トップ・ダイバージェンスはまだ解消されていません。MACDはデッドクロス寸前、RSIも下向きに鈍くなっています。上方の72000-72600は圧力の山積みで、壁のように阻んでいます。下方の70500は第一防衛線で、これを割ると69000以下へ一直線です。
4時間足は標準的な下降チャネルを形成し、反発は全て力不足の誘い買いに過ぎず、移動平均線にしっかり抑えられています。弱気が依然優勢です。トレンド転換を狙うには?まず72000以上でしっかり立ち位置を確保しなければなりません。そうでなければ無理に底を拾わないこと。
1時間足は狭いレンジで横ばい、疲れた売り圧力の休憩段階です。72000を超えられず、再び下値を試す可能性が高いです。
日中は引き続き高値売りを中心に、安値短期買いを補助的に行います。72000-70500の区間を注視し、どちらか突破したらその方向に順張りします。欲張らず、無理に持ちこたえず。
4.13大きなキャンドルの操作
- 報酬
- いいね
- コメント
- リポスト
- 共有
【4月12日】ビットコイン/イータリアム相場分析戦略
交渉破裂、ビットコイン急落!70500は強気の最後の防衛線
米伊交渉未達成、ビットコイン下落
73000 → 71400、買い手は押しつぶされる
チャート信号:
日足トップ背離、MACDはまもなくデッドクロス
73000の強い抵抗、70500は生命線
70500割り込み → 68000を目指す
反発して高値売り、追い買いせず、72000にしっかり立つまでは底打ちしない、70500割れたら一気に売り一択、感情的な相場、まずは生き残ること。
4.12ビットコイン操作戦略:
1、72300-71500の空売り、73200以上を守る、目標71300-70400
2、70400-71200の買い、69100付近で追加入金、800ポイントの余裕を持ち、目標72100付近
4.12イーサリアム操作戦略:
1、2235-2205の空売り、2265以上を守る、目標2175-2155
2、2145-2170の買い、2090付近で追加入金、40ポイントの余裕を持ち、目標2205-2225
原文表示交渉破裂、ビットコイン急落!70500は強気の最後の防衛線
米伊交渉未達成、ビットコイン下落
73000 → 71400、買い手は押しつぶされる
チャート信号:
日足トップ背離、MACDはまもなくデッドクロス
73000の強い抵抗、70500は生命線
70500割り込み → 68000を目指す
反発して高値売り、追い買いせず、72000にしっかり立つまでは底打ちしない、70500割れたら一気に売り一択、感情的な相場、まずは生き残ること。
4.12ビットコイン操作戦略:
1、72300-71500の空売り、73200以上を守る、目標71300-70400
2、70400-71200の買い、69100付近で追加入金、800ポイントの余裕を持ち、目標72100付近
4.12イーサリアム操作戦略:
1、2235-2205の空売り、2265以上を守る、目標2175-2155
2、2145-2170の買い、2090付近で追加入金、40ポイントの余裕を持ち、目標2205-2225
- 報酬
- 1
- コメント
- リポスト
- 共有
【4月10日】ビットコイン/イーサ(イータオ)行情分析戦略
ビットコインは65000から一路上昇してきて、最近出来高を伴って72000を大きく上抜けました。いま一度押し目を作って確認しています。ボリンジャーバンドは上向きに開き、移動平均線は強気の並び、MACDの赤いヒストグラムもまだ拡大中——すべて強気のシグナルです。最も重要なのは、出来高が縮んでおらず、トップの背離も出ていないこと。つまり上昇の勢いはまだ使い切っていないということです。MA120も踏ん張っており、中期のトレンドに問題はありません。
イーサも同様で、2200を突破したあとに再確認。ボリンジャーバンドは上向きに開き、MACDの赤いヒストグラムは拡大、出来高は穏やかで、強気が優勢です。
ですので私の見解は変わりません:基本はロング(買い)、サブはショート(売り)。少し上がっただけで怖がらないでください。また小さな押し戻しで慌てないでください。トレンドが変わるまでは、持ち続ければ勝ちです。
4.10ビットコイン操作戦略
現値71900付近でロング、目標73200付近、保護71200
現値73500付近でショート、目標72400付近、保護74500
4.10イーサ操作戦略
現値2185付近でロング、目標2260付近、保護2140
現値2300付近でショート、目標2230付近、保護2260
$BTC $ETH #加密市场回升
原文表示ビットコインは65000から一路上昇してきて、最近出来高を伴って72000を大きく上抜けました。いま一度押し目を作って確認しています。ボリンジャーバンドは上向きに開き、移動平均線は強気の並び、MACDの赤いヒストグラムもまだ拡大中——すべて強気のシグナルです。最も重要なのは、出来高が縮んでおらず、トップの背離も出ていないこと。つまり上昇の勢いはまだ使い切っていないということです。MA120も踏ん張っており、中期のトレンドに問題はありません。
イーサも同様で、2200を突破したあとに再確認。ボリンジャーバンドは上向きに開き、MACDの赤いヒストグラムは拡大、出来高は穏やかで、強気が優勢です。
ですので私の見解は変わりません:基本はロング(買い)、サブはショート(売り)。少し上がっただけで怖がらないでください。また小さな押し戻しで慌てないでください。トレンドが変わるまでは、持ち続ければ勝ちです。
4.10ビットコイン操作戦略
現値71900付近でロング、目標73200付近、保護71200
現値73500付近でショート、目標72400付近、保護74500
4.10イーサ操作戦略
現値2185付近でロング、目標2260付近、保護2140
現値2300付近でショート、目標2230付近、保護2260
$BTC $ETH #加密市场回升
- 報酬
- いいね
- コメント
- リポスト
- 共有
【4月9日】大饼/姨太の夜間相場・取引戦略
相場は現在、やや弱含みでレンジが続いており、買い方と売り方が拮抗しています。価格はボリンジャーバンドの中間線に沿って推移しており、トレンド相場は終わり、うんざりするほど手強い調整のレンジ局面に入っています。このような相場は最も忍耐力を試されます。値上がり追いで買わず、値下がり追いで売らず、落ち着いて押し目(調整)を待ちましょう。焦らず慌てず、この市場で生き残ることが最も重要です!
大饼の取引戦略:70500付近で買い 保護69500 目標72800付近
姨太の取引戦略:2165付近で買い 保護2125 目標2220付近
$BTC $ETH #Gate上线Pre-IPOs
原文表示相場は現在、やや弱含みでレンジが続いており、買い方と売り方が拮抗しています。価格はボリンジャーバンドの中間線に沿って推移しており、トレンド相場は終わり、うんざりするほど手強い調整のレンジ局面に入っています。このような相場は最も忍耐力を試されます。値上がり追いで買わず、値下がり追いで売らず、落ち着いて押し目(調整)を待ちましょう。焦らず慌てず、この市場で生き残ることが最も重要です!
大饼の取引戦略:70500付近で買い 保護69500 目標72800付近
姨太の取引戦略:2165付近で買い 保護2125 目標2220付近
$BTC $ETH #Gate上线Pre-IPOs
- 報酬
- いいね
- コメント
- リポスト
- 共有
【4月7】BTC/ETHの相場・取引戦略
日足の連続上昇が終わり、長い上ヒゲの陰線が出て、トレンドが弱まり始めています。4時間足ではさらにはっきりしていて、急騰のあと連続2本の出来高を伴う陰線、その後に長いヒゲの付いた小さなK線――つまり上昇に勢いがなくなっており、買い手と売り手がぶつかり合っていますが、売り方が優勢です。
日足の長い上ヒゲの陰線は、短期の天井確認のシグナルです。4時間足のMACDはまだゼロ軸より上にありますが、DIFはすでに下向きにカーブし始めていて、赤い柱はますます短くなっています。デッドクロスはいつでも形成される状態です。出来高も出てきており、下落で出来高が増え、押し目の下げの力も小さくありません。
最初に合っている/間違っている方向の話は、実はそれほど重要ではありません。大事なのは、取れるはずのスペースをきちんと取れるかどうか?トレンドが転換するとき、タイムリーに調整できるかどうか?誰もあなたに揺るぎない確信を与えてはくれないので、あなたがポジションを握り切れないのです。誰も「トレンドが変わった」と知らせてはくれないので、あなたも方向転換できません。
4.7 BTC 取引戦略:
68300付近 ロング 67700を防護 69500付近が目標
69800付近 ショート 70300を防護 68400付近が目標
4.7 ETH 取引戦略:
2130付近 シ
原文表示日足の連続上昇が終わり、長い上ヒゲの陰線が出て、トレンドが弱まり始めています。4時間足ではさらにはっきりしていて、急騰のあと連続2本の出来高を伴う陰線、その後に長いヒゲの付いた小さなK線――つまり上昇に勢いがなくなっており、買い手と売り手がぶつかり合っていますが、売り方が優勢です。
日足の長い上ヒゲの陰線は、短期の天井確認のシグナルです。4時間足のMACDはまだゼロ軸より上にありますが、DIFはすでに下向きにカーブし始めていて、赤い柱はますます短くなっています。デッドクロスはいつでも形成される状態です。出来高も出てきており、下落で出来高が増え、押し目の下げの力も小さくありません。
最初に合っている/間違っている方向の話は、実はそれほど重要ではありません。大事なのは、取れるはずのスペースをきちんと取れるかどうか?トレンドが転換するとき、タイムリーに調整できるかどうか?誰もあなたに揺るぎない確信を与えてはくれないので、あなたがポジションを握り切れないのです。誰も「トレンドが変わった」と知らせてはくれないので、あなたも方向転換できません。
4.7 BTC 取引戦略:
68300付近 ロング 67700を防護 69500付近が目標
69800付近 ショート 70300を防護 68400付近が目標
4.7 ETH 取引戦略:
2130付近 シ
- 報酬
- いいね
- コメント
- リポスト
- 共有
【4月6】BTC/ETH相場分析戦略
兄弟たち、正直に言うと:BTCは今この位置、底でも天井でもなく、ただ人を悩ませるだけだ
日足では、移動平均線がすべて頭の上から押し付けていて、MACDの緑のヒストグラムは縮んだが、まだゴールデンクロスになっていない。RSIも冷たすぎず熱すぎずだ。下の66000が下値ラインで、これを割ったら下へ進むしかない。本当に強くするには、68000に上に立たなければならない。そうでなければ、全部がだましのリバウンドだ
4時間足は66500-68000のこのレンジの中で行ったり来たりしていて、まるで頭のないハエみたいだ。68500付近でそのまま叩き戻される。もし66500を守れなければ、さらに下を探りに行く
1時間足はちょっと上に突っ込んだだけでその後ダウンして寝てしまい、MACDの赤いヒストグラムもまだ縮んでいる。買い方は完全に勢いがなくなった。66500は短期の命綱で、これを割れれば降伏するしかない
大きな方向性はまだ弱気寄りで、小さな時間軸でも上がっていけない。底をつかんだり天井を探ったりしようとせず、このレンジ内で高値で利確して安値で買い戻す。レジスタンス付近では売り、サポート付近では買い、保護(ストップ)を忘れずに。欲張るな、耐え続けるな。生き残ることが何よりも強い
4.6 BTC操作戦略:
1、現在価格69500付近で売り(空)、保護72500、
原文表示兄弟たち、正直に言うと:BTCは今この位置、底でも天井でもなく、ただ人を悩ませるだけだ
日足では、移動平均線がすべて頭の上から押し付けていて、MACDの緑のヒストグラムは縮んだが、まだゴールデンクロスになっていない。RSIも冷たすぎず熱すぎずだ。下の66000が下値ラインで、これを割ったら下へ進むしかない。本当に強くするには、68000に上に立たなければならない。そうでなければ、全部がだましのリバウンドだ
4時間足は66500-68000のこのレンジの中で行ったり来たりしていて、まるで頭のないハエみたいだ。68500付近でそのまま叩き戻される。もし66500を守れなければ、さらに下を探りに行く
1時間足はちょっと上に突っ込んだだけでその後ダウンして寝てしまい、MACDの赤いヒストグラムもまだ縮んでいる。買い方は完全に勢いがなくなった。66500は短期の命綱で、これを割れれば降伏するしかない
大きな方向性はまだ弱気寄りで、小さな時間軸でも上がっていけない。底をつかんだり天井を探ったりしようとせず、このレンジ内で高値で利確して安値で買い戻す。レジスタンス付近では売り、サポート付近では買い、保護(ストップ)を忘れずに。欲張るな、耐え続けるな。生き残ることが何よりも強い
4.6 BTC操作戦略:
1、現在価格69500付近で売り(空)、保護72500、
- 報酬
- 1
- コメント
- リポスト
- 共有
【4月4】ビットコイン/イータリアムの市場動向と取引戦略
ビットコインの簡易分析:レンジ相場で高値売り・安値買いを繰り返し、横ばい状態が続く。買い手も売り手も満足できていない。
日足:底値圧迫、移動平均線が上値を抑える、MACDはゴールデンクロスなし、RSIは方向感なし。
重要なポイント:
66000:第一の底値ライン、割れると急落
67000:反発の壁、これを超えて初めて本格的な反発とみなす
4時間足:反発直後に押し戻され、66500をなんとか支えに、67400を超えられず
1時間足:高値圏で横ばい、66500-67500を行き来しながら揉み合い、MACDの赤柱が縮小、上昇力不足
長期サイクルは依然として低迷、短期サイクルの反発も弱い。焦らず、突破を待つ。
4.4ビットコイン取引戦略:
1、66900付近で空売り、67500を保護ラインに、ターゲットは66300付近
2、65500付近で買い、64500を保護ラインに、ターゲットは67400付近
4.4イータリアム取引戦略:
1、2075付近で空売り、2120を保護ラインに、ターゲットは2020付近
2、1980付近で買い、1940を保護ラインに、ターゲットは2060付近
$BTC $ETH $GT #Gate广场四月发帖挑战
原文表示ビットコインの簡易分析:レンジ相場で高値売り・安値買いを繰り返し、横ばい状態が続く。買い手も売り手も満足できていない。
日足:底値圧迫、移動平均線が上値を抑える、MACDはゴールデンクロスなし、RSIは方向感なし。
重要なポイント:
66000:第一の底値ライン、割れると急落
67000:反発の壁、これを超えて初めて本格的な反発とみなす
4時間足:反発直後に押し戻され、66500をなんとか支えに、67400を超えられず
1時間足:高値圏で横ばい、66500-67500を行き来しながら揉み合い、MACDの赤柱が縮小、上昇力不足
長期サイクルは依然として低迷、短期サイクルの反発も弱い。焦らず、突破を待つ。
4.4ビットコイン取引戦略:
1、66900付近で空売り、67500を保護ラインに、ターゲットは66300付近
2、65500付近で買い、64500を保護ラインに、ターゲットは67400付近
4.4イータリアム取引戦略:
1、2075付近で空売り、2120を保護ラインに、ターゲットは2020付近
2、1980付近で買い、1940を保護ラインに、ターゲットは2060付近
$BTC $ETH $GT #Gate广场四月发帖挑战
- 報酬
- 1
- コメント
- リポスト
- 共有
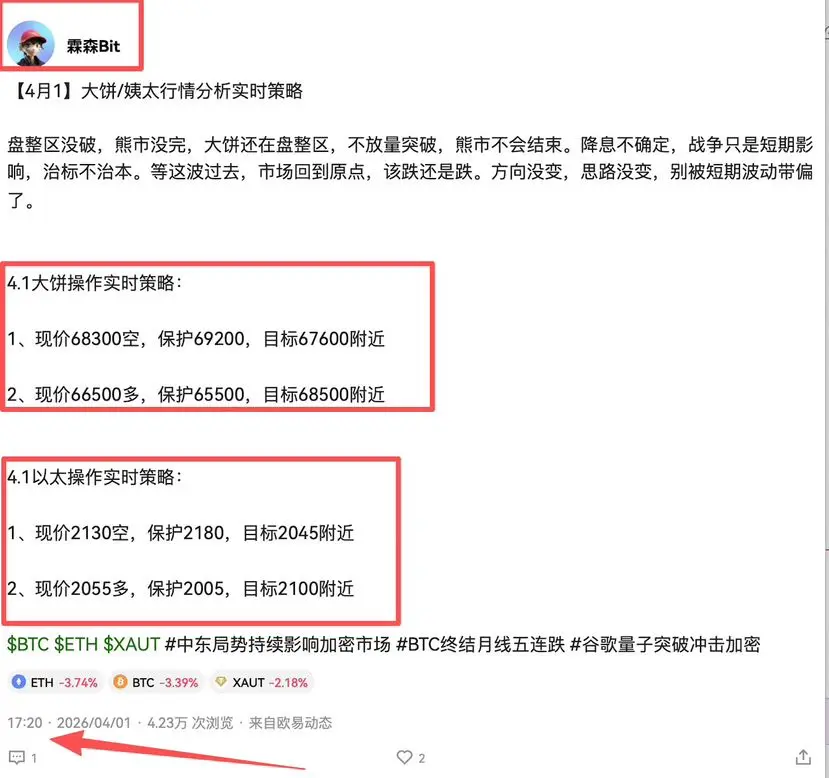
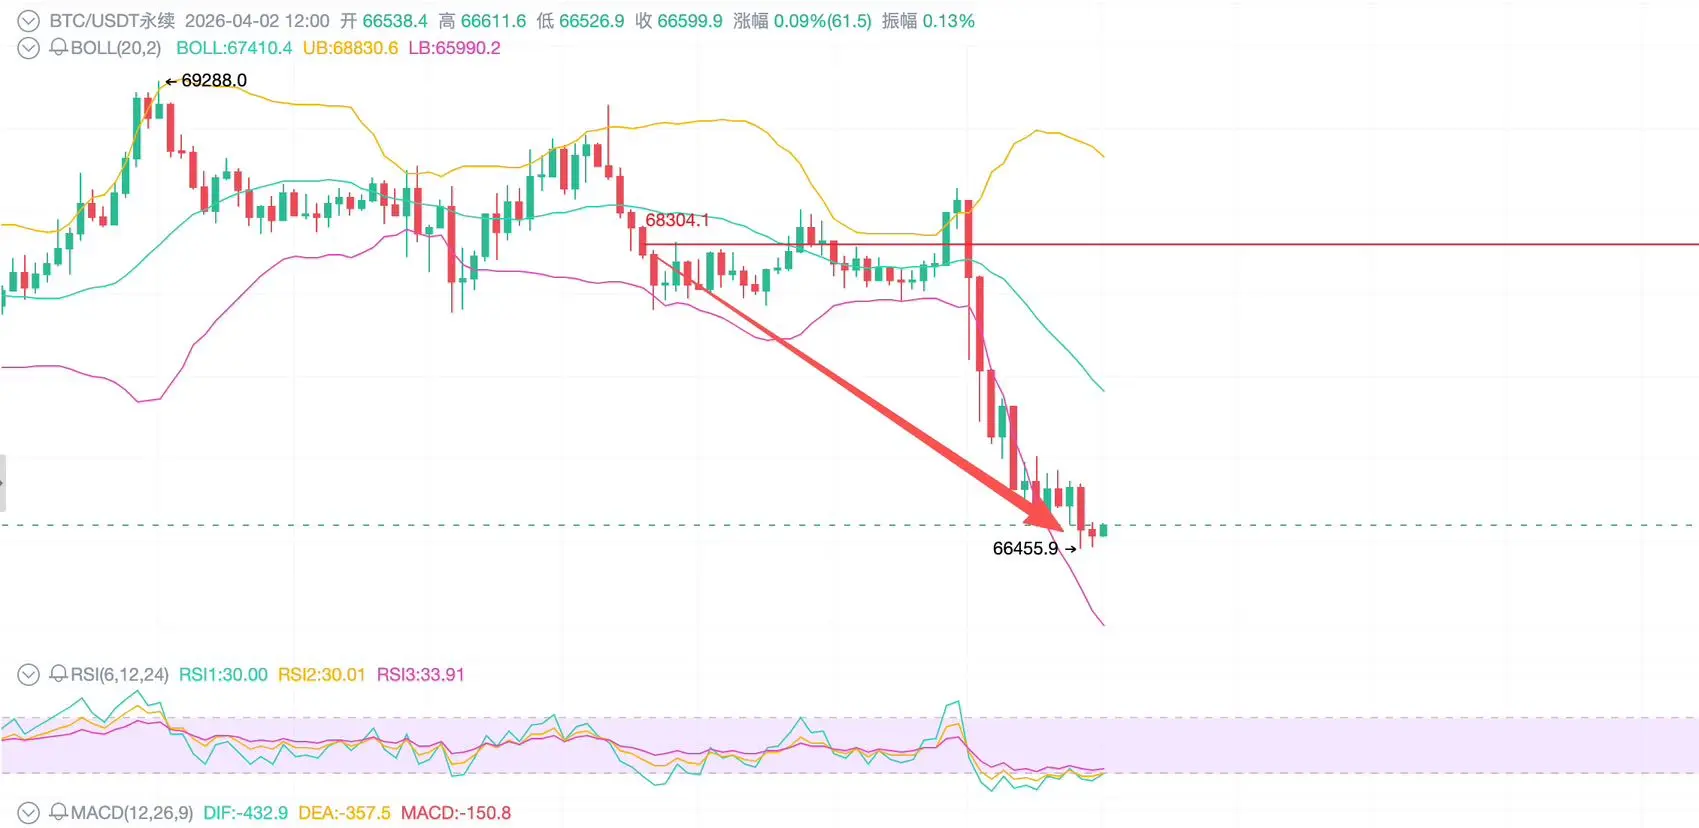
【4月1】大饼/姨太行情策略分析
大饼四小时 ボリンジャーバンドが上向きに開き始めており、天秤は強気側に傾いています。昨日は価格が下軌を下回った後に下影線をつけ、その後小さな陽線で反発し、最後に大陽線で上軌を突破しました。この形状は、強気の勢いが出てきていることを示しています。
姨太日足はMA20をしっかりと支え、MA30とMA60も下から支えています。MACDの緑柱は縮小し続けており、下向きの勢いは大きく衰え、上昇への反攻シグナルが点灯しています。
四時間足では、価格はすでにMA20とMA30を突破し、MA60の上に安定しています。MACDのゴールデンクロスで赤柱が拡大し、ボリンジャーバンドの中軌は非常に強い支えとなっており、価格はすでに上軌の上側で推移しています。短期的なトレンドは明らかに強気です。
下落はほぼ終了し、次はレンジを伴う北上の反発局面です。今後は2200付近を突破する可能性があります。以前は弱気を見ていましたが、今は方向転換すべき時です。弱者は正誤にとらわれて消耗し、強者は問題を見据えて打開策を模索しています。
4.1大饼操作戦略
現価格67300付近で買い 保護ライン66600 目標68800付近
現価格69000付近で売り 保護ライン69200 目標67700付近
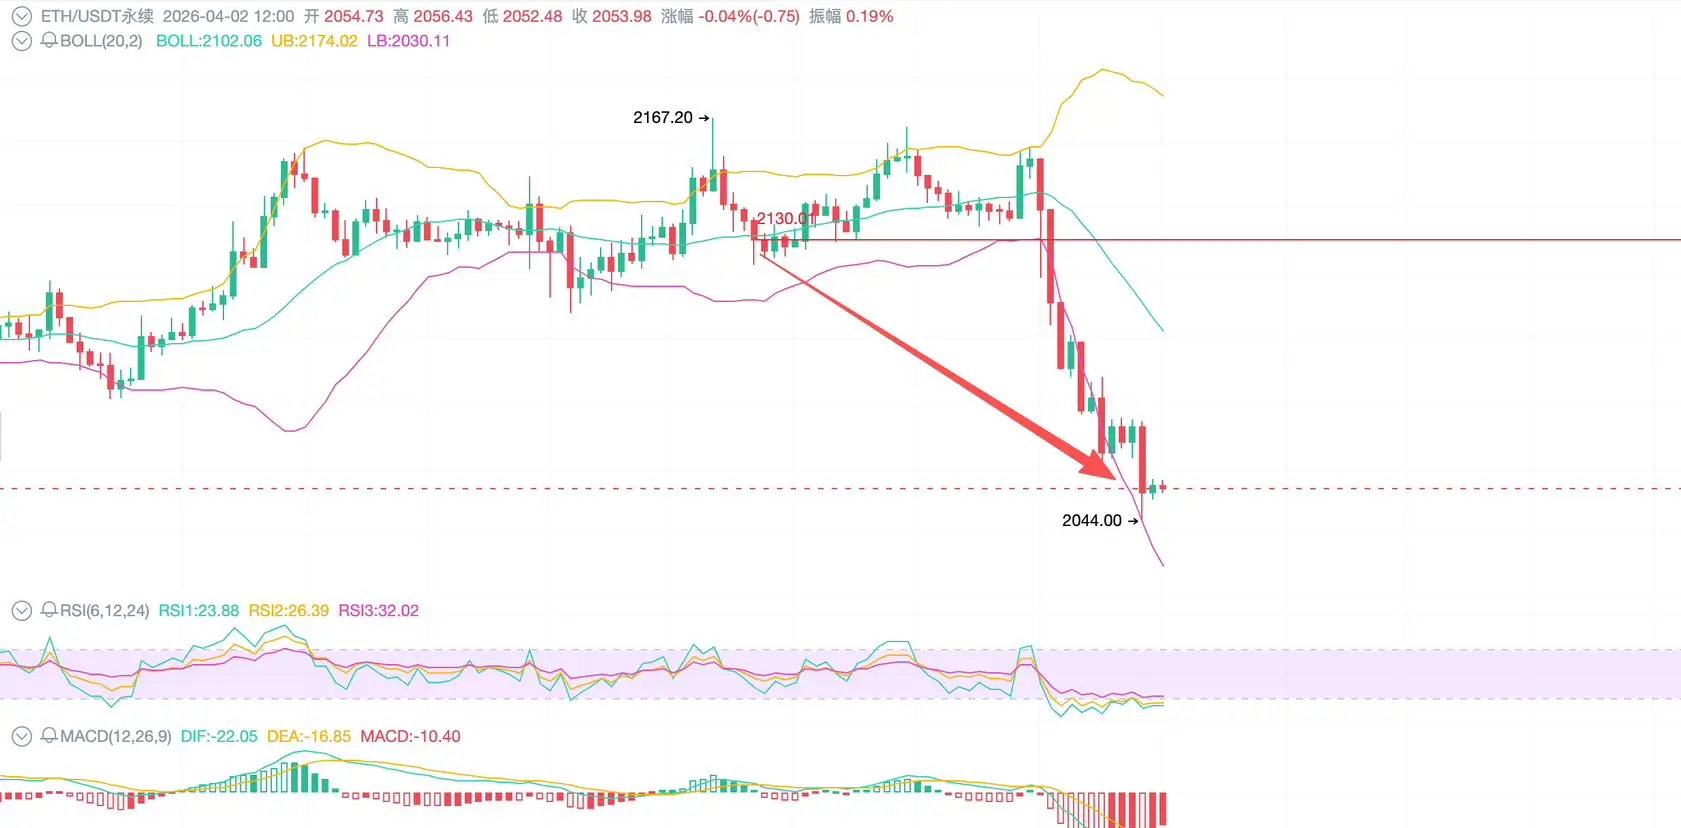
4.1姨太操作戦略
現価格2175付近で売り 保護ライン2210 目標2115付近
現価格207
原文表示大饼四小时 ボリンジャーバンドが上向きに開き始めており、天秤は強気側に傾いています。昨日は価格が下軌を下回った後に下影線をつけ、その後小さな陽線で反発し、最後に大陽線で上軌を突破しました。この形状は、強気の勢いが出てきていることを示しています。
姨太日足はMA20をしっかりと支え、MA30とMA60も下から支えています。MACDの緑柱は縮小し続けており、下向きの勢いは大きく衰え、上昇への反攻シグナルが点灯しています。
四時間足では、価格はすでにMA20とMA30を突破し、MA60の上に安定しています。MACDのゴールデンクロスで赤柱が拡大し、ボリンジャーバンドの中軌は非常に強い支えとなっており、価格はすでに上軌の上側で推移しています。短期的なトレンドは明らかに強気です。
下落はほぼ終了し、次はレンジを伴う北上の反発局面です。今後は2200付近を突破する可能性があります。以前は弱気を見ていましたが、今は方向転換すべき時です。弱者は正誤にとらわれて消耗し、強者は問題を見据えて打開策を模索しています。
4.1大饼操作戦略
現価格67300付近で買い 保護ライン66600 目標68800付近
現価格69000付近で売り 保護ライン69200 目標67700付近
4.1姨太操作戦略
現価格2175付近で売り 保護ライン2210 目標2115付近
現価格207
- 報酬
- 1
- コメント
- リポスト
- 共有
人気の話題
もっと見る288.97K 人気度
845.62K 人気度
158.4K 人気度
30.57K 人気度
868.49K 人気度
ピン