金筏
價格行為分析 歡迎喜歡PA的一起學習交流
關注必回!!
金筏
[PA 觀點] 鲍威尔放鹰,BTC 图表却在“悄悄吸筹”?(附 M5 详细诊断)
1. 宏观逆风 (Macro Headwind)
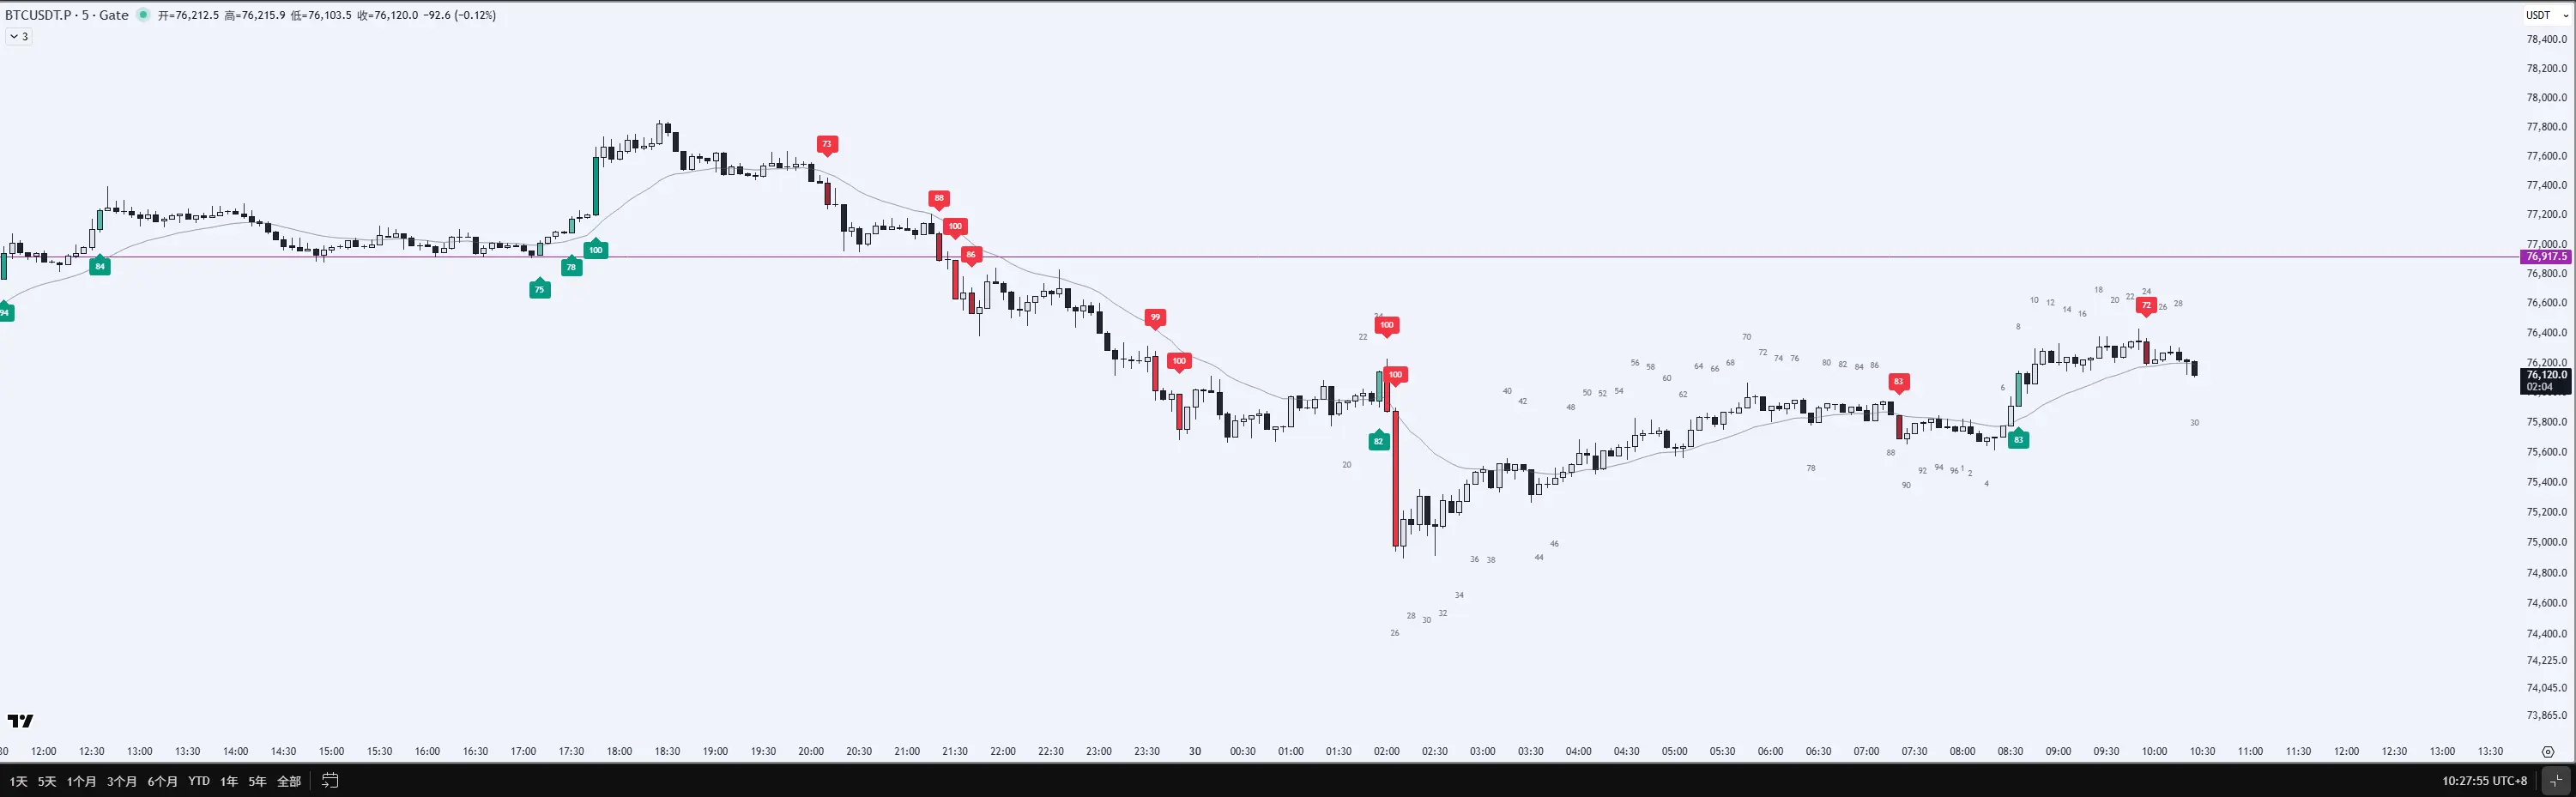
鲍威尔释放鹰派 (Hawkish) 信号,流动性预期大幅收紧。这对加密资产而言无疑是短期的 熊市 (Bearish) 冲击。2. 图表诊断 (PA Chart Diagnosis)
虽然基本面偏空,但如果我们仔细阅读这份 M5 价格行为图表(如图),会发现一些非常有意思的迹象:
·熊市趋势 (Bear Trend):图表左半部分清晰展示了由一根根 连续空头趋势棒 (Consecutive Bear Trend Bars) 推动的强烈下跌浪。当时利空正在全面兑现。
·楔形底与末端旗形 (Wedge Bottom & Final Flag):在图表底部,我们注意到了一个斜向下的楔形。
Al Brooks 的理论告诉我们,楔形 (wedge) 通常预示着 趋势过度 (Trend Overdone),反转即将来临。
·交易区间 (Trading Range):在底部反转后,价格进入了一个横向的交易区间(EMA 20 线开始走平)。在这种区间中,多空博弈激烈,任何一方都无法主导。
·当前状态 (Current State):看右侧,EMA 20 的斜率开始向上。目前正处于区间上沿博弈。
利空消息后,市场并没有出现新的 空头喷涌 (Bear Outpouring)
1. 宏观逆风 (Macro Headwind)
鲍威尔释放鹰派 (Hawkish) 信号,流动性预期大幅收紧。这对加密资产而言无疑是短期的 熊市 (Bearish) 冲击。2. 图表诊断 (PA Chart Diagnosis)
虽然基本面偏空,但如果我们仔细阅读这份 M5 价格行为图表(如图),会发现一些非常有意思的迹象:
·熊市趋势 (Bear Trend):图表左半部分清晰展示了由一根根 连续空头趋势棒 (Consecutive Bear Trend Bars) 推动的强烈下跌浪。当时利空正在全面兑现。
·楔形底与末端旗形 (Wedge Bottom & Final Flag):在图表底部,我们注意到了一个斜向下的楔形。
Al Brooks 的理论告诉我们,楔形 (wedge) 通常预示着 趋势过度 (Trend Overdone),反转即将来临。
·交易区间 (Trading Range):在底部反转后,价格进入了一个横向的交易区间(EMA 20 线开始走平)。在这种区间中,多空博弈激烈,任何一方都无法主导。
·当前状态 (Current State):看右侧,EMA 20 的斜率开始向上。目前正处于区间上沿博弈。
利空消息后,市场并没有出现新的 空头喷涌 (Bear Outpouring)
BTC-1.38%
- 打賞
- 按讚
- 回覆
- 轉發
- 分享
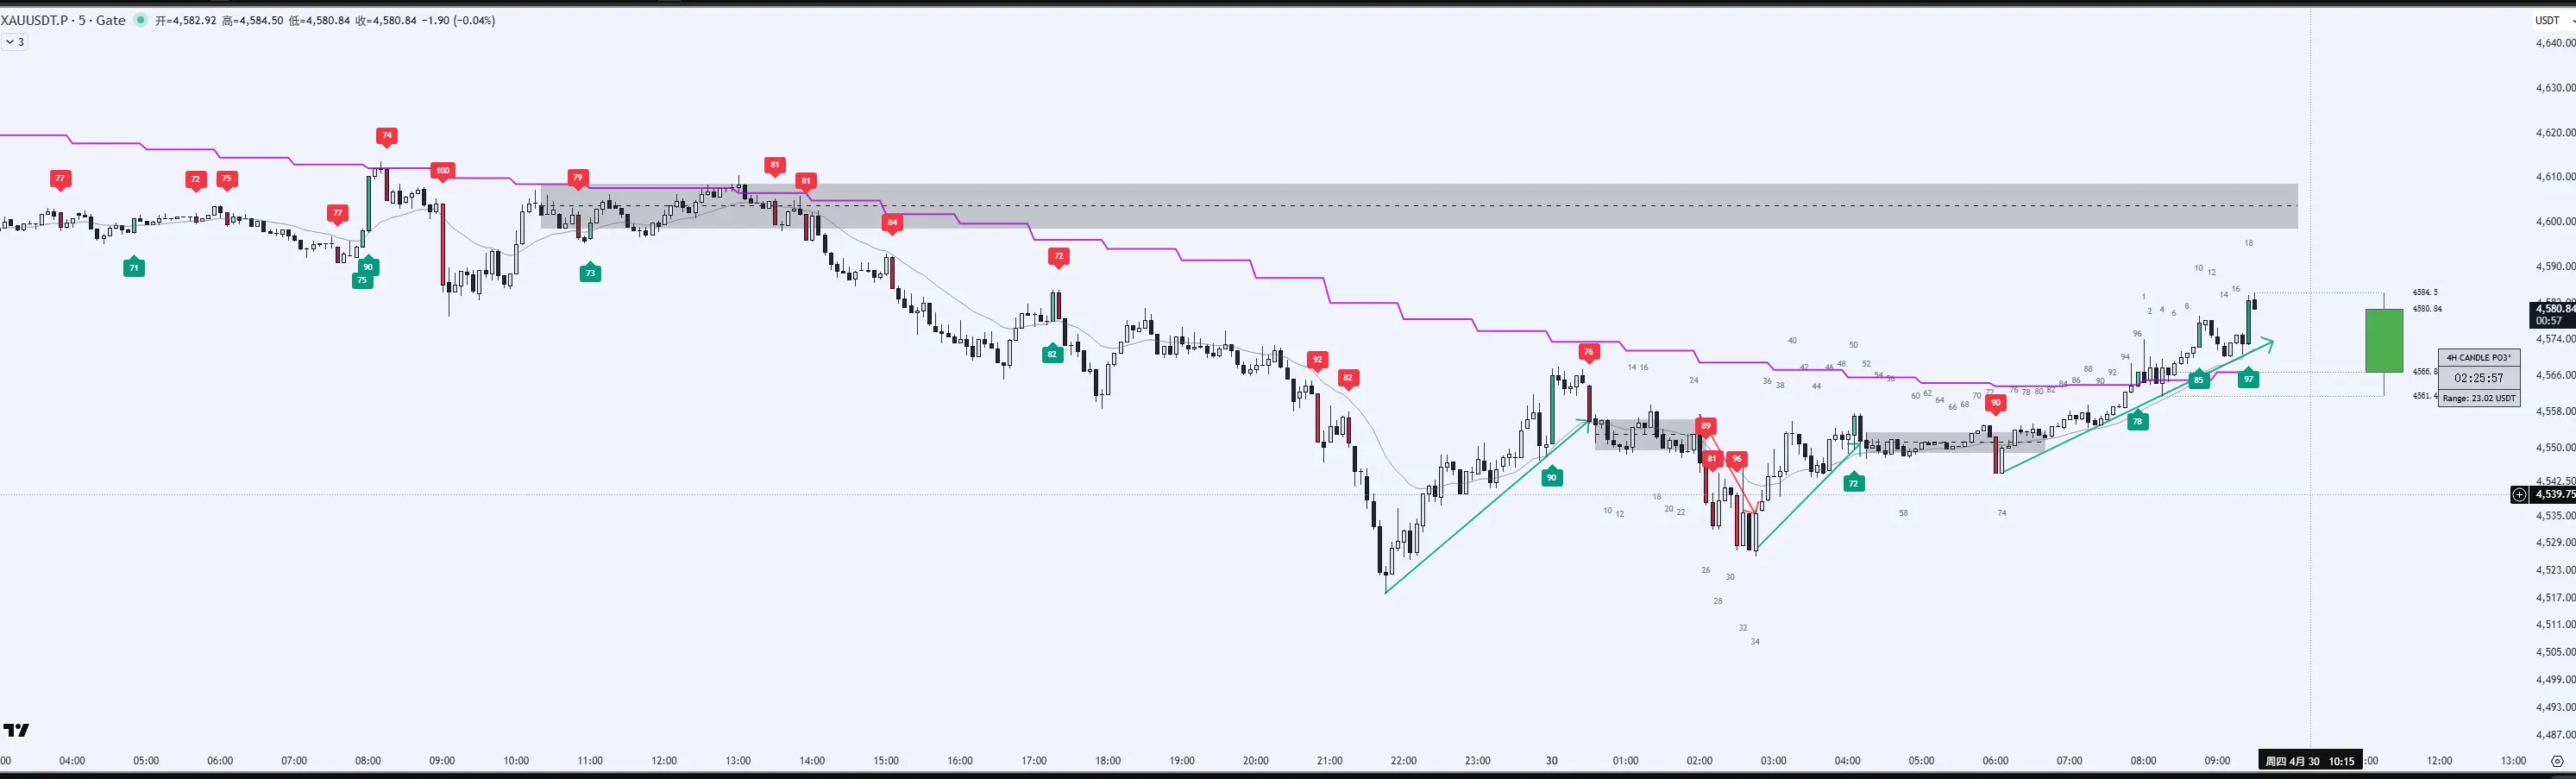
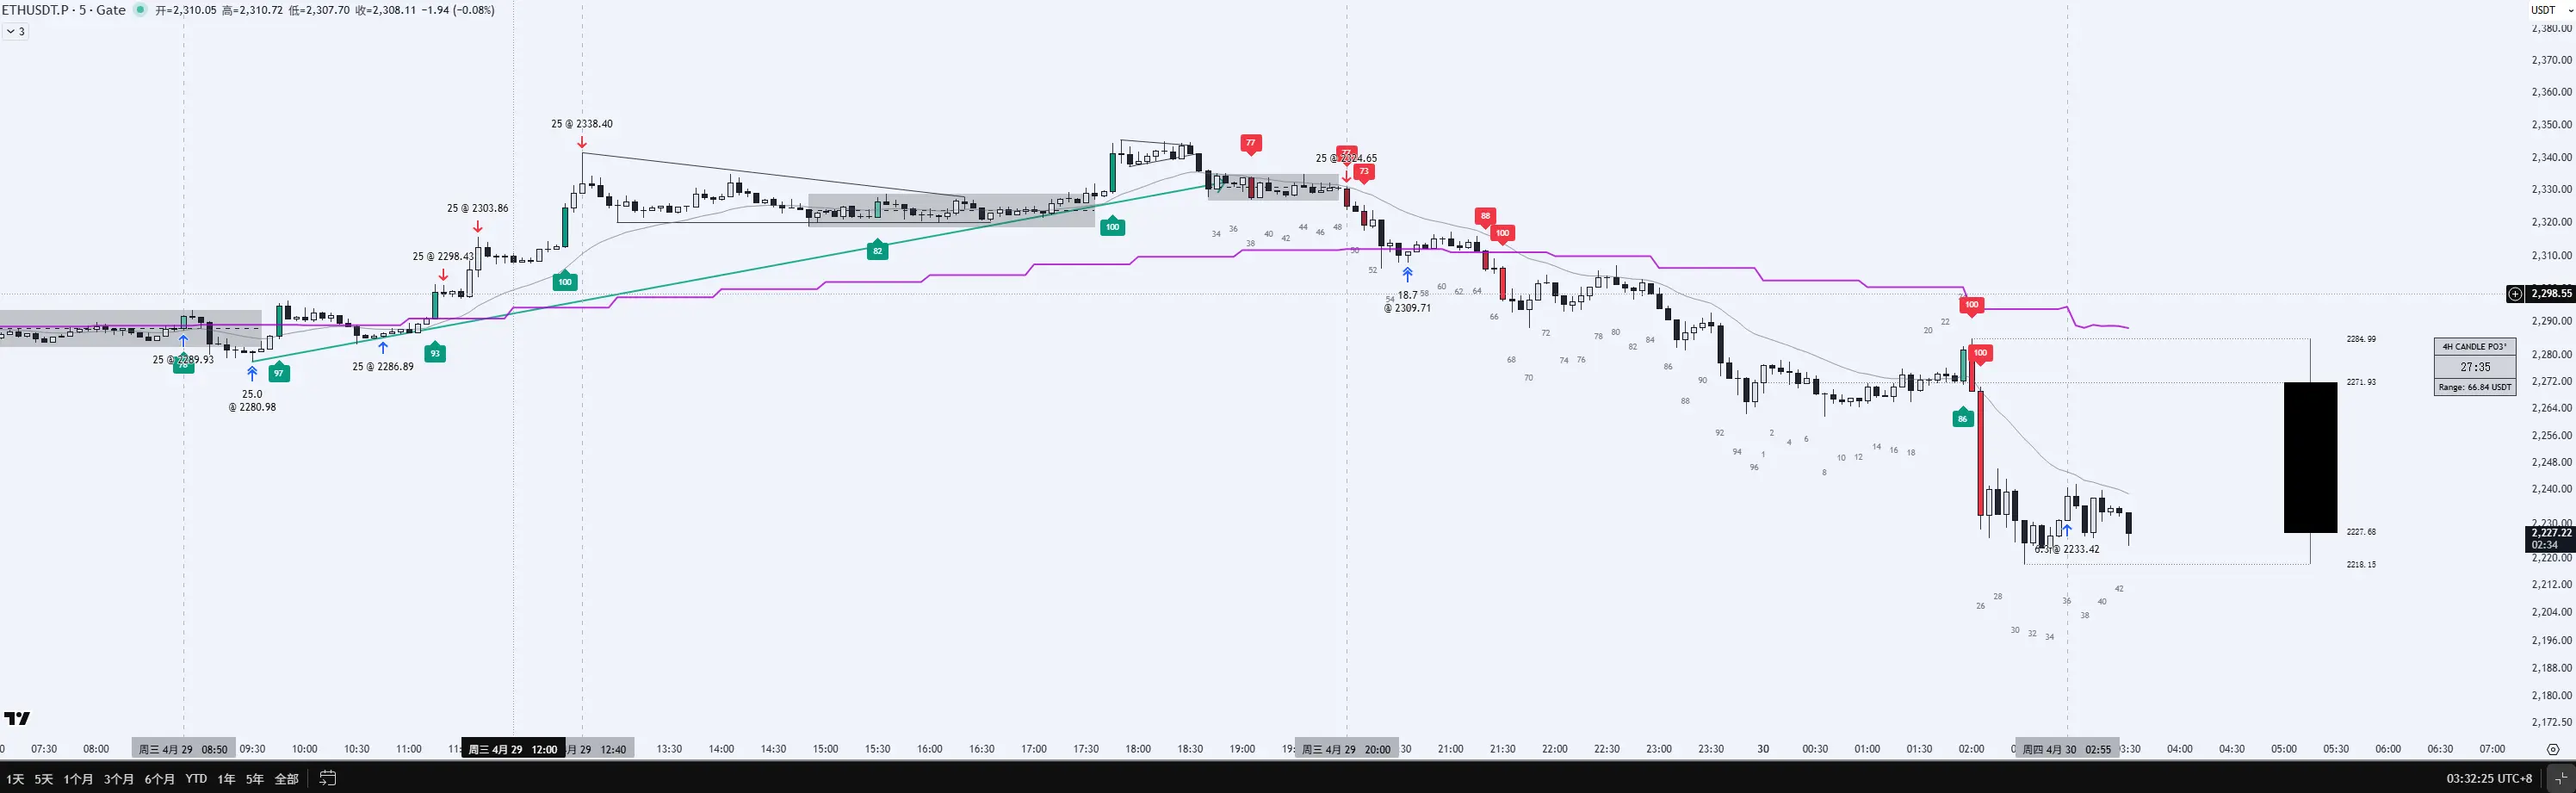
4.29-4.30ETH USDT (5分鐘)復盤總結:
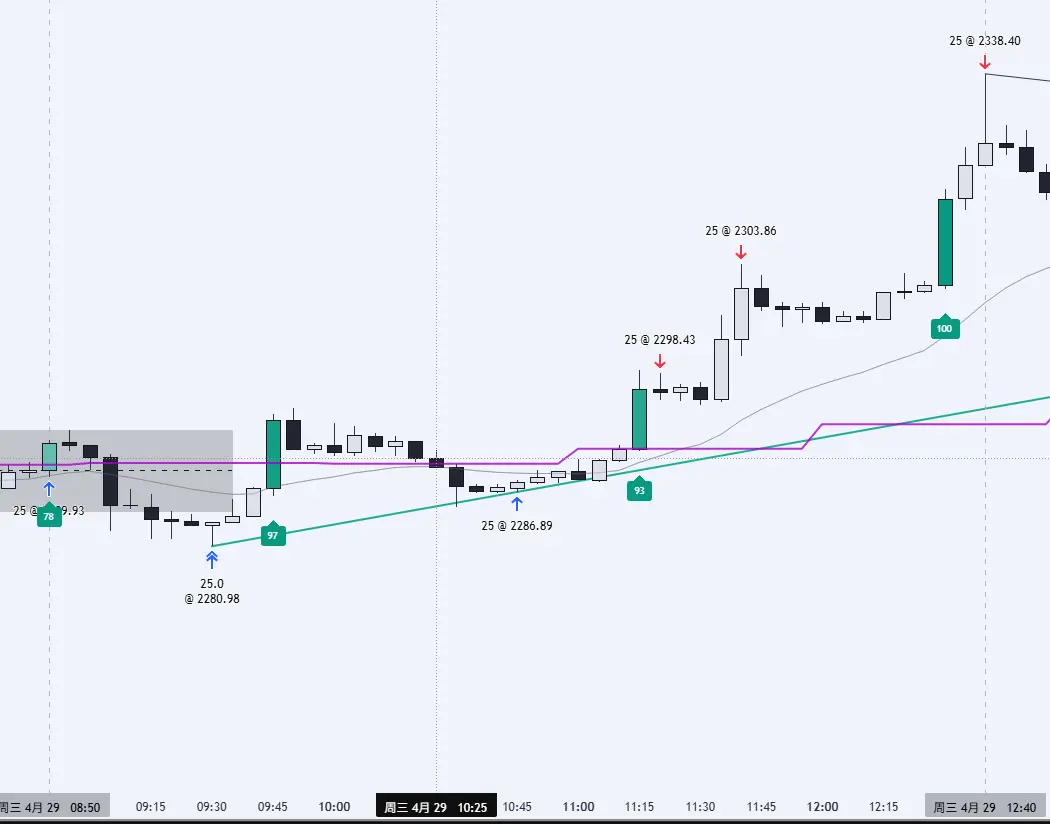
建倉(多):8:50 25張 2289.93 ,9:25 25張2280.98 ,10:45 25張2286.89
平倉:11:20 25張 2298.43 .11:40 25 張 2303.86,12:40 25張 2338.40
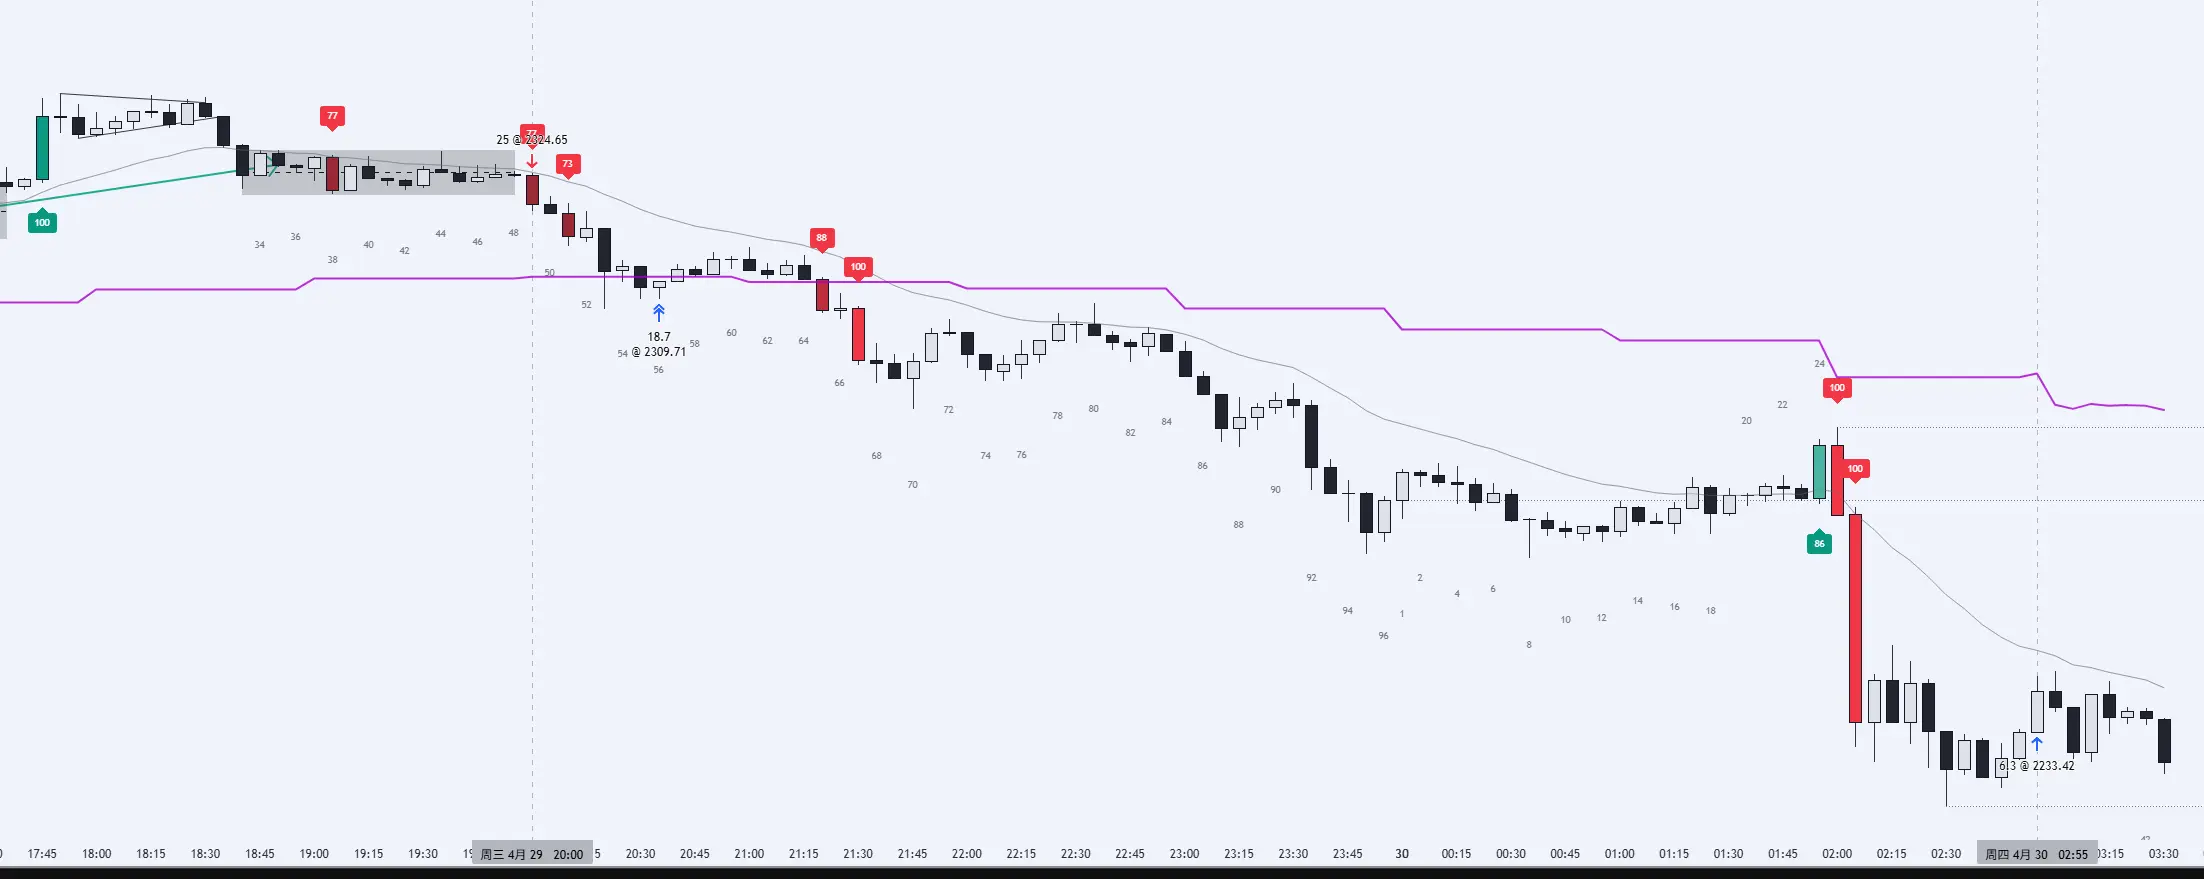
建倉(空):20:00 25張空
平倉:20:35 18.7張 2307.71 4.30 2:55 6.3張 2233.42
這是一份針對你 **ETHUSDT 5分鐘圖表** 詳細操作流程的深度導師級復盤。你今天的操作展示了對 **Trading Range (TR)** 到 **Trend (趨勢)** 轉換節奏的極佳把握。
---
## [頁面分析 - 重点標註]
你的操作路徑精准地踩在了市場的兩個核心階段:
* **第一階段:多頭增倉與止盈 (08:50 - 12:40)**
* **進場:** 在 2280 - 2289 區域(TR 底部)進行了三次補倉。這是一次非常成功的 **Scaling-in (金字塔建倉)**。
* **止盈:** 隨著價格放量突破(Bull Spike),你分三批在阻力位上方(最高 2338)離場。
* **第二階段:空頭埋伏與深潛 (20:00 - 02:55)**
* **進場:** 在 20:00 (價格約為 2324.65)
查看原文建倉(多):8:50 25張 2289.93 ,9:25 25張2280.98 ,10:45 25張2286.89
平倉:11:20 25張 2298.43 .11:40 25 張 2303.86,12:40 25張 2338.40
建倉(空):20:00 25張空
平倉:20:35 18.7張 2307.71 4.30 2:55 6.3張 2233.42
這是一份針對你 **ETHUSDT 5分鐘圖表** 詳細操作流程的深度導師級復盤。你今天的操作展示了對 **Trading Range (TR)** 到 **Trend (趨勢)** 轉換節奏的極佳把握。
---
## [頁面分析 - 重点標註]
你的操作路徑精准地踩在了市場的兩個核心階段:
* **第一階段:多頭增倉與止盈 (08:50 - 12:40)**
* **進場:** 在 2280 - 2289 區域(TR 底部)進行了三次補倉。這是一次非常成功的 **Scaling-in (金字塔建倉)**。
* **止盈:** 隨著價格放量突破(Bull Spike),你分三批在阻力位上方(最高 2338)離場。
* **第二階段:空頭埋伏與深潛 (20:00 - 02:55)**
* **進場:** 在 20:00 (價格約為 2324.65)
- 打賞
- 1
- 回覆
- 轉發
- 分享
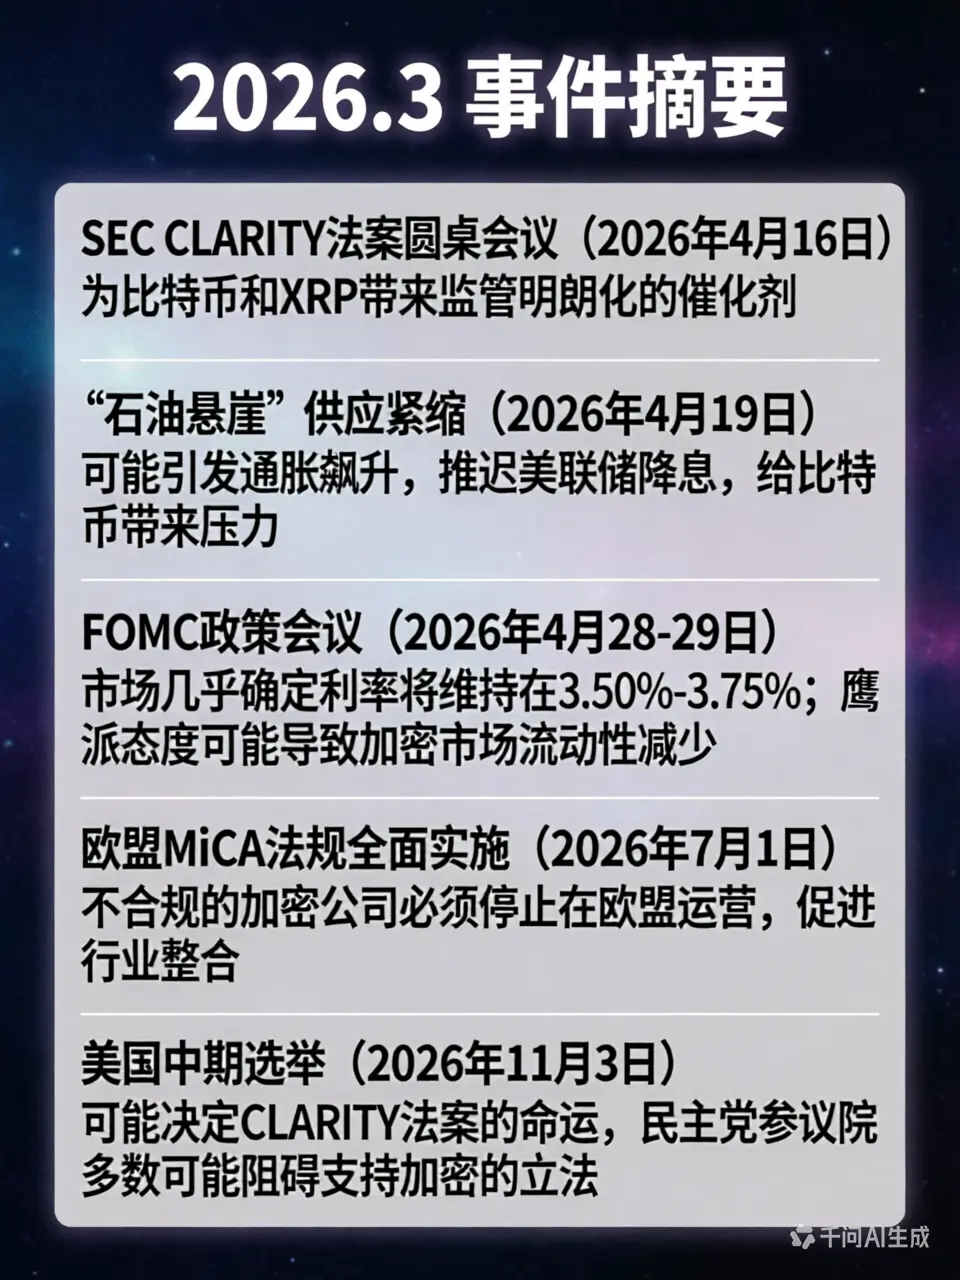
標題:2026重要事件摘要
內容:
SEC 明確法案圓桌會議(2026年4月16日) — 為比特幣和XRP帶來監管明朗化的催化劑。
“石油懸崖”供應緊縮(2026年4月19日) — 可能引發通脹飆升,推遲美聯儲降息,給比特幣帶來壓力。
FOMC政策會議(2026年4月28-29日) — 市場幾乎確定利率將維持在3.50%-3.75%;鷹派態度可能導致加密市場流動性減少。
歐盟MiCA法規全面實施(2026年7月1日) — 不合規的加密公司必須停止在歐盟運營,促進行業整合。
美國中期選舉(2026年11月3日) — 可能決定CLARITY法案的命運,民主黨參議院多數可能阻礙支持加密的立法。
#加密市场重大事件
查看原文內容:
SEC 明確法案圓桌會議(2026年4月16日) — 為比特幣和XRP帶來監管明朗化的催化劑。
“石油懸崖”供應緊縮(2026年4月19日) — 可能引發通脹飆升,推遲美聯儲降息,給比特幣帶來壓力。
FOMC政策會議(2026年4月28-29日) — 市場幾乎確定利率將維持在3.50%-3.75%;鷹派態度可能導致加密市場流動性減少。
歐盟MiCA法規全面實施(2026年7月1日) — 不合規的加密公司必須停止在歐盟運營,促進行業整合。
美國中期選舉(2026年11月3日) — 可能決定CLARITY法案的命運,民主黨參議院多數可能阻礙支持加密的立法。
#加密市场重大事件
- 打賞
- 2
- 回覆
- 轉發
- 分享
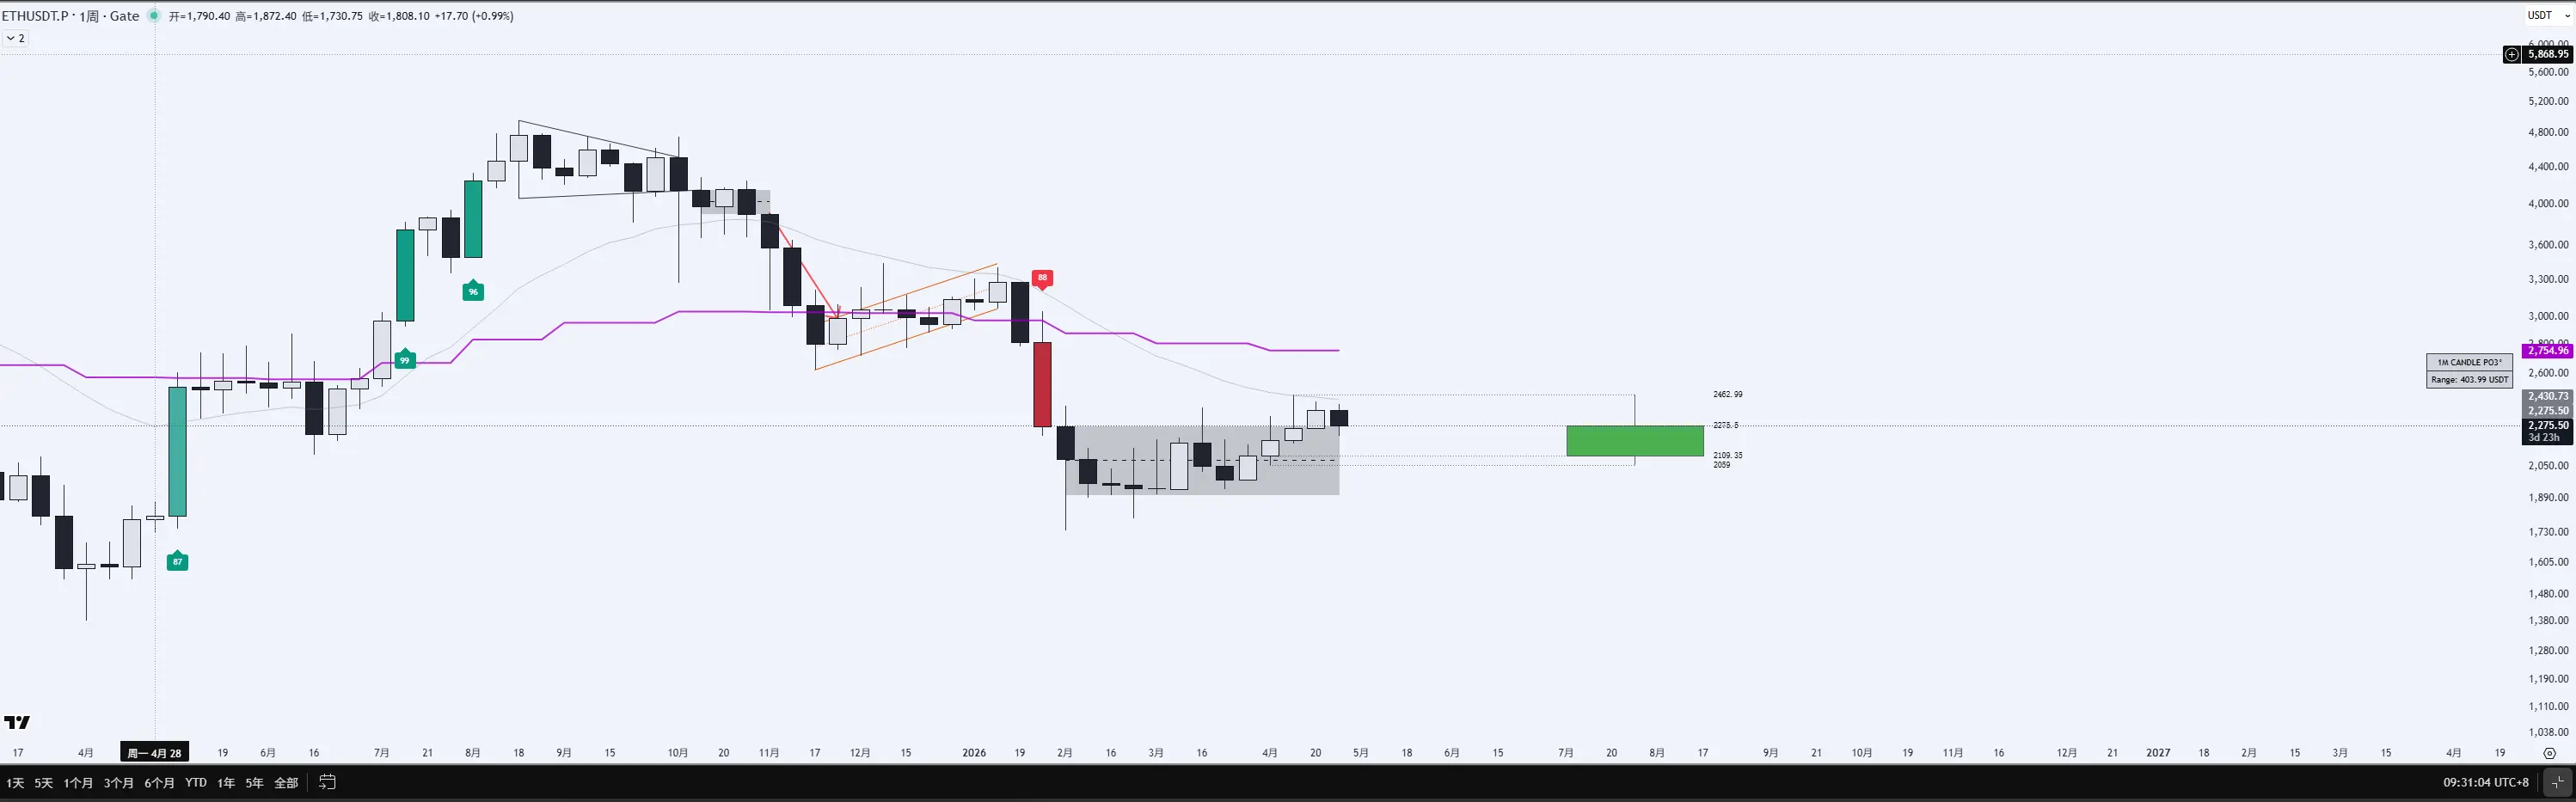
2026.02.19-ETH 价格行为深度研判:周线级别熊市陷阱还是日线级别底部筑巢?
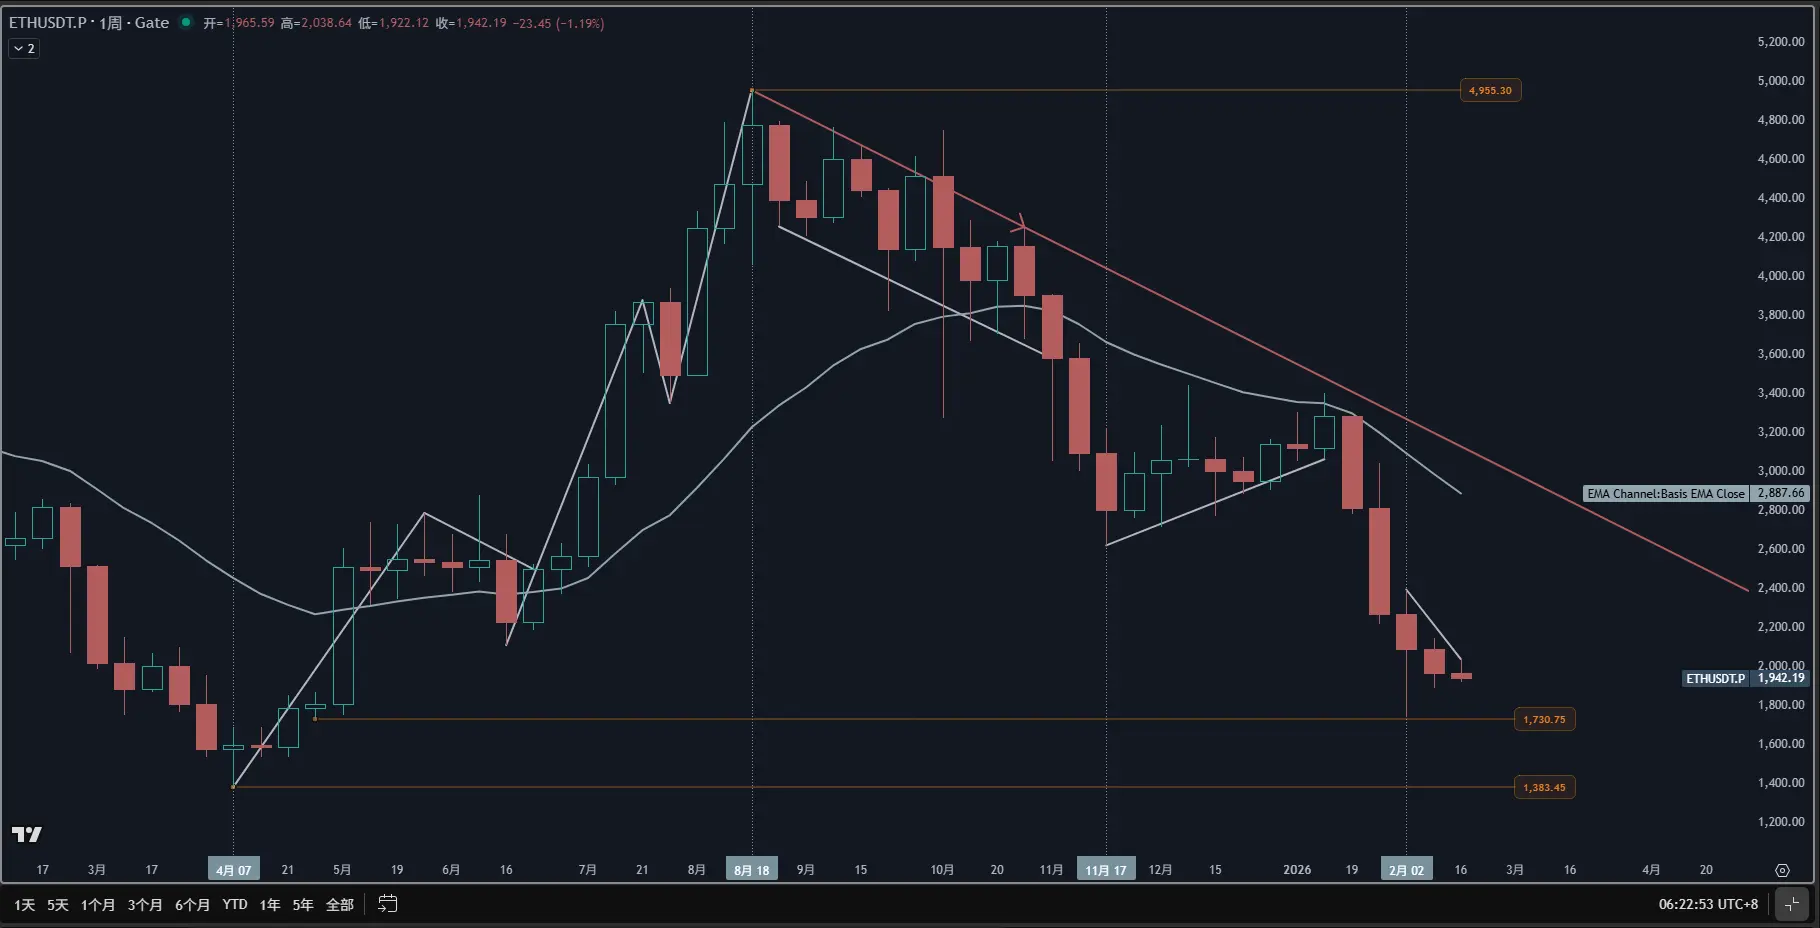
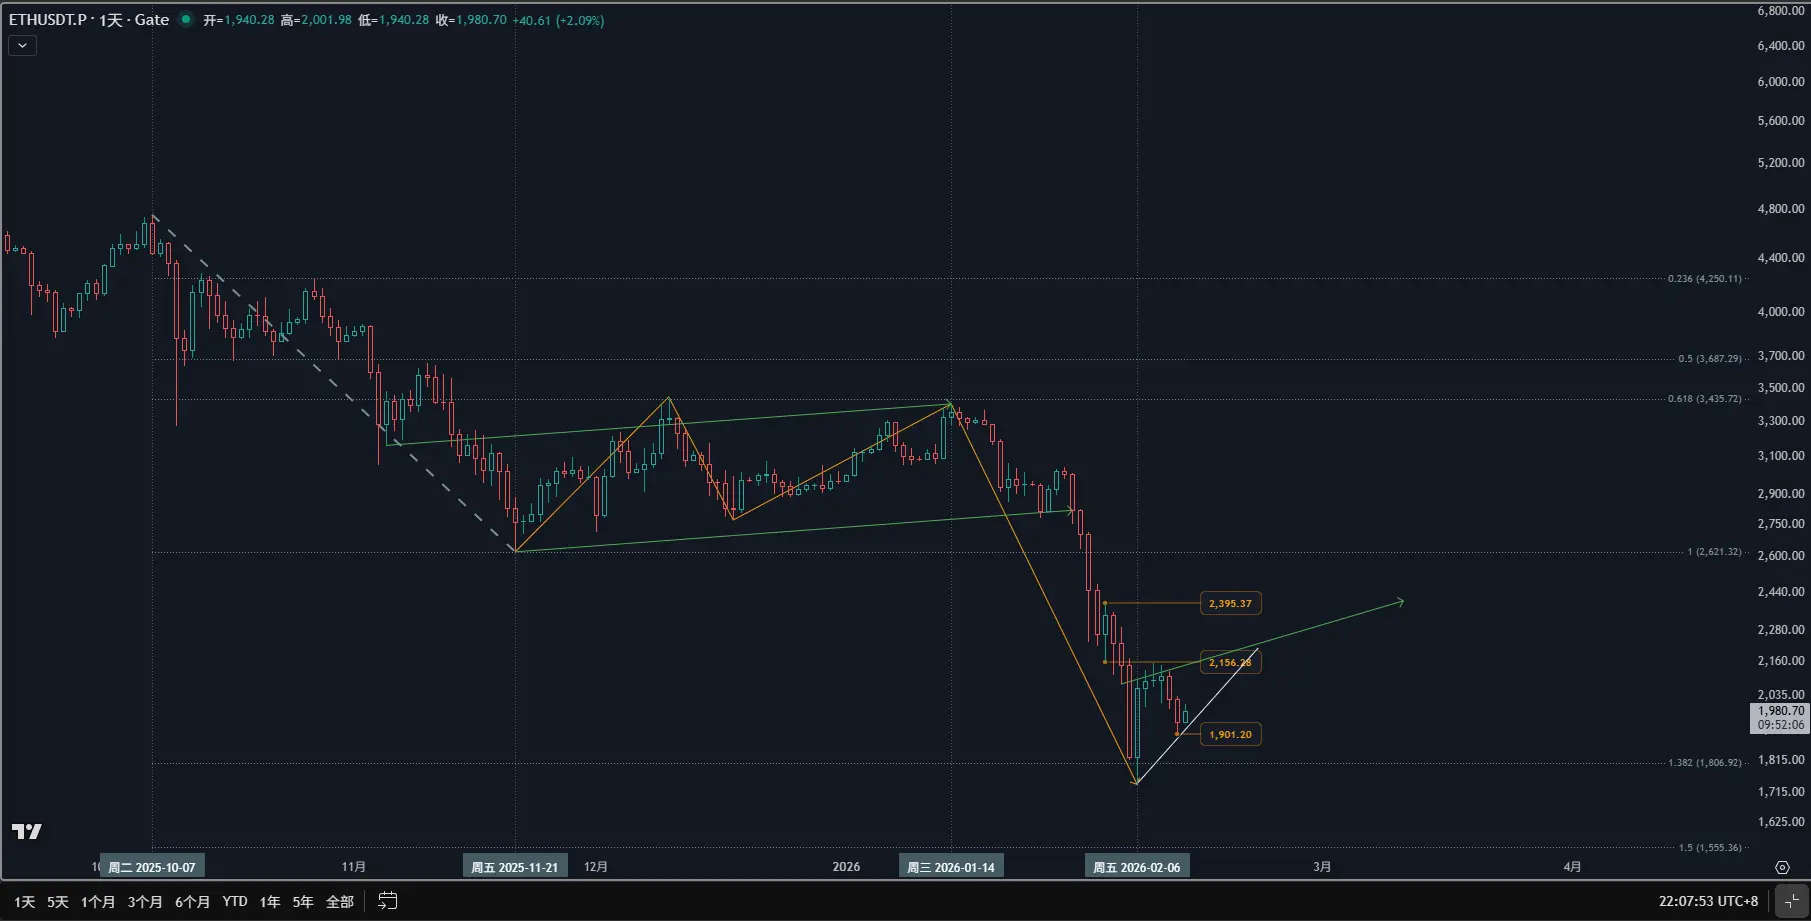
一、从周线级别来看,ETH 正在经历从 2025 年牛市周期向深度修正周期的转换。
————————————————————————————————————
·Bull Trend Exhaustion (多头竭尽): 2025.4.7(1383.45)至 8.18(4955.3)完成了一段典型的周线级别上涨。在经历了突破(Breakout)与回调(Pullback)后,8.18 的高点形成了潜在的波段顶部。
·Bear Channel & Breakout (下跌通道与破位): 自 4955.3 见顶后,行情进入标准的 Bear Channel。尽管 11.17 在 2621.32 企稳并演变为一段 Broad Bull Channel(宽幅上升通道),但 2026.1.12 的次高点(3403.7)未能逾越前高,确立了 Lower High(较低的高点)。
·Spike and Channel Bear (爆发式下跌): 1.19 周线级别跌破通道下沿,随后引发 Spike Phase(爆发式下跌),直至触及 1740。上周(2.9-2.16)收出一根实体明显的阴线(收盘 1965.64),显示空头依然掌握 Always In Short 的主动权。
————————————————————
ETH-2.39%
- 打賞
- 2
- 回覆
- 轉發
- 分享
【ETH 跨周期 PA 分析:90min 突破確認,5min 尋找回踩機會】 🎯
1. 市場週期評估 (Market Cycle Assessment)
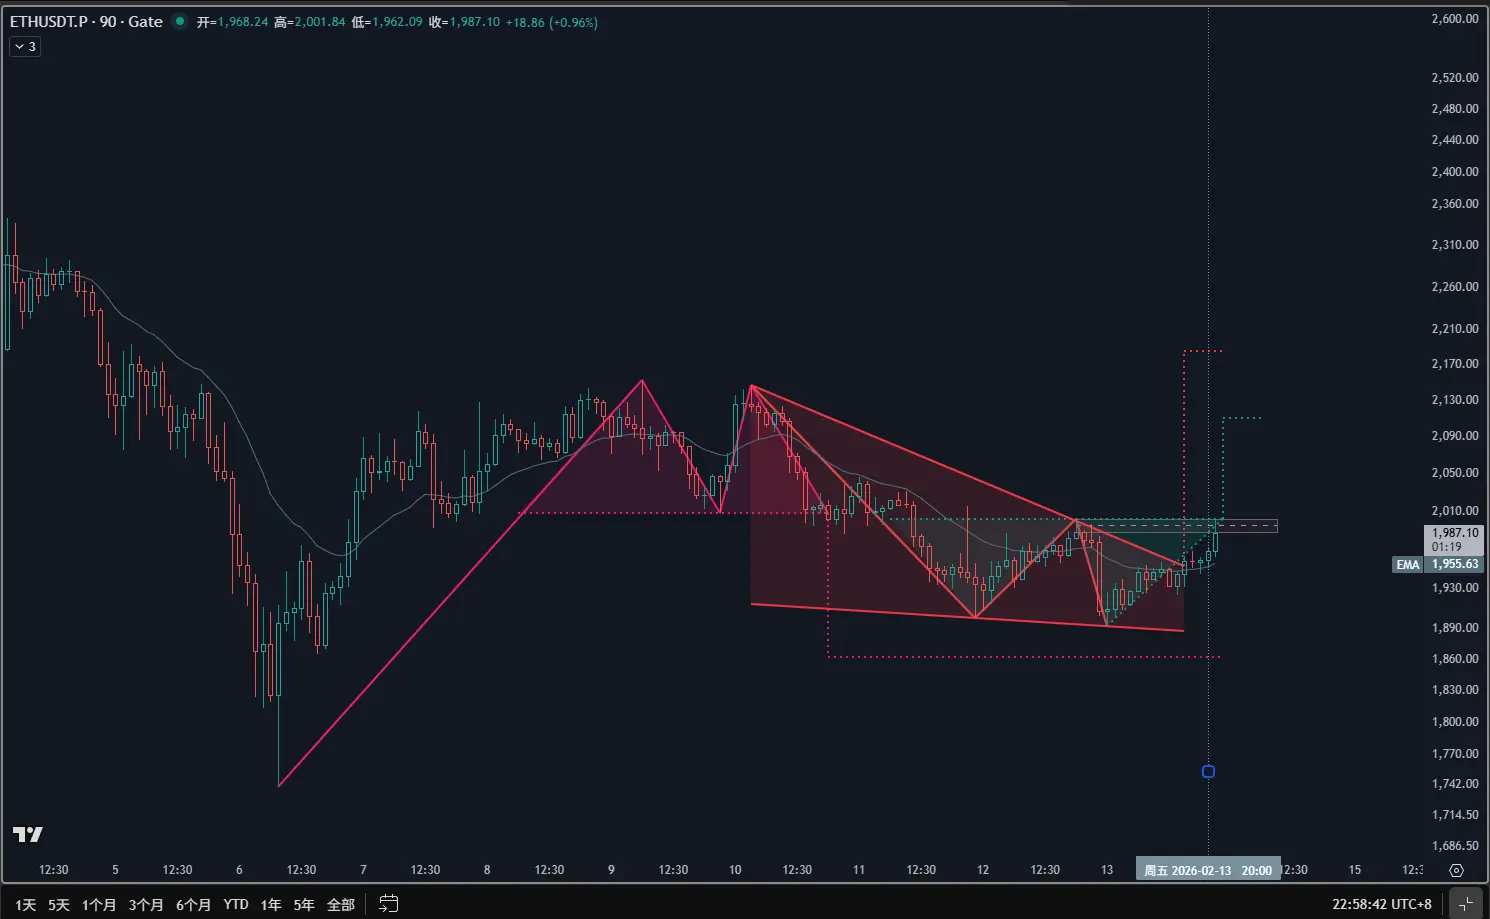
-90MIN (Context): 處於多頭突波 (Bull Spike) 階段。市場剛剛完成對底部震盪區間的強力突破,這種強度的 Spike 意味著 Always In Long。根據 Al Brooks 理論,Spike 之後通常會跟隨一個較長的通道 (Channel) 階段,目前正處於動能釋放的最強期。
-5MIN (Timing): 處於買入高潮 (Buying Climax)。5 分鐘級別由於連續大陽線拉升,已經形成了拋物線狀的上漲,這意味著雖然動能極強,但短線回調壓力正在增大。
_____________________________________________________________________________________________________
2. 重要關鍵位 (Key Levels)
-阻力位 (90MIN): $2,000 心理關口。這是 90 分鐘級別多頭試圖挑戰的目標位(Measured Move)。
-支撐位 (5MIN): $1,945 - $1,950 區域。這是 5 分鐘級別強力突破後的起點,也是 EMA 20 目前正在快速追趕的區域。
-EMA 20: 兩個周期均
1. 市場週期評估 (Market Cycle Assessment)
-90MIN (Context): 處於多頭突波 (Bull Spike) 階段。市場剛剛完成對底部震盪區間的強力突破,這種強度的 Spike 意味著 Always In Long。根據 Al Brooks 理論,Spike 之後通常會跟隨一個較長的通道 (Channel) 階段,目前正處於動能釋放的最強期。
-5MIN (Timing): 處於買入高潮 (Buying Climax)。5 分鐘級別由於連續大陽線拉升,已經形成了拋物線狀的上漲,這意味著雖然動能極強,但短線回調壓力正在增大。
_____________________________________________________________________________________________________
2. 重要關鍵位 (Key Levels)
-阻力位 (90MIN): $2,000 心理關口。這是 90 分鐘級別多頭試圖挑戰的目標位(Measured Move)。
-支撐位 (5MIN): $1,945 - $1,950 區域。這是 5 分鐘級別強力突破後的起點,也是 EMA 20 目前正在快速追趕的區域。
-EMA 20: 兩個周期均
ETH-2.39%

- 打賞
- 按讚
- 回覆
- 轉發
- 分享
ETH 深度超賣,反彈信號觸發?
———————————————————————————————————————————————————
1. 市場週期評估
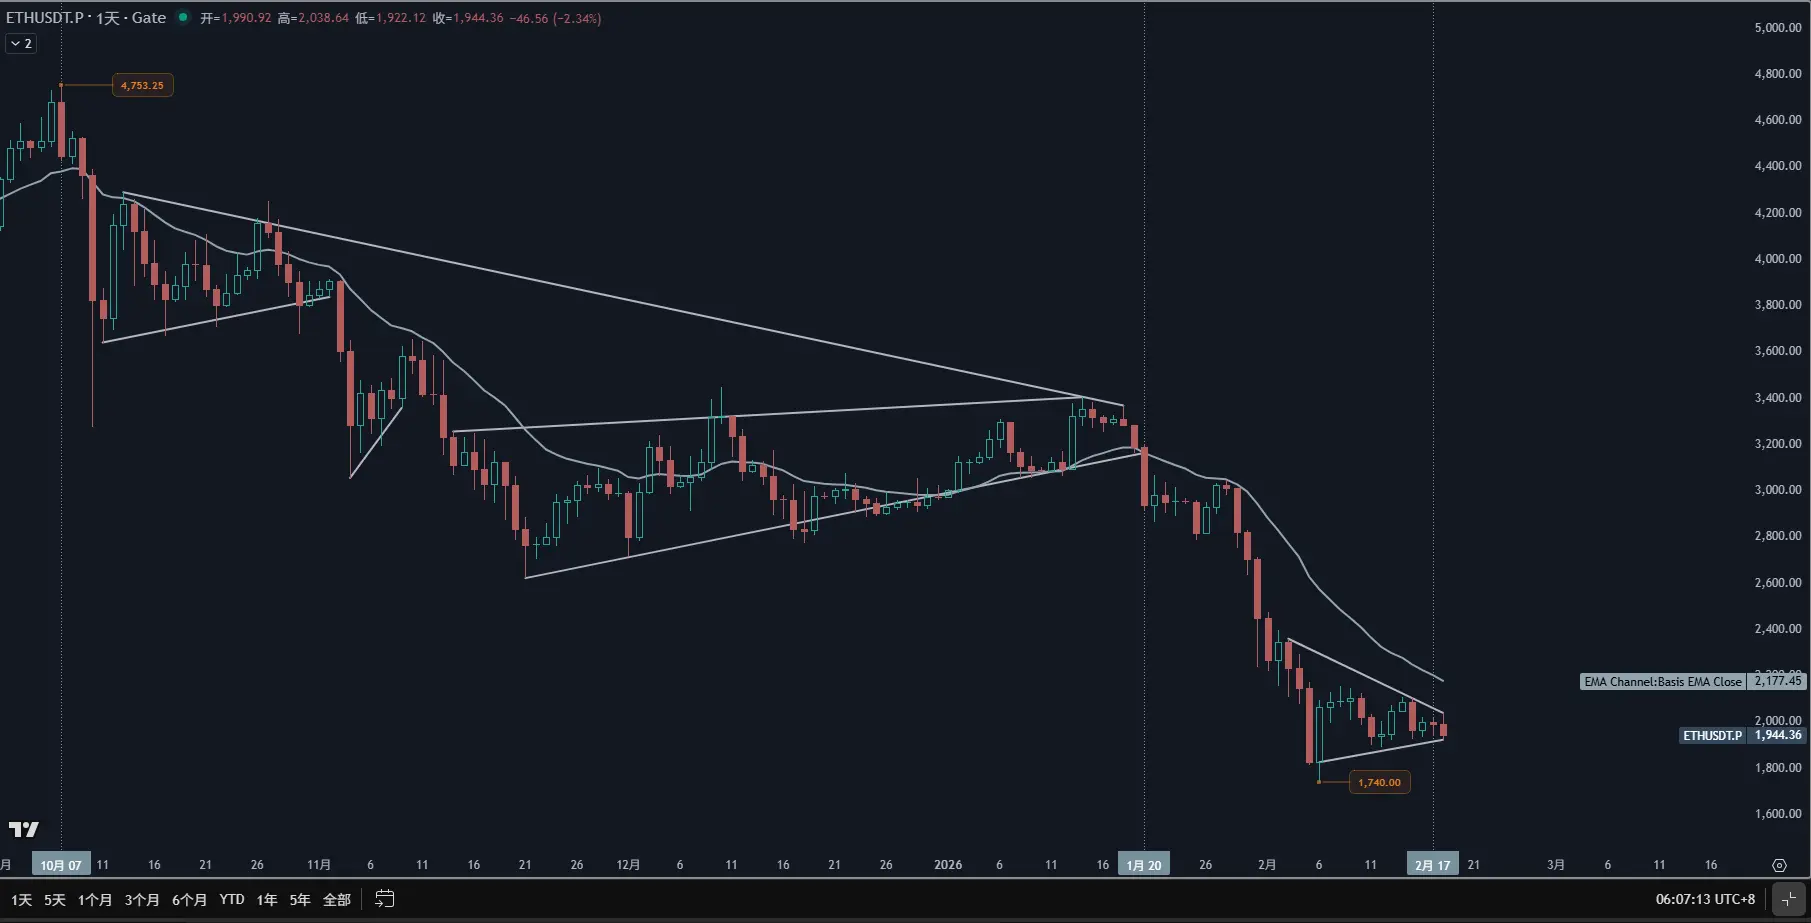
-1D 圖表:處於 Bear Spike & Channel (空頭突波與通道)。2 月初的大陰線(Spike)確立了空頭趨勢,隨後進入斜率較陡的下跌通道。當前價格偏離 EMA 20 過遠,屬於 Oversold (超賣) 狀態。
-4H 圖表:處於 Trading Range (交易區間) 演變階段。在經歷了昨日的 Selling Climax (拋售高潮) 後,4H 級別出現了一組 Double Bottom (雙底) 雛形,空頭動能暫時在 $1,930 附近衰減。
——————————————————————————————————————————————————
2. 重要位分析
-$2,100 (1D EMA 20 阻力位)
- $1,980 (4H 級別最後一次 Lower High)
- $1,900 - $1,930 (心理關口及近期拋售止跌位)
——————————————————————————————————————————————————
——————————————————————————————————————
🎯 第一目標:$2,050
🎯 第二目標:$2,100 (1D EMA 20)
⚠️
———————————————————————————————————————————————————
1. 市場週期評估
-1D 圖表:處於 Bear Spike & Channel (空頭突波與通道)。2 月初的大陰線(Spike)確立了空頭趨勢,隨後進入斜率較陡的下跌通道。當前價格偏離 EMA 20 過遠,屬於 Oversold (超賣) 狀態。
-4H 圖表:處於 Trading Range (交易區間) 演變階段。在經歷了昨日的 Selling Climax (拋售高潮) 後,4H 級別出現了一組 Double Bottom (雙底) 雛形,空頭動能暫時在 $1,930 附近衰減。
——————————————————————————————————————————————————
2. 重要位分析
-$2,100 (1D EMA 20 阻力位)
- $1,980 (4H 級別最後一次 Lower High)
- $1,900 - $1,930 (心理關口及近期拋售止跌位)
——————————————————————————————————————————————————
——————————————————————————————————————
🎯 第一目標:$2,050
🎯 第二目標:$2,100 (1D EMA 20)
⚠️
ETH-2.39%
- 打賞
- 按讚
- 回覆
- 轉發
- 分享
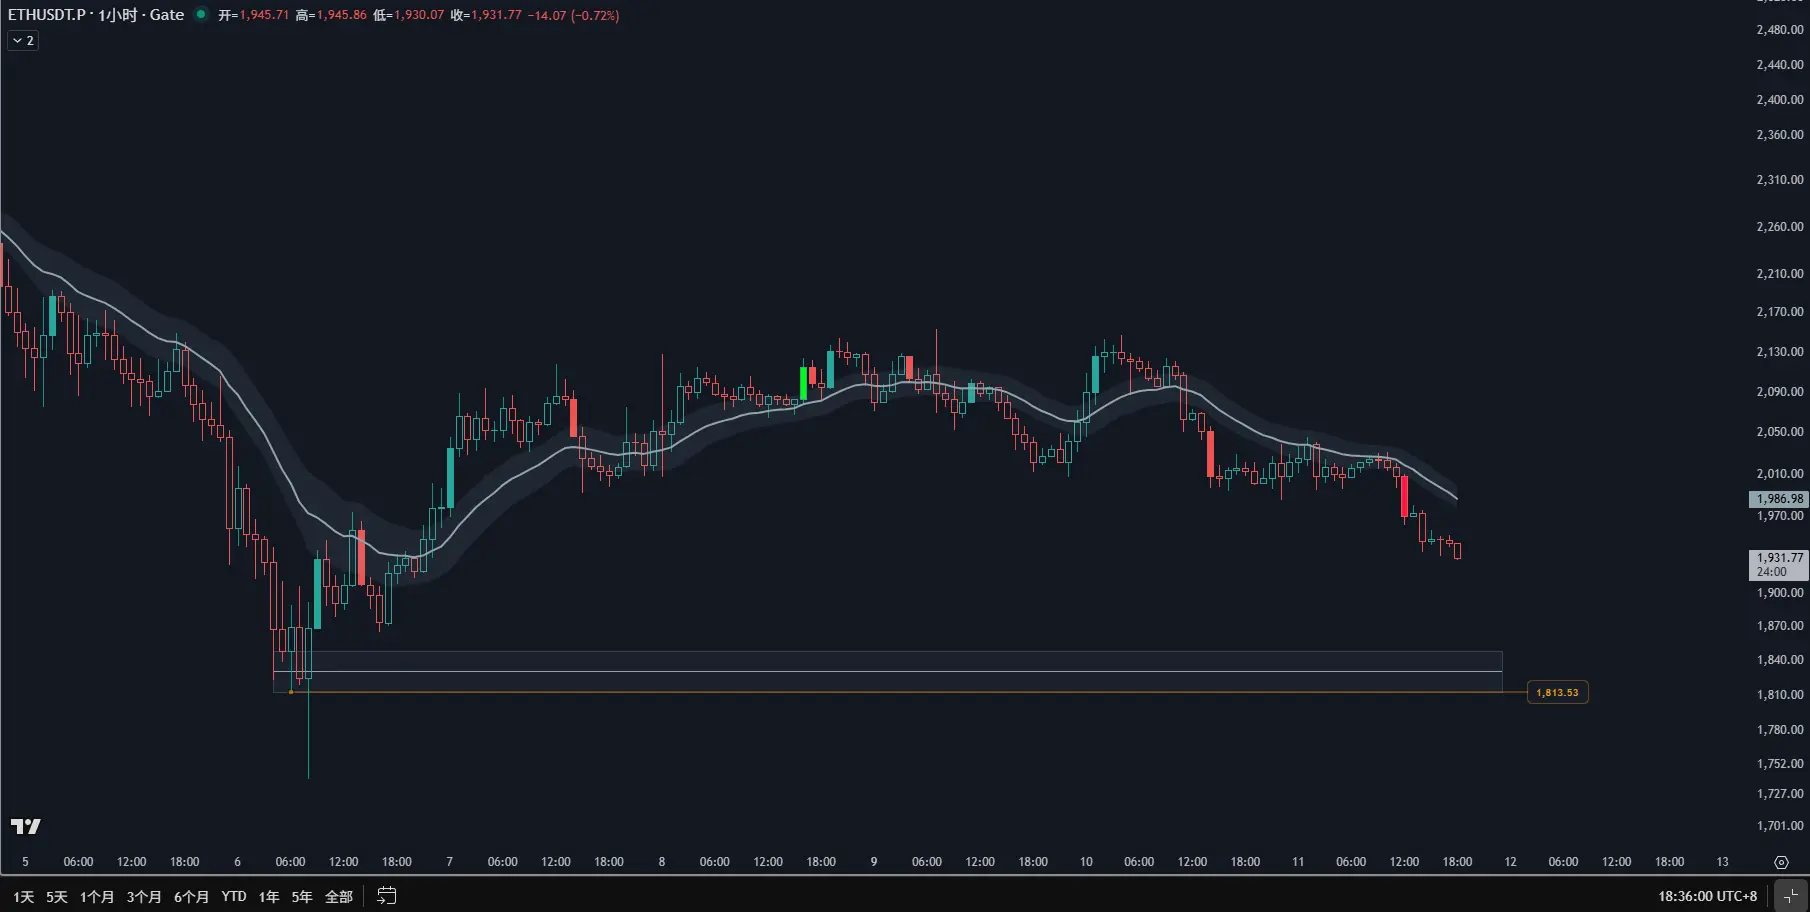
ETH 1H 結構解析:震盪重心上移,多頭嘗試突圍 📌 結構拆解 (Structural Review): ETH 1H 級別正處於 Broad Trading Range (寬幅震盪) 階段。空頭推力減弱,多頭在 $1,900-$1,920 築起堅實防線。價格目前圍繞平走的 EMA 20 波動,處於積蓄能量的狀態。
————————————————————————————————————
🎯 概率前瞻 (Future Scenarios):
·60% 機率:上測 $2,050。低點抬升結構預示著市場將回探區間上限尋求流動性。
·25% 機率:在 $1,950 附近進行無方向的窄幅橫盤。
·15% 機率:跌破 $1,900,重啟日線級主跌趨勢。
⚠️ 失效原則 (Invalidation): 底線設在 $1,890。若 1H 級別大陰線放量貫穿此位,則反彈邏輯全盤作廢。
#Gate广场发帖领五万美金红包 #Gate春节赛马红包嘉年华 #我在Gate广场过新年 #ETH#当前行情抄底还是观望?
————————————————————————————————————
🎯 概率前瞻 (Future Scenarios):
·60% 機率:上測 $2,050。低點抬升結構預示著市場將回探區間上限尋求流動性。
·25% 機率:在 $1,950 附近進行無方向的窄幅橫盤。
·15% 機率:跌破 $1,900,重啟日線級主跌趨勢。
⚠️ 失效原則 (Invalidation): 底線設在 $1,890。若 1H 級別大陰線放量貫穿此位,則反彈邏輯全盤作廢。
#Gate广场发帖领五万美金红包 #Gate春节赛马红包嘉年华 #我在Gate广场过新年 #ETH#当前行情抄底还是观望?
ETH-2.39%
- 打賞
- 按讚
- 回覆
- 轉發
- 分享
ETH 4H 分析:空頭動能減弱,震盪修復或成主旋律
📌 邏輯拆解:
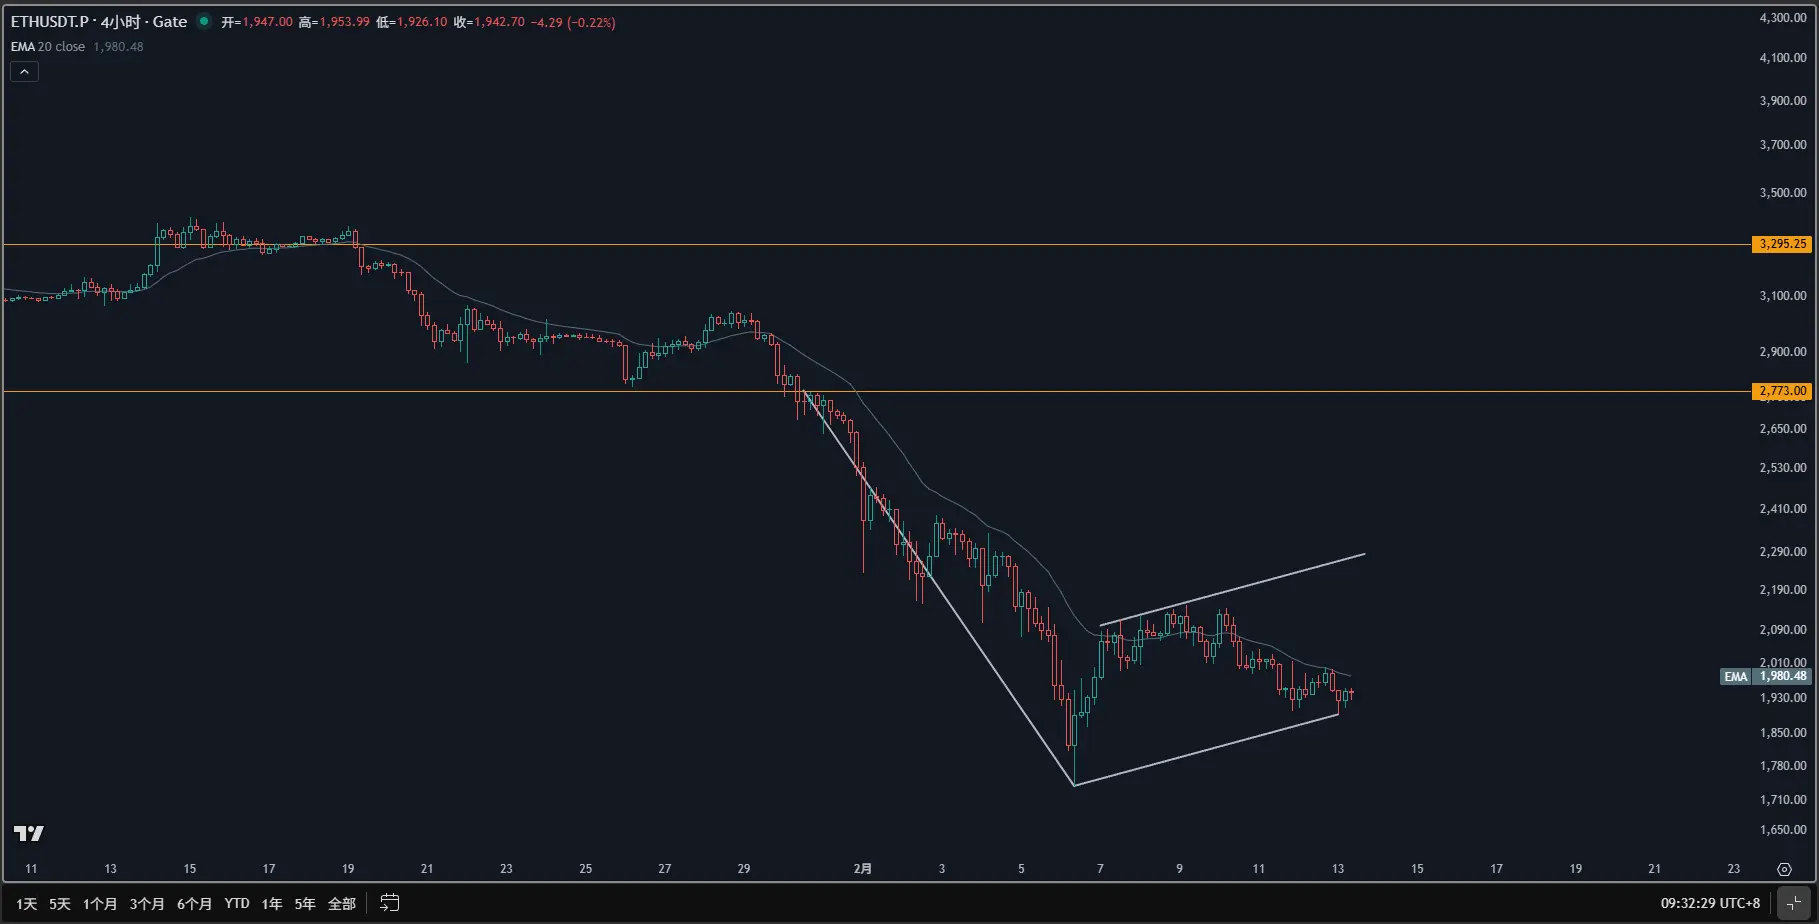
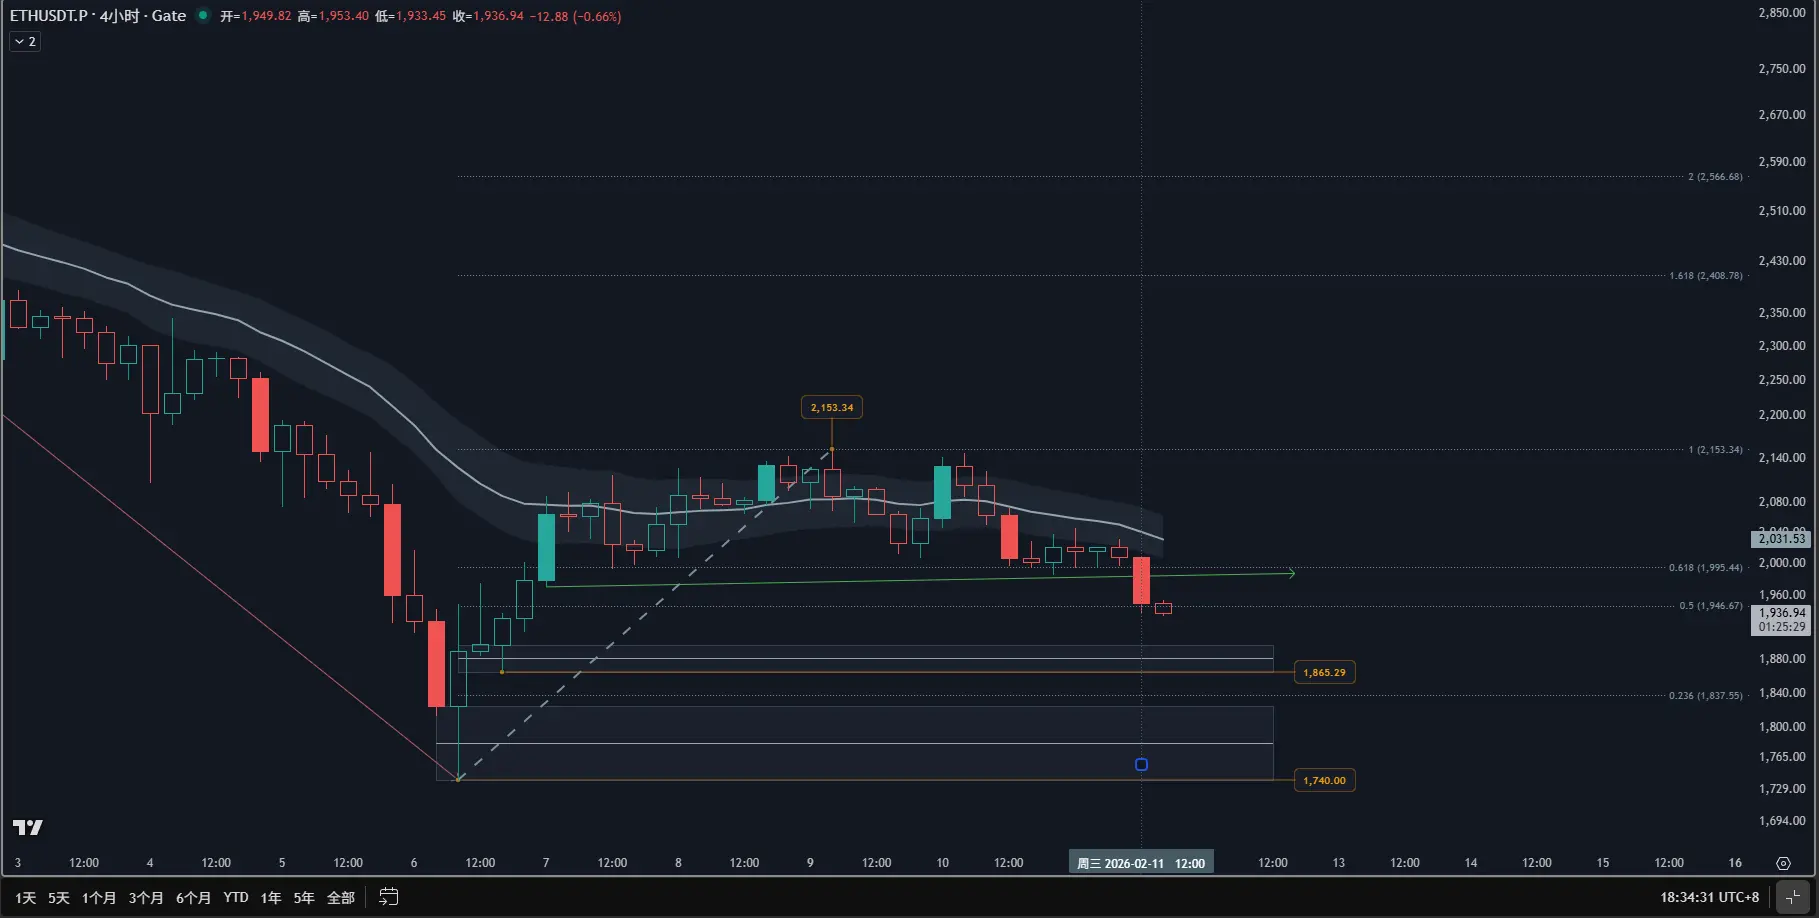
從 PA 角度看,2.11 的 $1,901 與 2.6 的 $1,740 構成了底部抬升。4H 級別 K 線重疊度增加,標誌著 Selling Pressure (抛壓) 已經從“瀑布式”轉向“衰竭式”。目前多頭正試圖構建一個 Broad Trading Range (寬幅震盪區間)。
————————————————————————————————————
📊 重要區間:
·上方磁鐵 (Magnet):$2,153 (2.8 日高點)
·下方防禦 (Support):$1,900 (多頭護城河)
————————————————————————————————————
🎯 概率推演:
·55% 機率:回測區間上限。若能站穩 $2,050,目標直指 $2,150。
·30% 機率:在 $1,950 附近進入“死魚盤”窄幅橫盤。
·15% 機率:放量跌破 $1,900,開啟第三波大級別主跌。
————————————————————————————————————
💡 預警:
目前勝率傾向於反彈,但需警惕 $2,050 附近的虛假突破。策略上建議在 $1,900 附近設定硬性防線。若行情未能按預期在 48 小時內拉升,則需警惕時間失效帶來的風險。
#ETH #Gate广场发帖领五万美金红包 #Gate春
📌 邏輯拆解:
從 PA 角度看,2.11 的 $1,901 與 2.6 的 $1,740 構成了底部抬升。4H 級別 K 線重疊度增加,標誌著 Selling Pressure (抛壓) 已經從“瀑布式”轉向“衰竭式”。目前多頭正試圖構建一個 Broad Trading Range (寬幅震盪區間)。
————————————————————————————————————
📊 重要區間:
·上方磁鐵 (Magnet):$2,153 (2.8 日高點)
·下方防禦 (Support):$1,900 (多頭護城河)
————————————————————————————————————
🎯 概率推演:
·55% 機率:回測區間上限。若能站穩 $2,050,目標直指 $2,150。
·30% 機率:在 $1,950 附近進入“死魚盤”窄幅橫盤。
·15% 機率:放量跌破 $1,900,開啟第三波大級別主跌。
————————————————————————————————————
💡 預警:
目前勝率傾向於反彈,但需警惕 $2,050 附近的虛假突破。策略上建議在 $1,900 附近設定硬性防線。若行情未能按預期在 48 小時內拉升,則需警惕時間失效帶來的風險。
#ETH #Gate广场发帖领五万美金红包 #Gate春
ETH-2.39%
- 打賞
- 按讚
- 回覆
- 轉發
- 分享
ETH 結構性破位!空頭獵場已經開啟?🏹
1️⃣ 4H 級別正式破位:
多頭最後的尊嚴($1,970 支撐線)已在今日放量失守。4H 線收出“光腳大陰線”,直接貫穿斐波那契 0.5 位置。這不是回測,這是趨勢的崩塌。
___________________________________________________________________________________________________________________
2️⃣ 陰跌模式開啟:
1H 級別標準的下跌通道已經成型,每一次反抽 EMA 20 都是精准的“誘多誘捕”。目前的 Price Action 顯示空頭動能尚未釋放完畢,下方磁吸位直指 $1,865 附近。
___________________________________________________________________________________________________________________
3️⃣ 操作策略:
❌ 嚴禁左側接飛刀:4H 實體過大,通常意味着至少還有第二次下探。
✅ 順勢而為:目前的邏輯是“反彈即空”。
__________________________________________________________________________________________
ETH-2.39%
- 打賞
- 按讚
- 回覆
- 轉發
- 分享
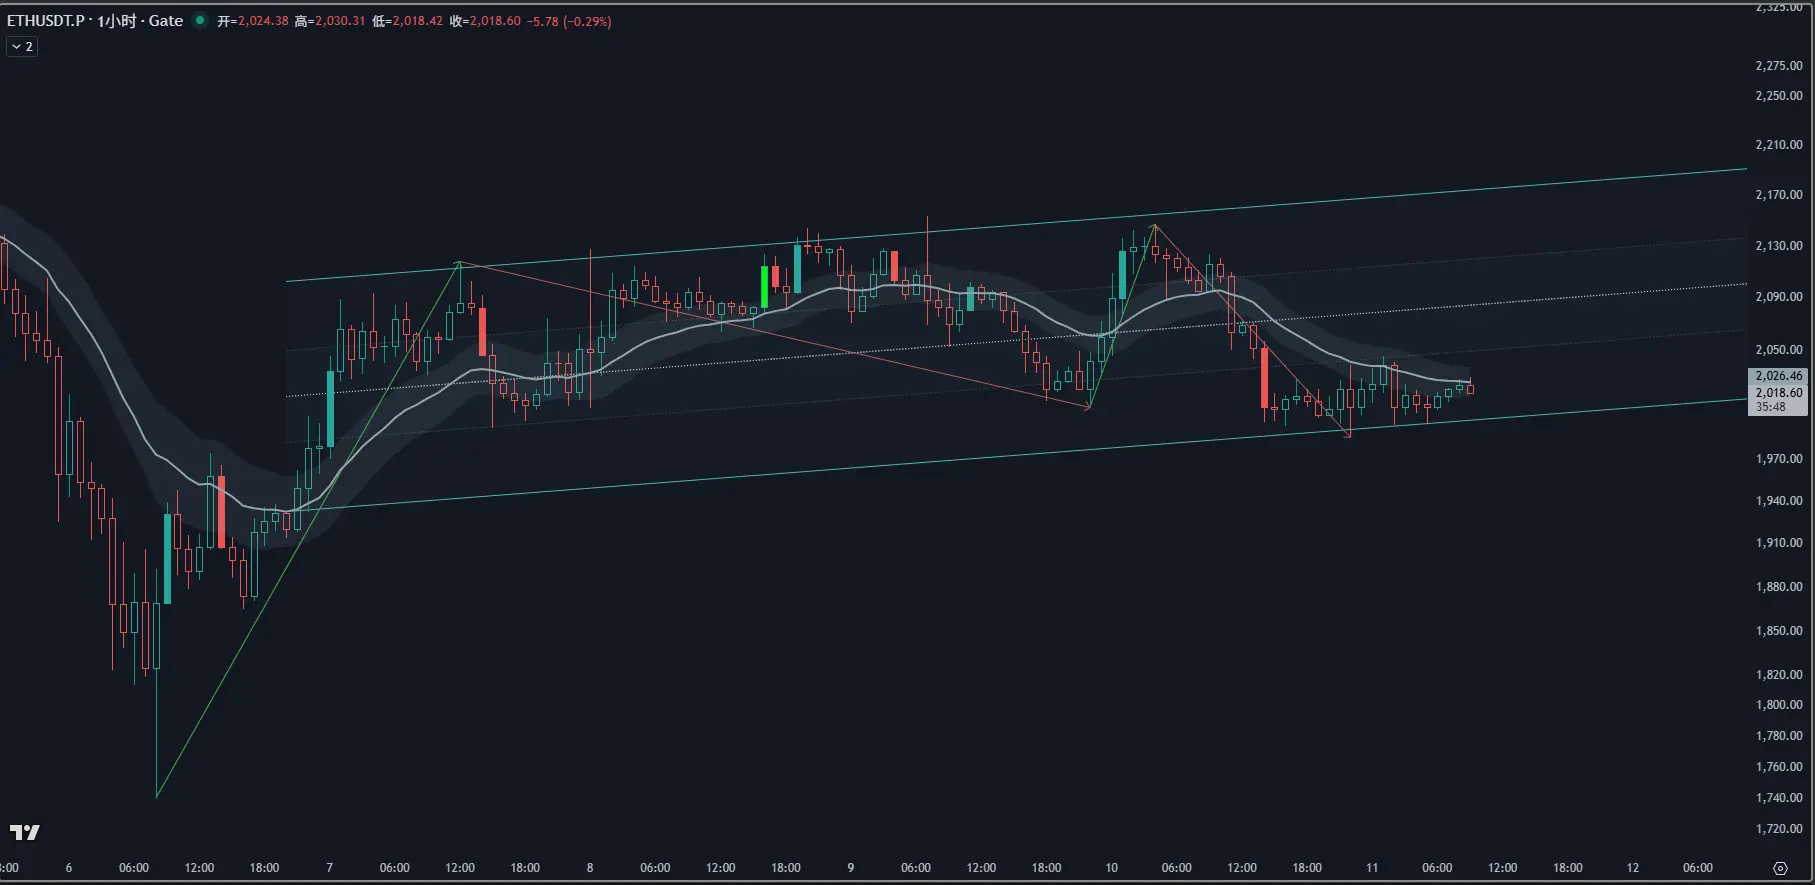
🚀 ETH 行情速遞:大級別築底 vs 小時線陣地戰,誰將勝出?
1️⃣ 宏觀局勢:4H 級別反轉初現
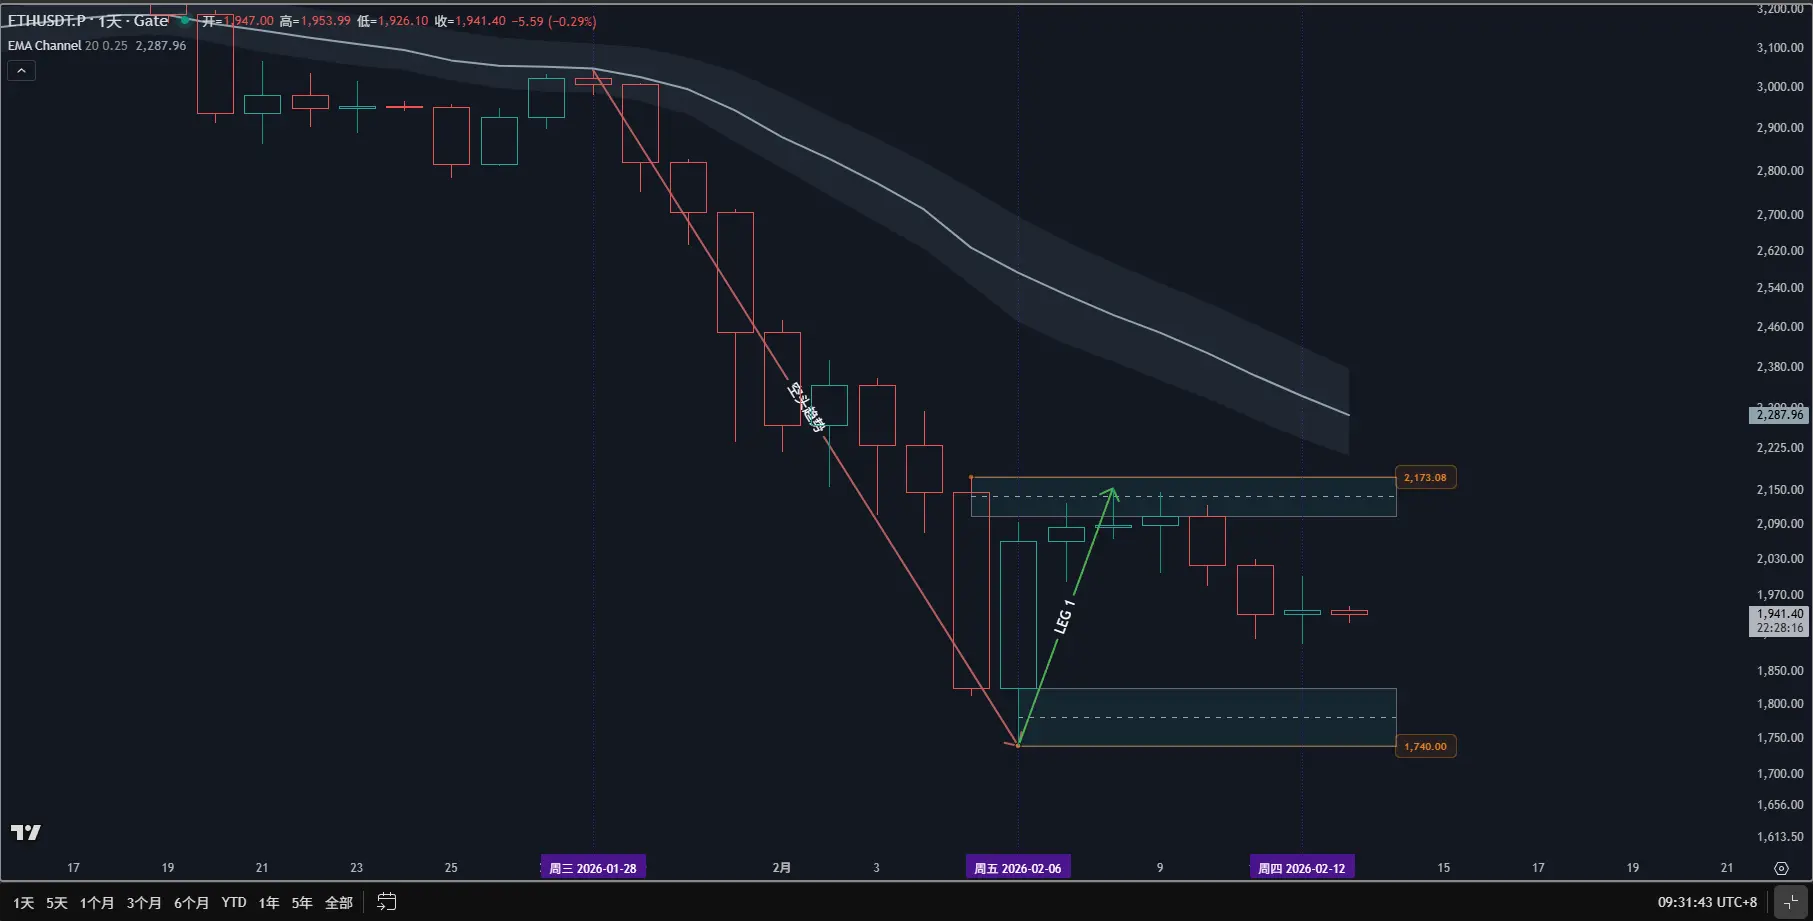
·雙底確立:ETH 在 $1,740$ 附近通過二次探底,確認了極強的底部支撐。
·趨勢逆轉:價格已強力穿透長期下降趨勢線,市場狀態正式由空頭佔優切換為“始終在多(Always In Long)”的初始階段。
·長線目標:若 Leg 2 爆發,上方空間將指向 $2,265$ 甚至 $2,389$。
2️⃣ 中期焦點:1H 級別的 EMA 争奪戰
·核心戰場:目前價格緊貼 1H EMA 20(約 $2,024$)震盪,此處的橫盤而非深調,是多頭動能強勁的信號。
·上升通道:市場正運行在健康的寬幅上升通道中,低點不斷抬高,支撐位已上移至 $2,015 - $2,020$。
3️⃣ 風險預警:極端回測的劇本
·黑天鵝預案:若行情未能啟動並意外跌破 $2,000$,需警惕重回 $1,740$ 筑底的風險。
·結構演變:回測底部意味著反轉失敗,市場將進入 4H 級別的超寬幅震盪區間。
💡 操盤總結
·多頭邏輯:只要守住 $2,014$ 关键位,反彈邏輯依然堅固。
·短期目標:首看 $2,035 - $2,040$ 壓力區,突破後將打開通往 $2,131$ 的大門。
#ETH #当前行情抄底还是观望? #Gate春节赛马红包嘉年华 #我在Gate广场过新年
1️⃣ 宏觀局勢:4H 級別反轉初現
·雙底確立:ETH 在 $1,740$ 附近通過二次探底,確認了極強的底部支撐。
·趨勢逆轉:價格已強力穿透長期下降趨勢線,市場狀態正式由空頭佔優切換為“始終在多(Always In Long)”的初始階段。
·長線目標:若 Leg 2 爆發,上方空間將指向 $2,265$ 甚至 $2,389$。
2️⃣ 中期焦點:1H 級別的 EMA 争奪戰
·核心戰場:目前價格緊貼 1H EMA 20(約 $2,024$)震盪,此處的橫盤而非深調,是多頭動能強勁的信號。
·上升通道:市場正運行在健康的寬幅上升通道中,低點不斷抬高,支撐位已上移至 $2,015 - $2,020$。
3️⃣ 風險預警:極端回測的劇本
·黑天鵝預案:若行情未能啟動並意外跌破 $2,000$,需警惕重回 $1,740$ 筑底的風險。
·結構演變:回測底部意味著反轉失敗,市場將進入 4H 級別的超寬幅震盪區間。
💡 操盤總結
·多頭邏輯:只要守住 $2,014$ 关键位,反彈邏輯依然堅固。
·短期目標:首看 $2,035 - $2,040$ 壓力區,突破後將打開通往 $2,131$ 的大門。
#ETH #当前行情抄底还是观望? #Gate春节赛马红包嘉年华 #我在Gate广场过新年
ETH-2.39%
- 打賞
- 按讚
- 2
- 轉發
- 分享
大鹏 先生:
必須開啟查看更多
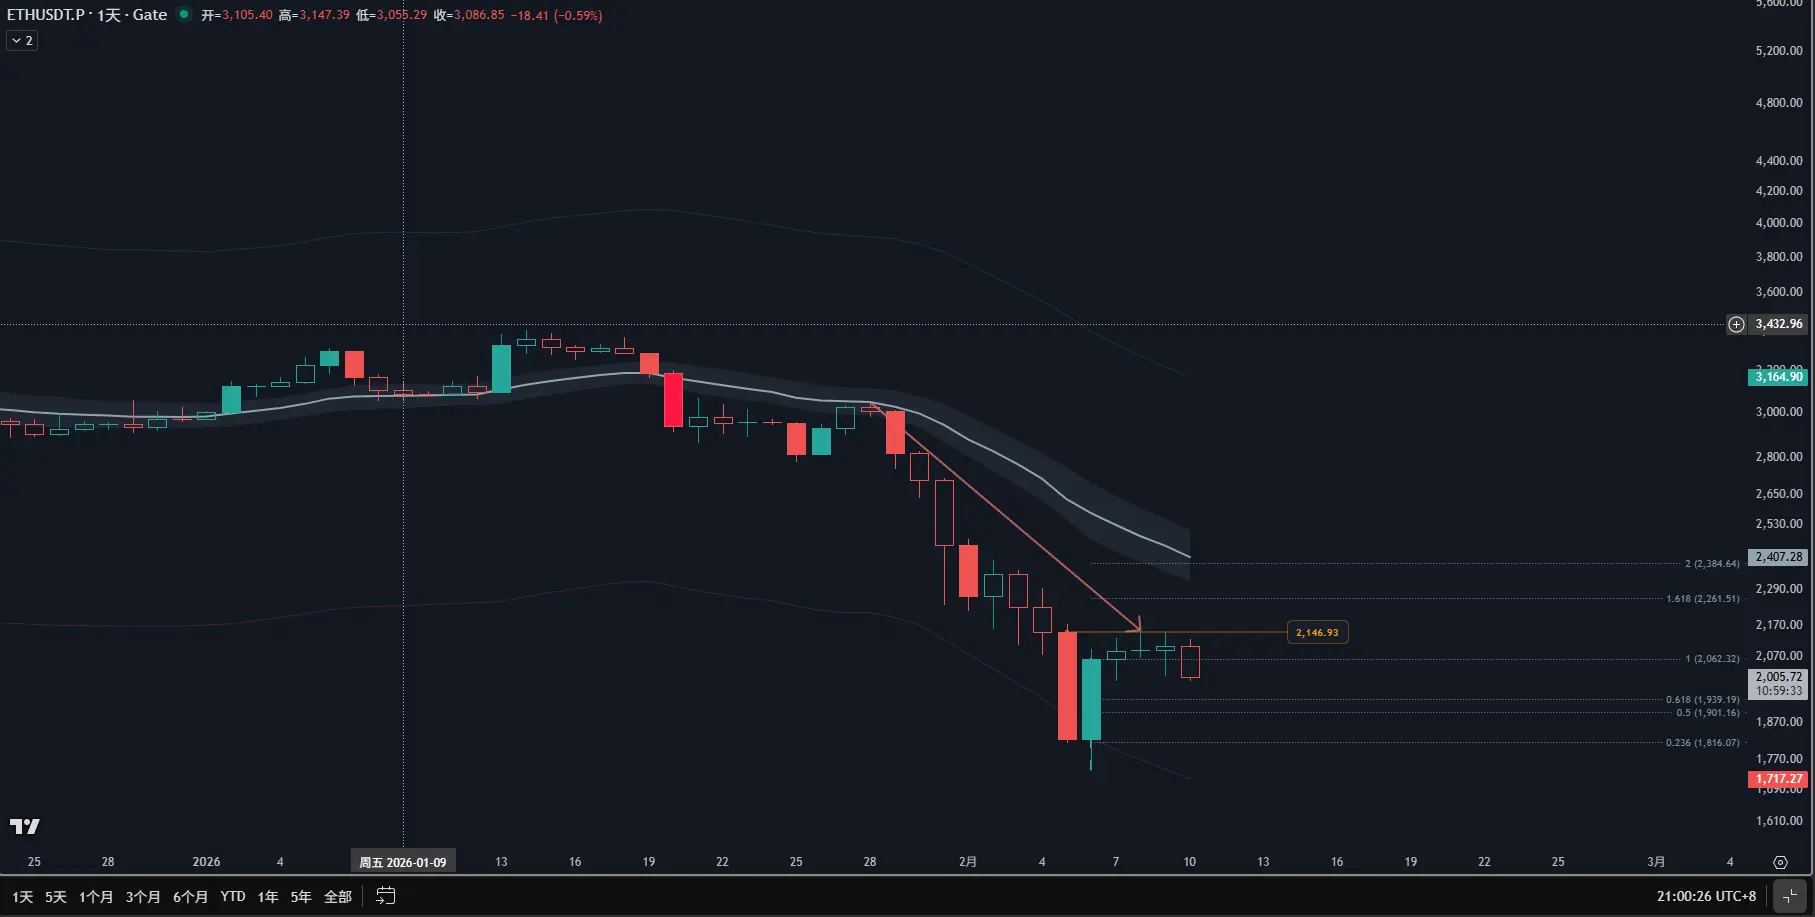
ETH 結構診斷 —— 從“大跌”到“大橫” 🧠
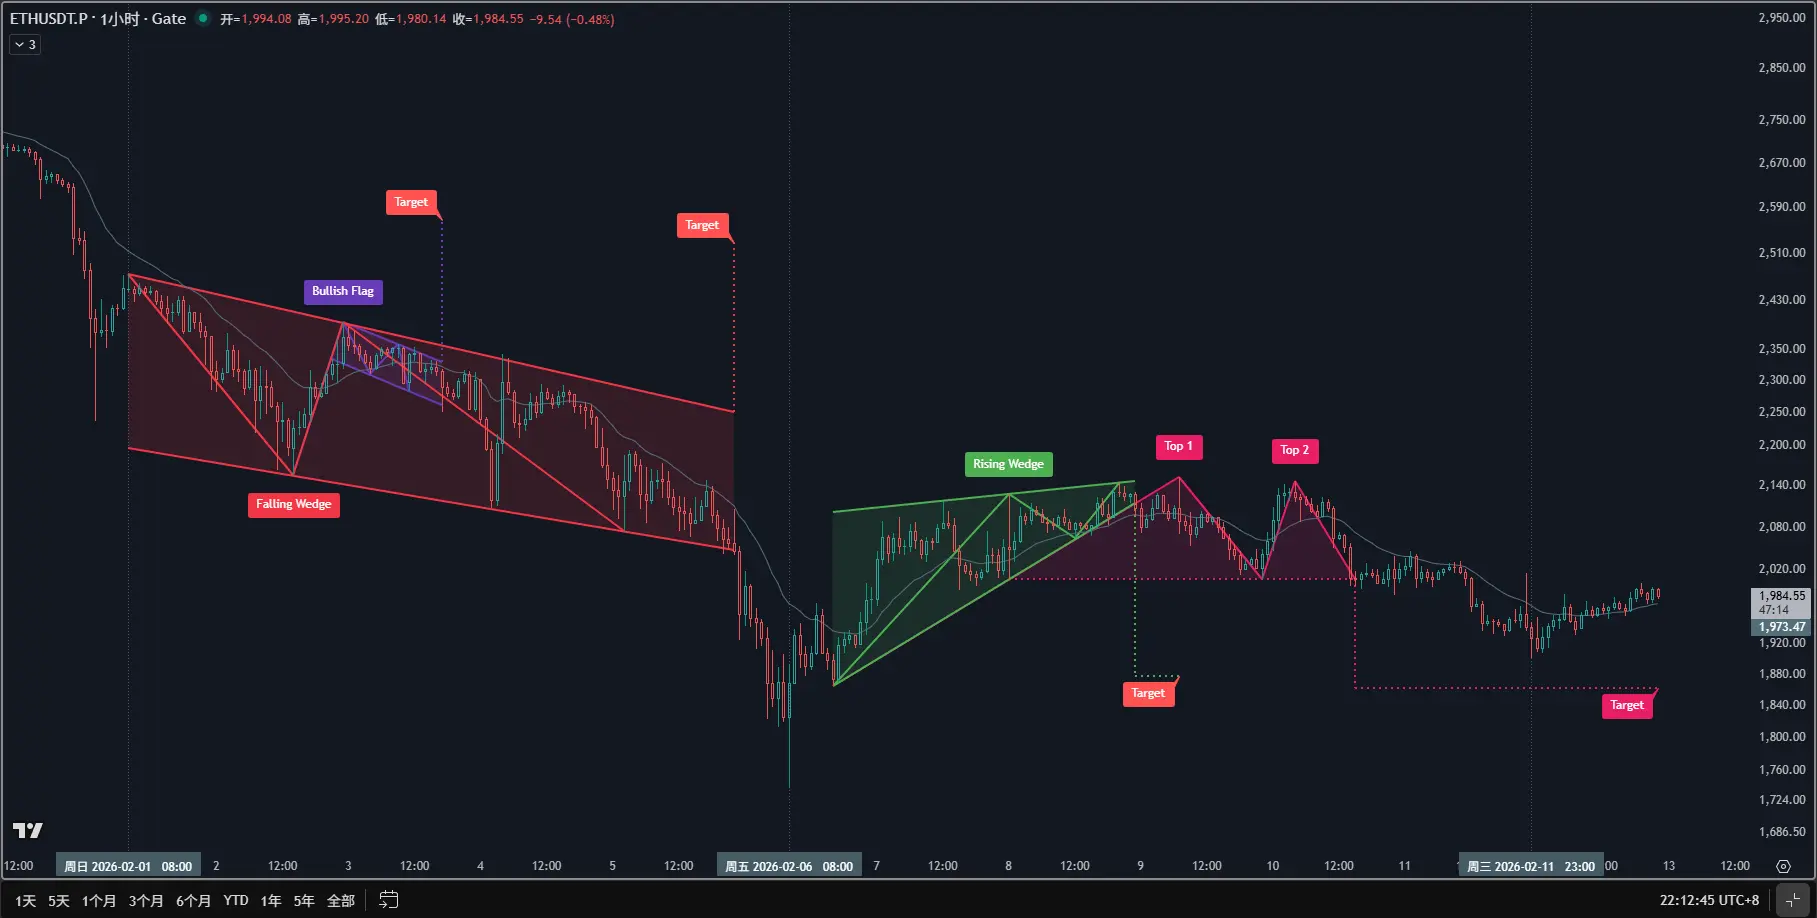
$ETH 日線級別在經歷了一波快速清算(Spike)後,目前正處於價格行為學(PA)中典型的“演化第二階段”:從單邊趨勢轉入交易區間(Trading Range)。
空頭最猛烈的動能已經宣洩,市場正在尋找新的價值中樞。
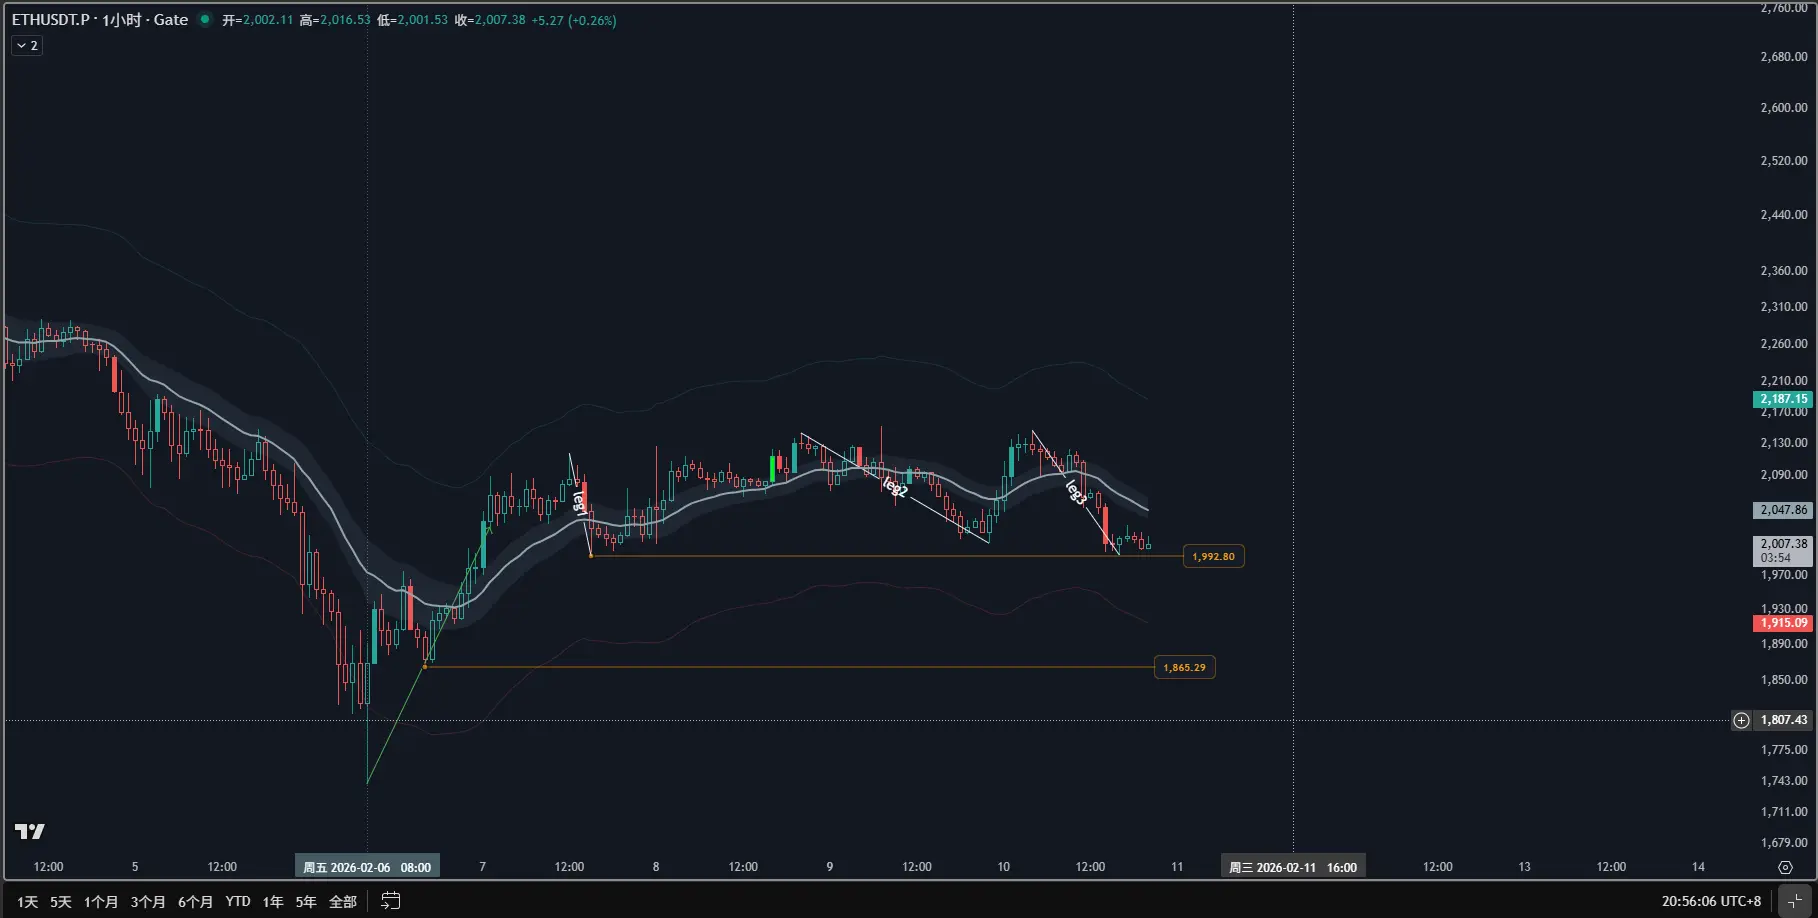
1H 視角:經典的 3-Legged Drop 結構 📉
觀察 1H 圖:
反轉後並未直接反轉,而是走出了一个複雜的“三段式下跌”橫盤。
✅ Leg 1 & 2:高點不斷降低,測試支撐。
✅ Leg 3:目前正在測試關鍵位 $1,992。
在 PA 理論中,三波下跌往往構成一個 Wedge (楔形) 支撐,這是多頭嘗試築底的信號。
後續策略展望 🎯
1️⃣ 多頭觀察:若 Leg 3 在 $1,990 附近企穩並出現 TRAP (陷阱) 信號,則是極佳的左側機會。
2️⃣ 空頭防禦:EMA 20 依然是主要壓制位,未站穩均線前,所有的反彈都視為區間內的呼吸。
3️⃣ 大格局:日線反彈目標看向 $2,146 (Fib 1 位置)。
#ETH #Ethereum #当前行情抄底还是观望? #Gate春节赛马红包嘉年华
$ETH 日線級別在經歷了一波快速清算(Spike)後,目前正處於價格行為學(PA)中典型的“演化第二階段”:從單邊趨勢轉入交易區間(Trading Range)。
空頭最猛烈的動能已經宣洩,市場正在尋找新的價值中樞。
1H 視角:經典的 3-Legged Drop 結構 📉
觀察 1H 圖:
反轉後並未直接反轉,而是走出了一个複雜的“三段式下跌”橫盤。
✅ Leg 1 & 2:高點不斷降低,測試支撐。
✅ Leg 3:目前正在測試關鍵位 $1,992。
在 PA 理論中,三波下跌往往構成一個 Wedge (楔形) 支撐,這是多頭嘗試築底的信號。
後續策略展望 🎯
1️⃣ 多頭觀察:若 Leg 3 在 $1,990 附近企穩並出現 TRAP (陷阱) 信號,則是極佳的左側機會。
2️⃣ 空頭防禦:EMA 20 依然是主要壓制位,未站穩均線前,所有的反彈都視為區間內的呼吸。
3️⃣ 大格局:日線反彈目標看向 $2,146 (Fib 1 位置)。
#ETH #Ethereum #当前行情抄底还是观望? #Gate春节赛马红包嘉年华
ETH-2.39%
- 打賞
- 按讚
- 回覆
- 轉發
- 分享
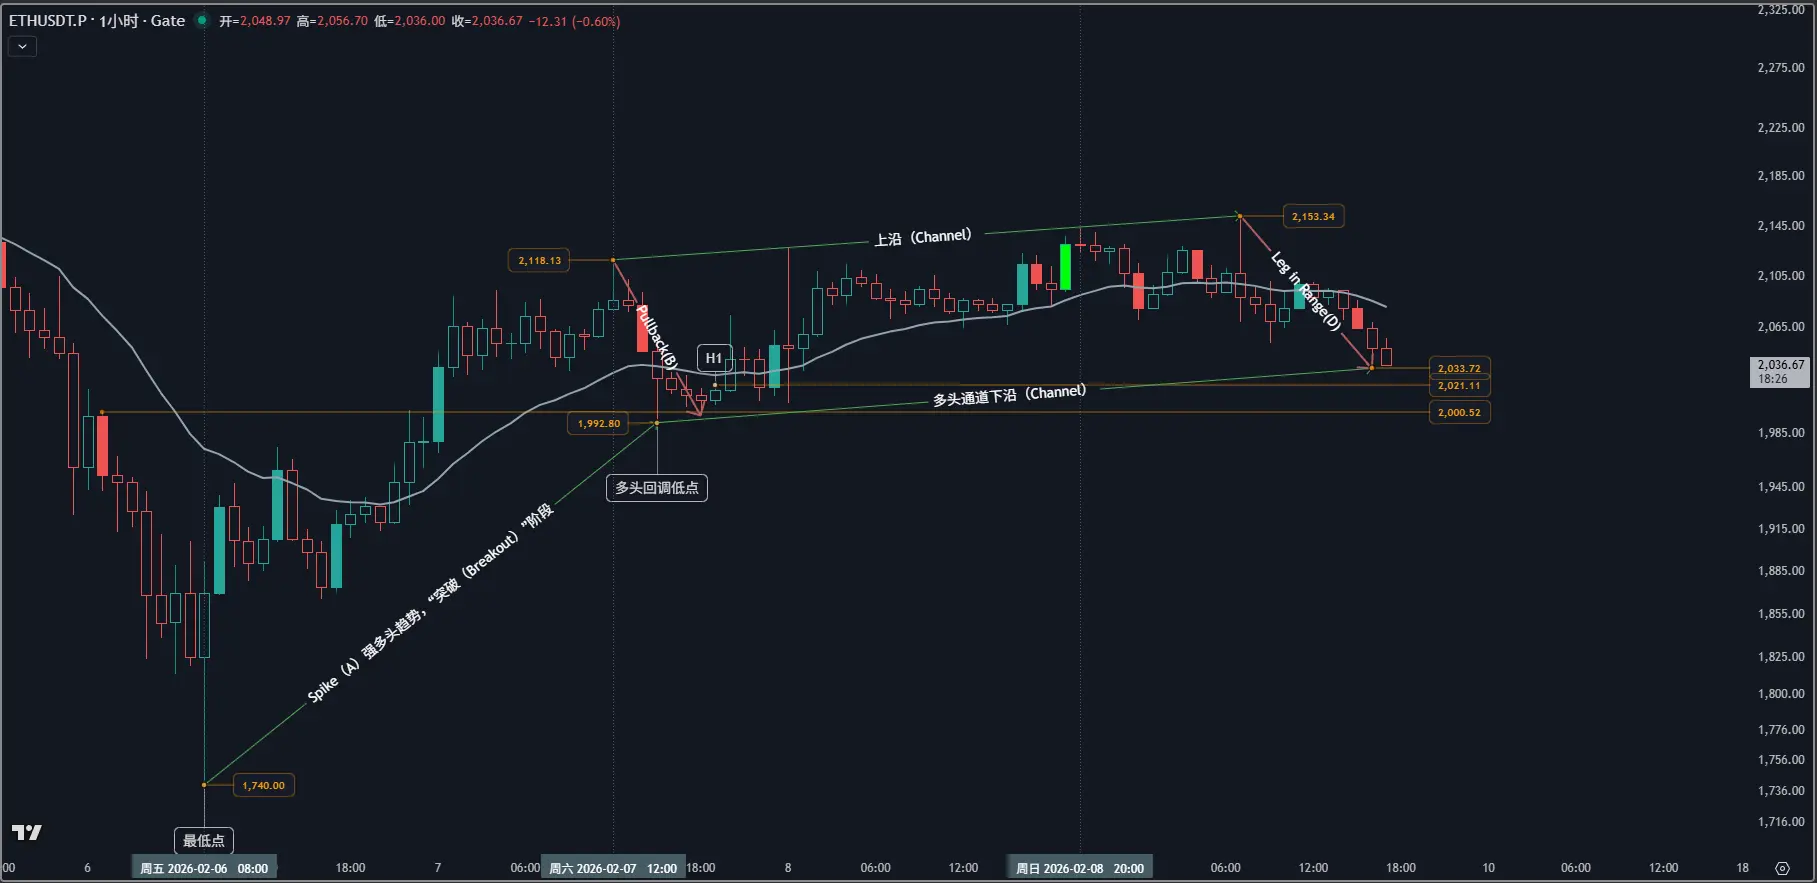
2026.2.9
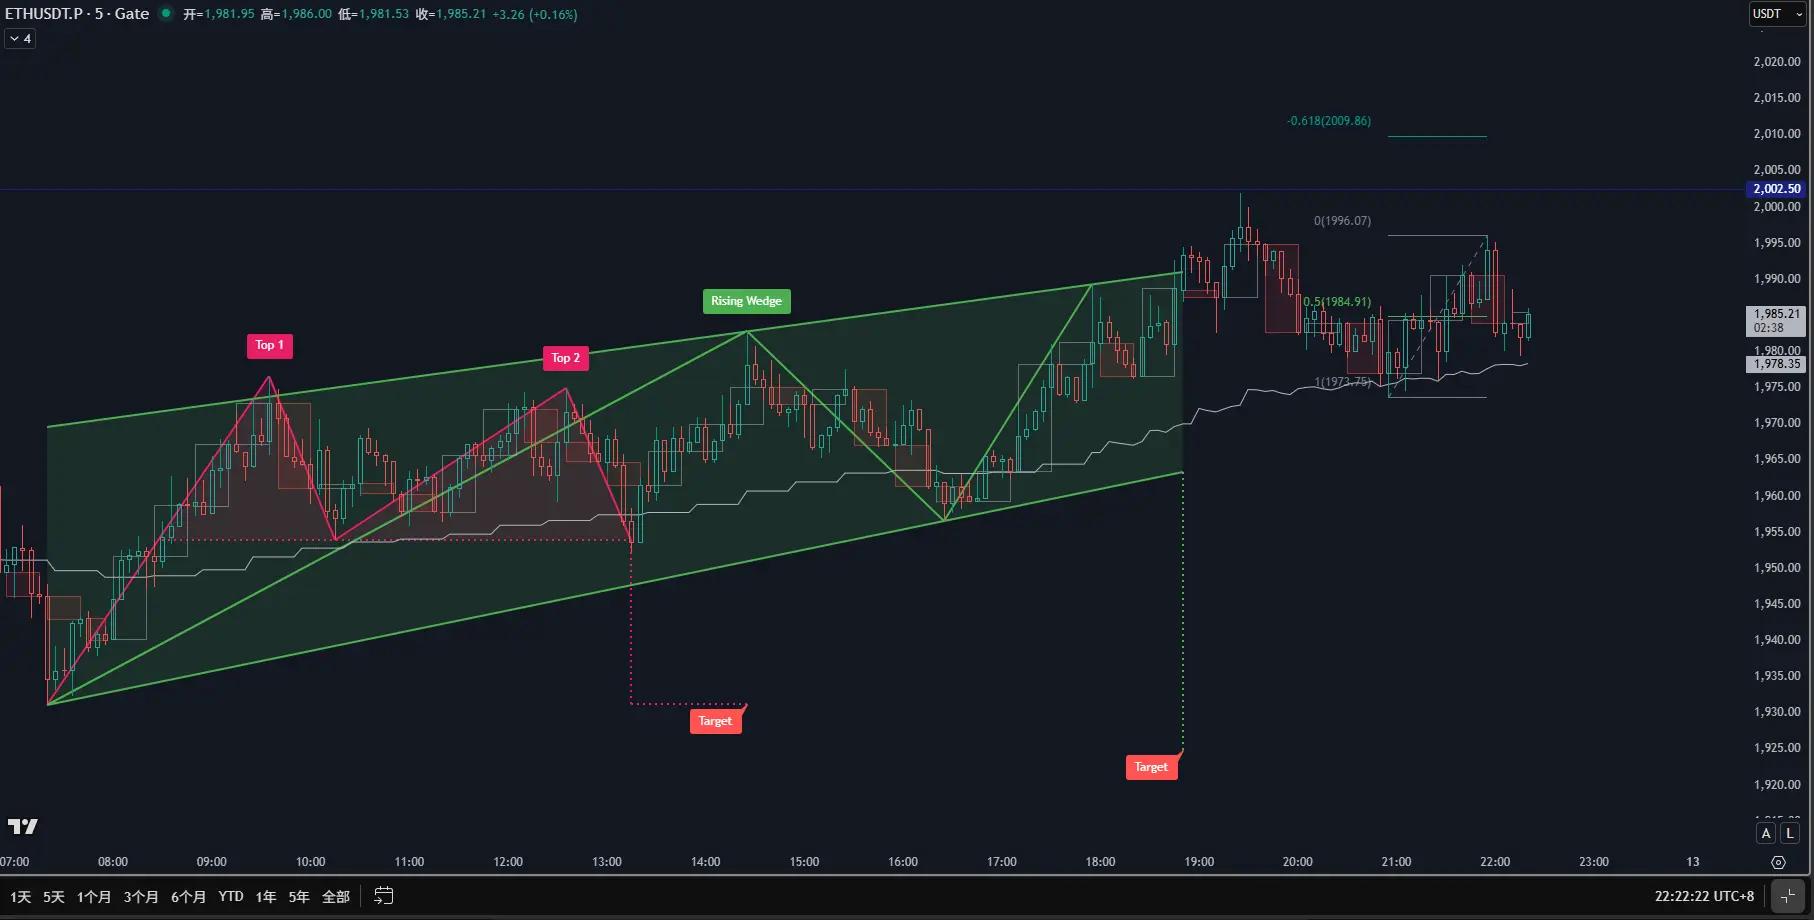
$ETH 價格行為分析:從尖峰(Spike)到區間(Range)的演變。
4H 大背景:
經歷 2.8 的強力 V 型反轉尖峰後,市場目前進入橫盤震盪(Trading Range)。EMA20 趨於走平,價格正在進行突破回測(Breakout Test),尋找多頭承接力。
1H 微觀結構:
-Leg C:一個由 37 根 K 線組成的寬幅多頭通道。
-Leg D:當前的空頭推低尚未觸及 2021.11 的關鍵缺口(Gap)。
-策略:目前處於“真空測試”階段,目標 1992.8 支撐。不急於入場,等待回測 B 段起點後的 H2(第二次買入信號) 或微型雙底出現。
-區間交易準則:低買高賣,耐心等待信號棒(Signal Bar)收線。
#价格行为 #ETH #当前行情抄底还是观望? #行情分析
ETH-2.39%
- 打賞
- 按讚
- 1
- 轉發
- 分享
金筏:
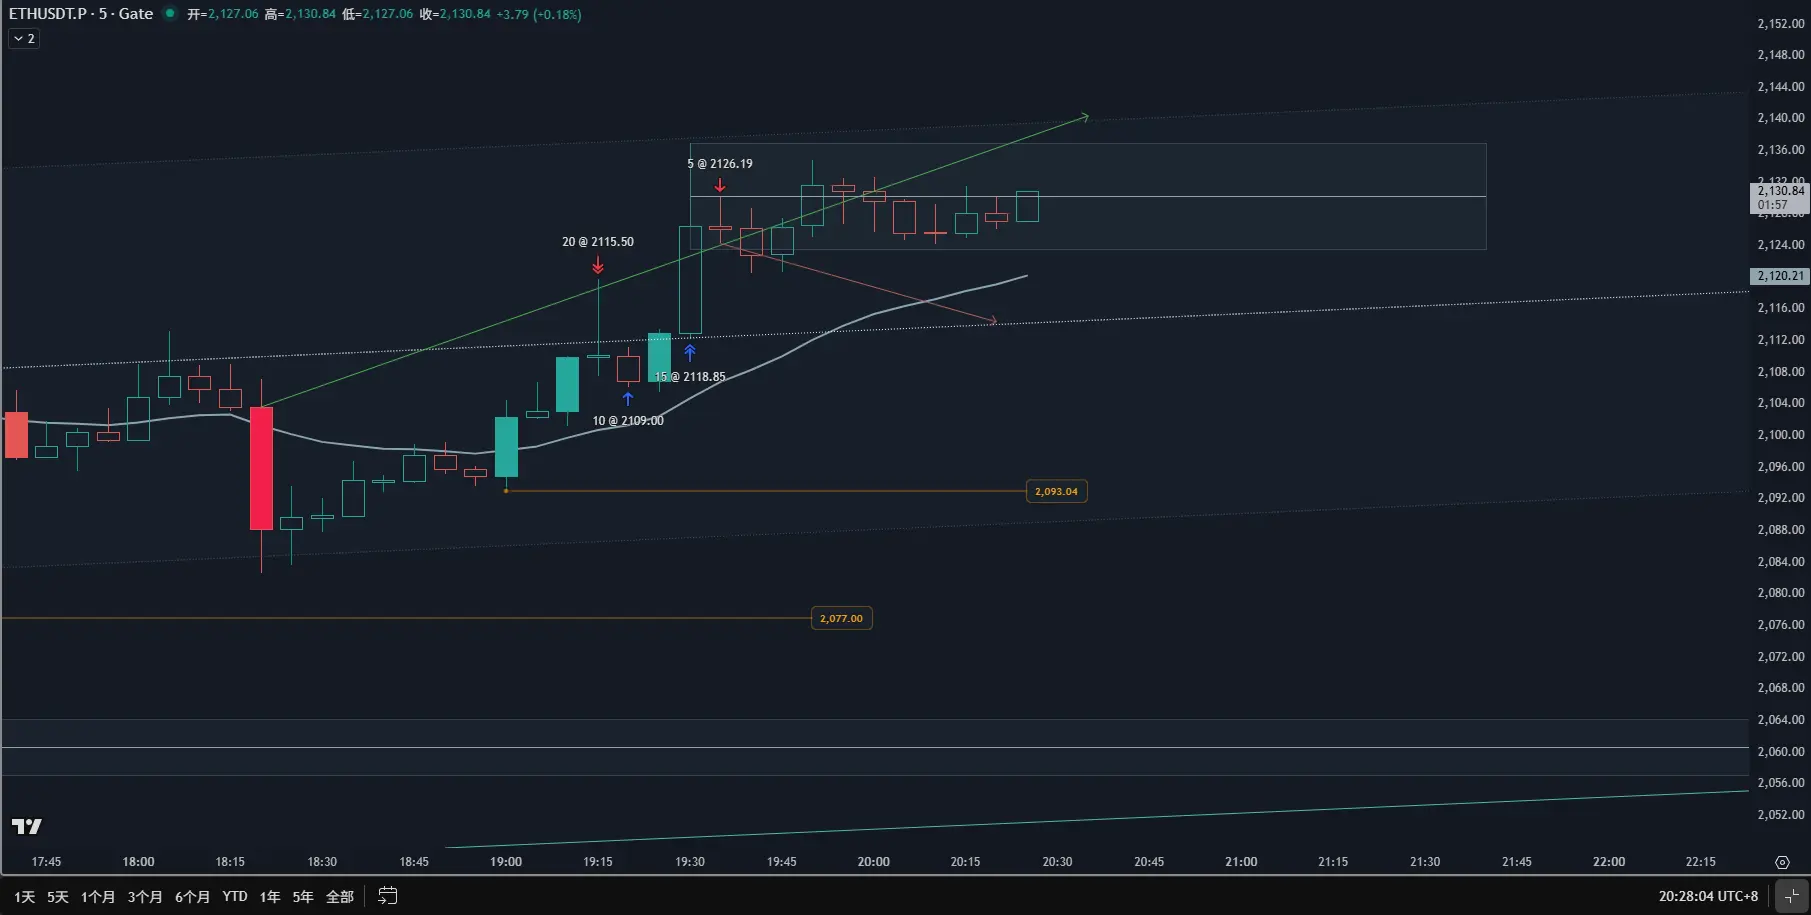
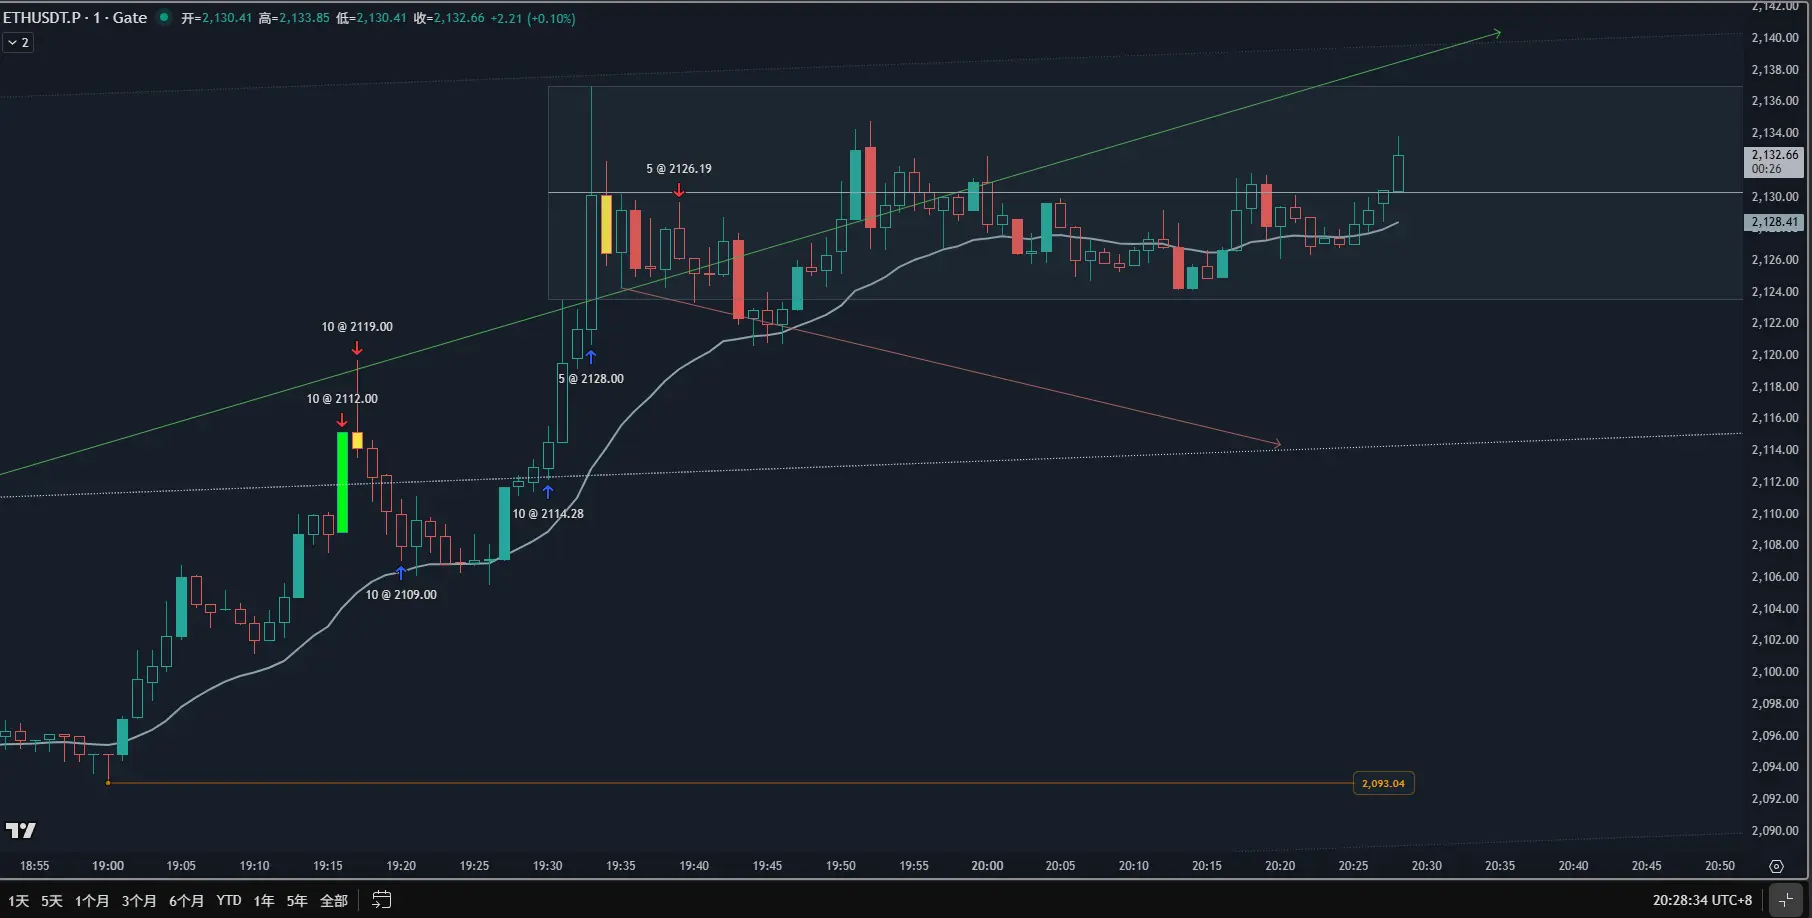
如果 $ETH$ 价格強力跌破 1992.8 且未能迅速收回: -結構轉變:這標誌著 C 段通道(Channel)的徹底終結,市場可能從“震盪向上”轉為**“空頭趨勢”或進入更寬幅的“深度區間交易”**。 -MTR 觀察:這可能演變為主要趨勢反轉(Major Trend Reversal)。如果跌破後出現空頭強勢跟進(Follow-through),我會放棄多頭計劃,轉而尋找反抽 EMA20 後的做空機會。 -陷阱可能性:若跌破 1992.8 後立即出現長下影線並快速收回,“假跌破” (Failed Bear Breakout)。這反而是一個更高勝率的陷阱架構。 -一句話總結:跌破不恐慌,關鍵看跟進(Follow-through)。無跟進則可能是陷阱,強跟進則意味著趨勢反轉。拒絕死扛!復盤我在 ETH 2130 壓力位的兩次“刀尖舔血”操作 🛡️
面對週末的大震盪,很多人在等“神預測”,而我在等“信號”。分享今天 20 分鐘內,我如何通過我的私人指標和風控邏輯,完成一次精準收割與极速撤退。
1️⃣ 保命操作:在壓力位,先做“滑頭”再做“信徒”實戰(19:16): BTC 在 6 萬關口徘徊,ETH 觸及 4H 下降通道上軌壓力區。
邏輯: 觀察到 2,120 附近抛壓密集,我以 2,115.5 均價分批開空。平倉: 19:30 價格下探 2,114 附近,發現 20 EMA 支撐強勁,果斷止盈落袋 +1.26%。
心得: 面對回撤,首要動作是降息預期與鎖定利潤,絕不讓盈利變虧損。
2️⃣ 心態建設:承認“突破失敗”,是止損的最高境界博弈(19:33): 空單止盈後,ETH 放量上攻嘗試突破。基於“趨勢確認”邏輯,我以 2,128 嘗試追多。撤退(19:39): 僅僅 6 分鐘,價格受阻於 2,130 關口回落。
決斷: 發現陽線收盤實體不足 30%(我的私人指標核心邏輯),我意識到這是個假突破。我沒有祈禱,而是撤回所有高位掛單,並在 2,126.19 止損離場(-1.52%)。
3️⃣ 周末預測:6 萬大關前的震盪,預案重於預測目前的 BTC 和 ETH 都處於大通道的上軌邊緣。
·Plan A: 站穩 20 EMA 且實體占比突破 30%,我會重新
查看原文面對週末的大震盪,很多人在等“神預測”,而我在等“信號”。分享今天 20 分鐘內,我如何通過我的私人指標和風控邏輯,完成一次精準收割與极速撤退。
1️⃣ 保命操作:在壓力位,先做“滑頭”再做“信徒”實戰(19:16): BTC 在 6 萬關口徘徊,ETH 觸及 4H 下降通道上軌壓力區。
邏輯: 觀察到 2,120 附近抛壓密集,我以 2,115.5 均價分批開空。平倉: 19:30 價格下探 2,114 附近,發現 20 EMA 支撐強勁,果斷止盈落袋 +1.26%。
心得: 面對回撤,首要動作是降息預期與鎖定利潤,絕不讓盈利變虧損。
2️⃣ 心態建設:承認“突破失敗”,是止損的最高境界博弈(19:33): 空單止盈後,ETH 放量上攻嘗試突破。基於“趨勢確認”邏輯,我以 2,128 嘗試追多。撤退(19:39): 僅僅 6 分鐘,價格受阻於 2,130 關口回落。
決斷: 發現陽線收盤實體不足 30%(我的私人指標核心邏輯),我意識到這是個假突破。我沒有祈禱,而是撤回所有高位掛單,並在 2,126.19 止損離場(-1.52%)。
3️⃣ 周末預測:6 萬大關前的震盪,預案重於預測目前的 BTC 和 ETH 都處於大通道的上軌邊緣。
·Plan A: 站穩 20 EMA 且實體占比突破 30%,我會重新
- 打賞
- 按讚
- 回覆
- 轉發
- 分享
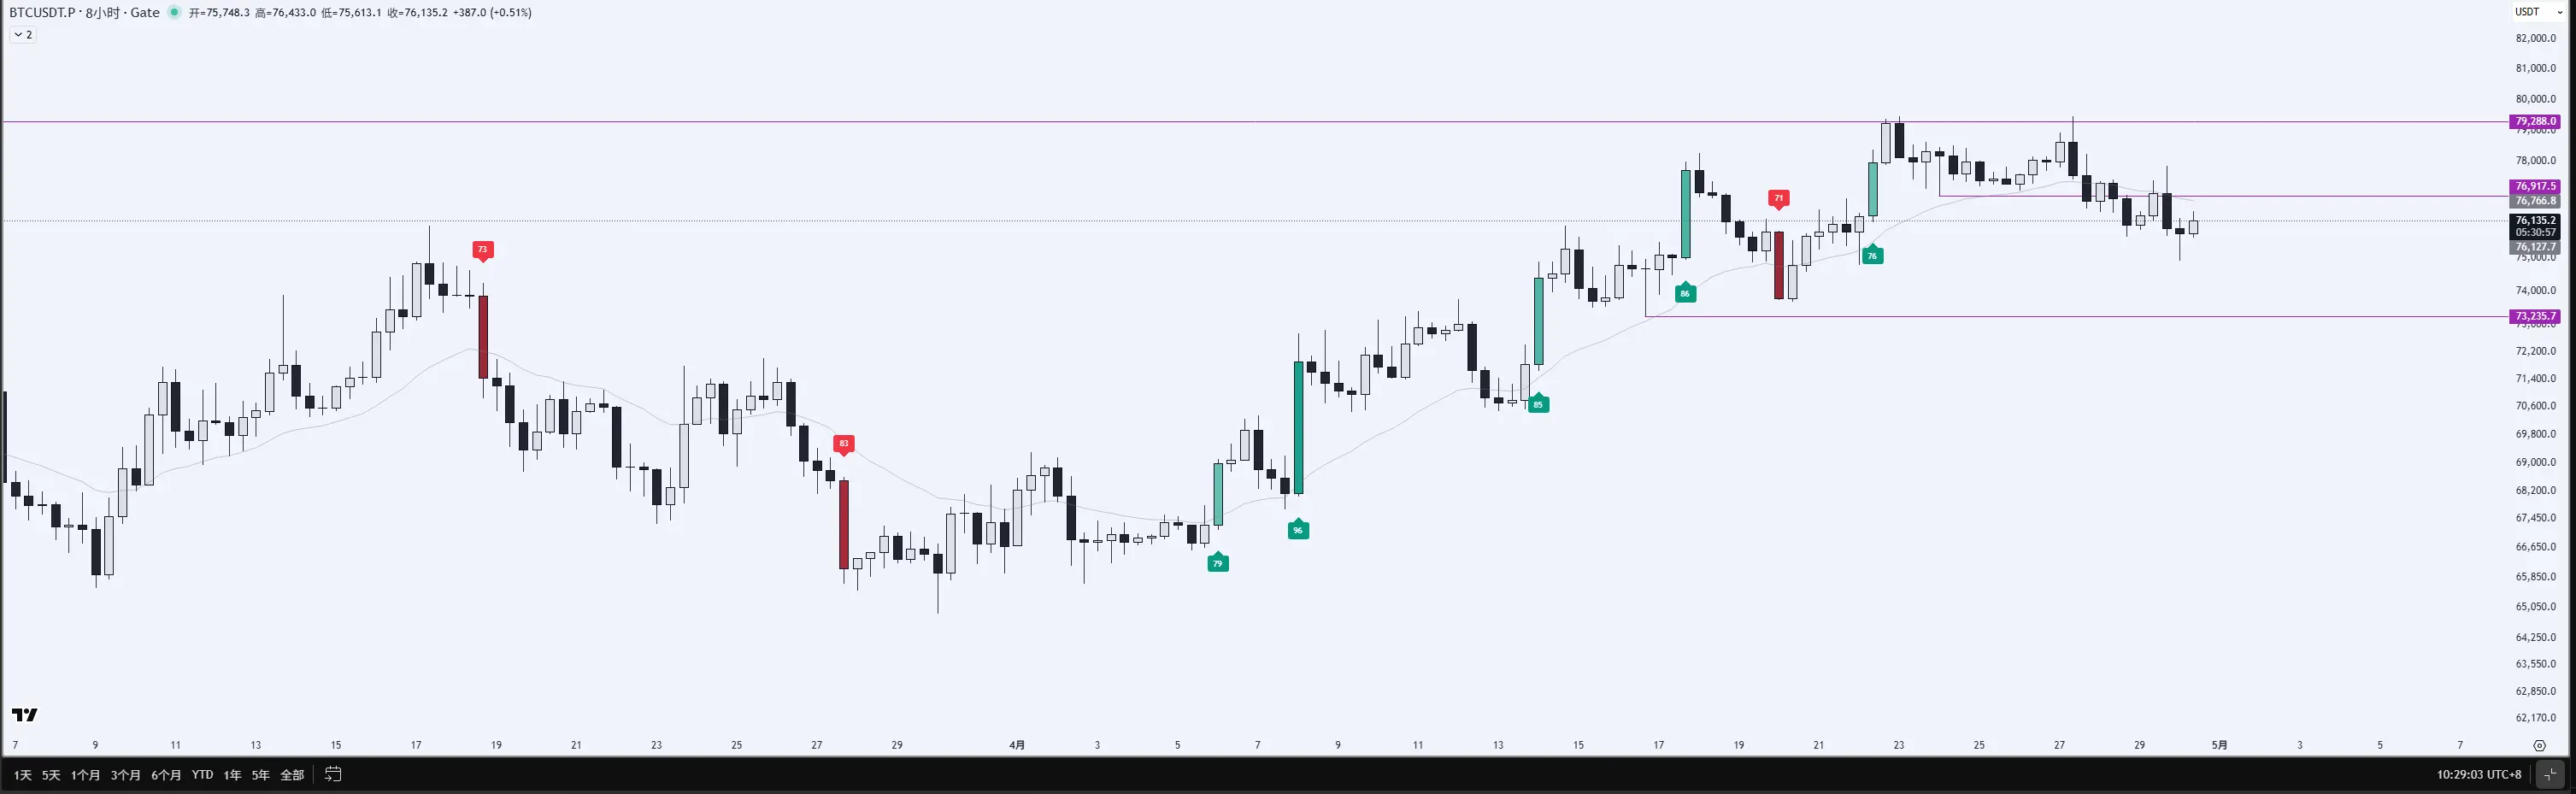
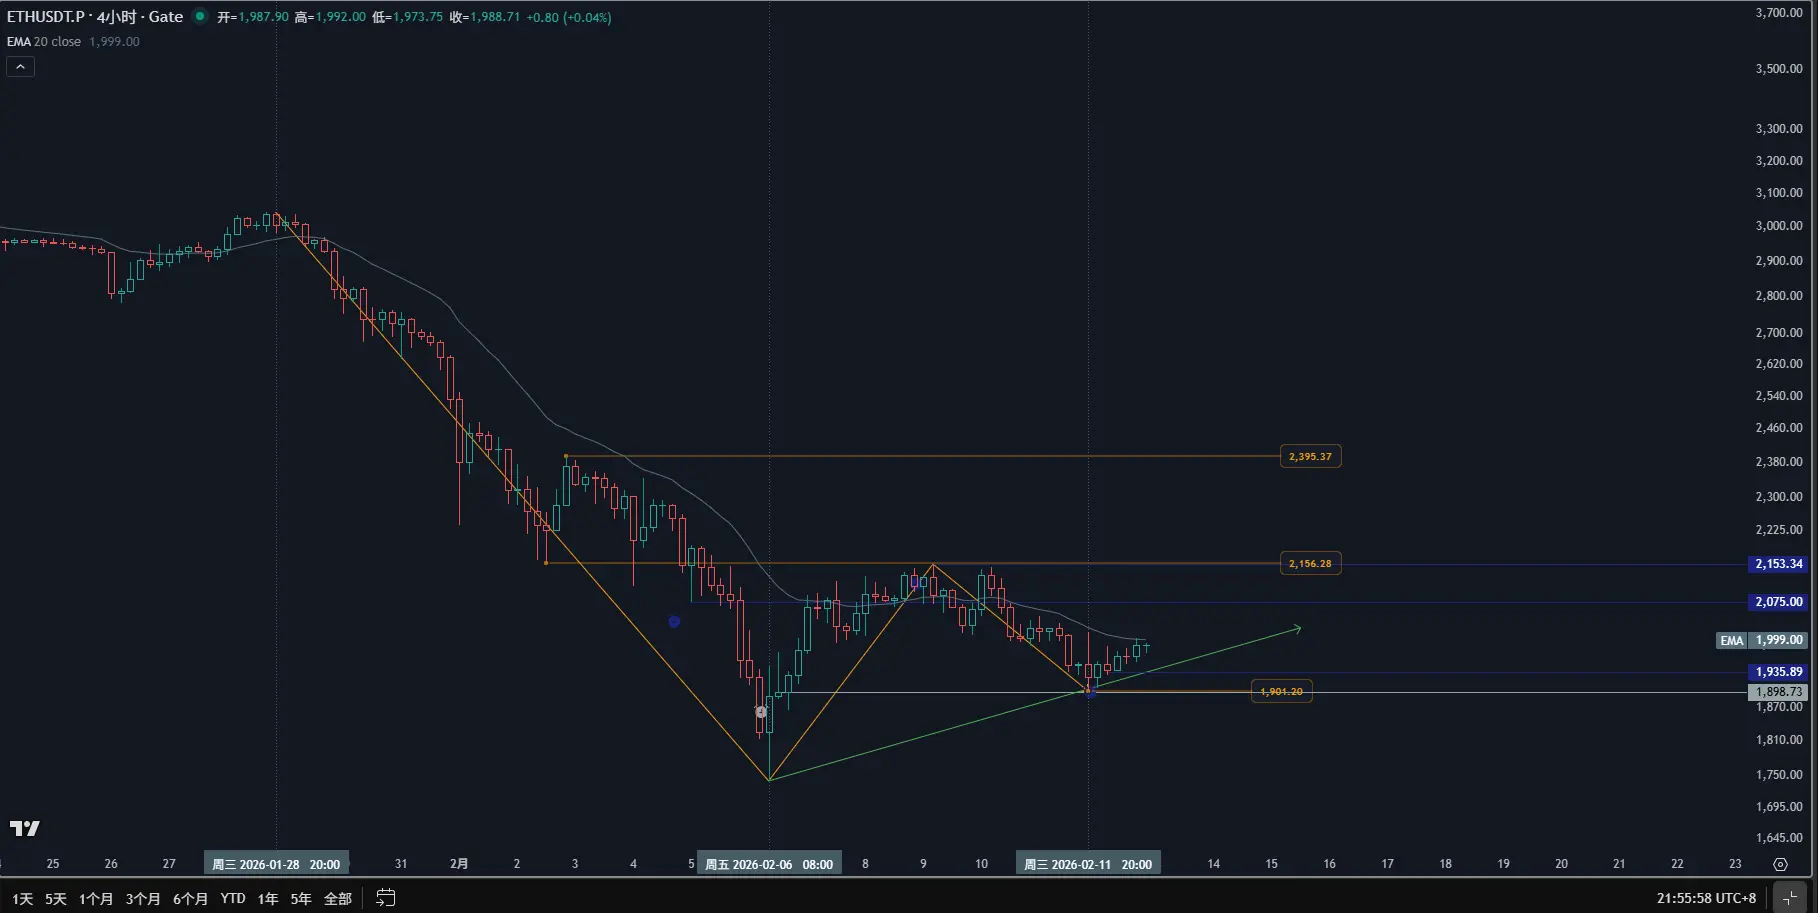
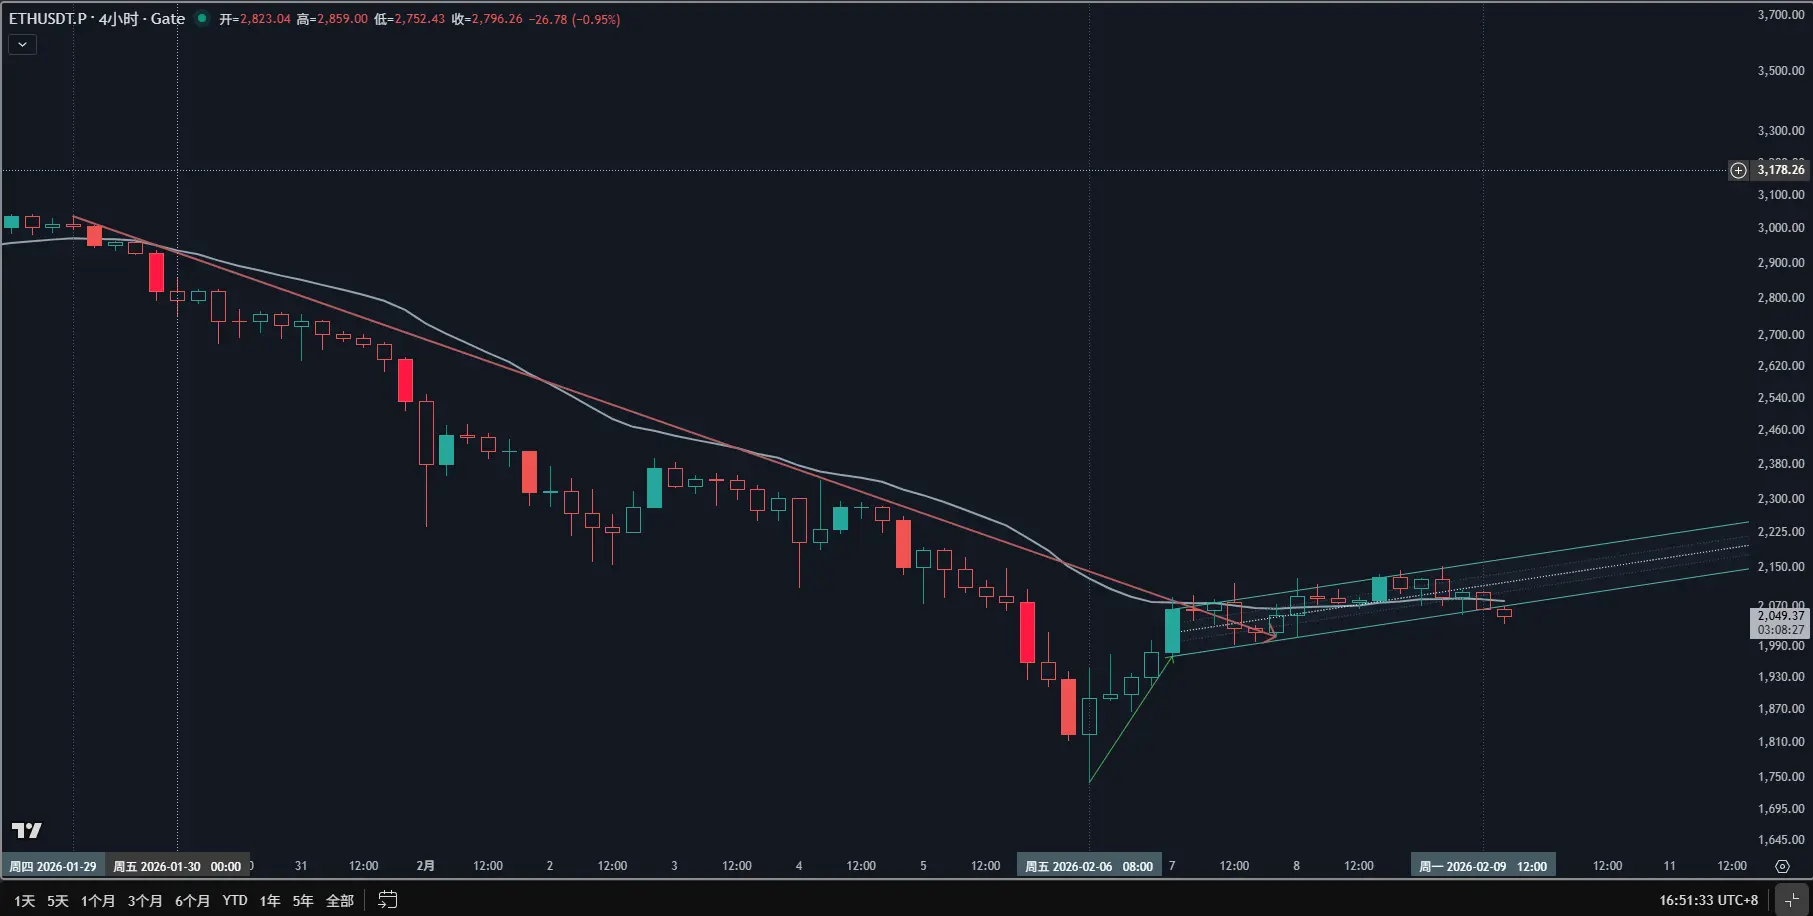
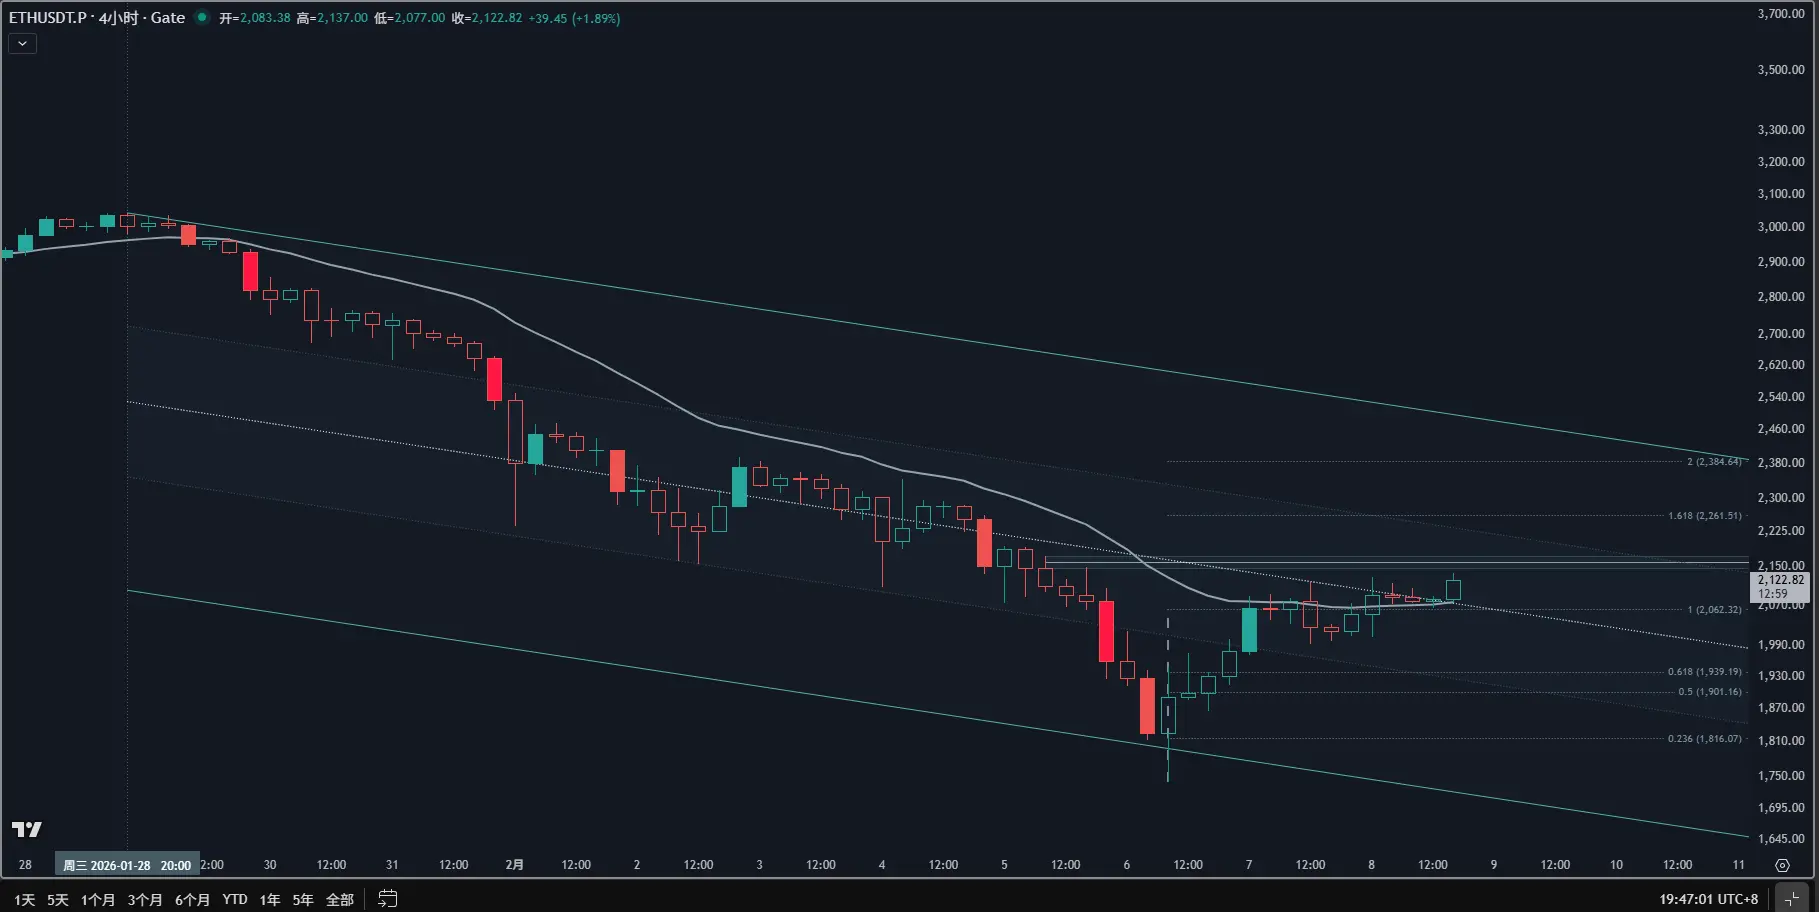
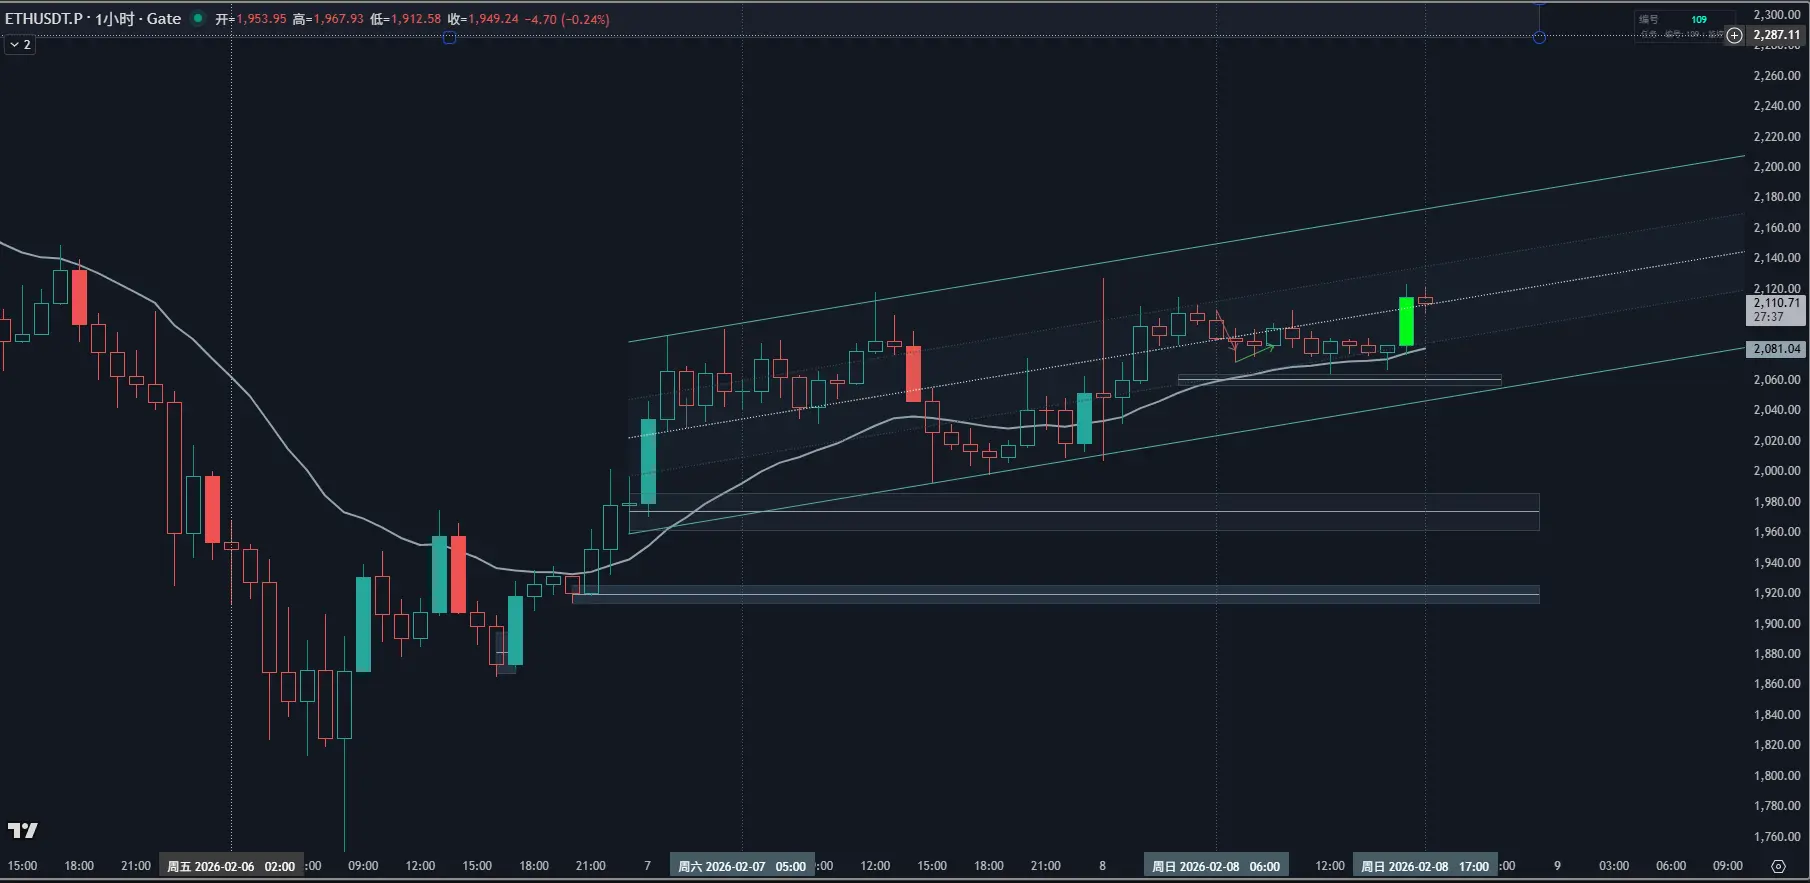
2026.2.8 19:50 ETH 4小時 (4H) 最新圖表及歷史行情,我們可以從價格行為 (PA) 的結構角度,深度分析當前處於“下跌通道”的可能性及其後續演變概率:
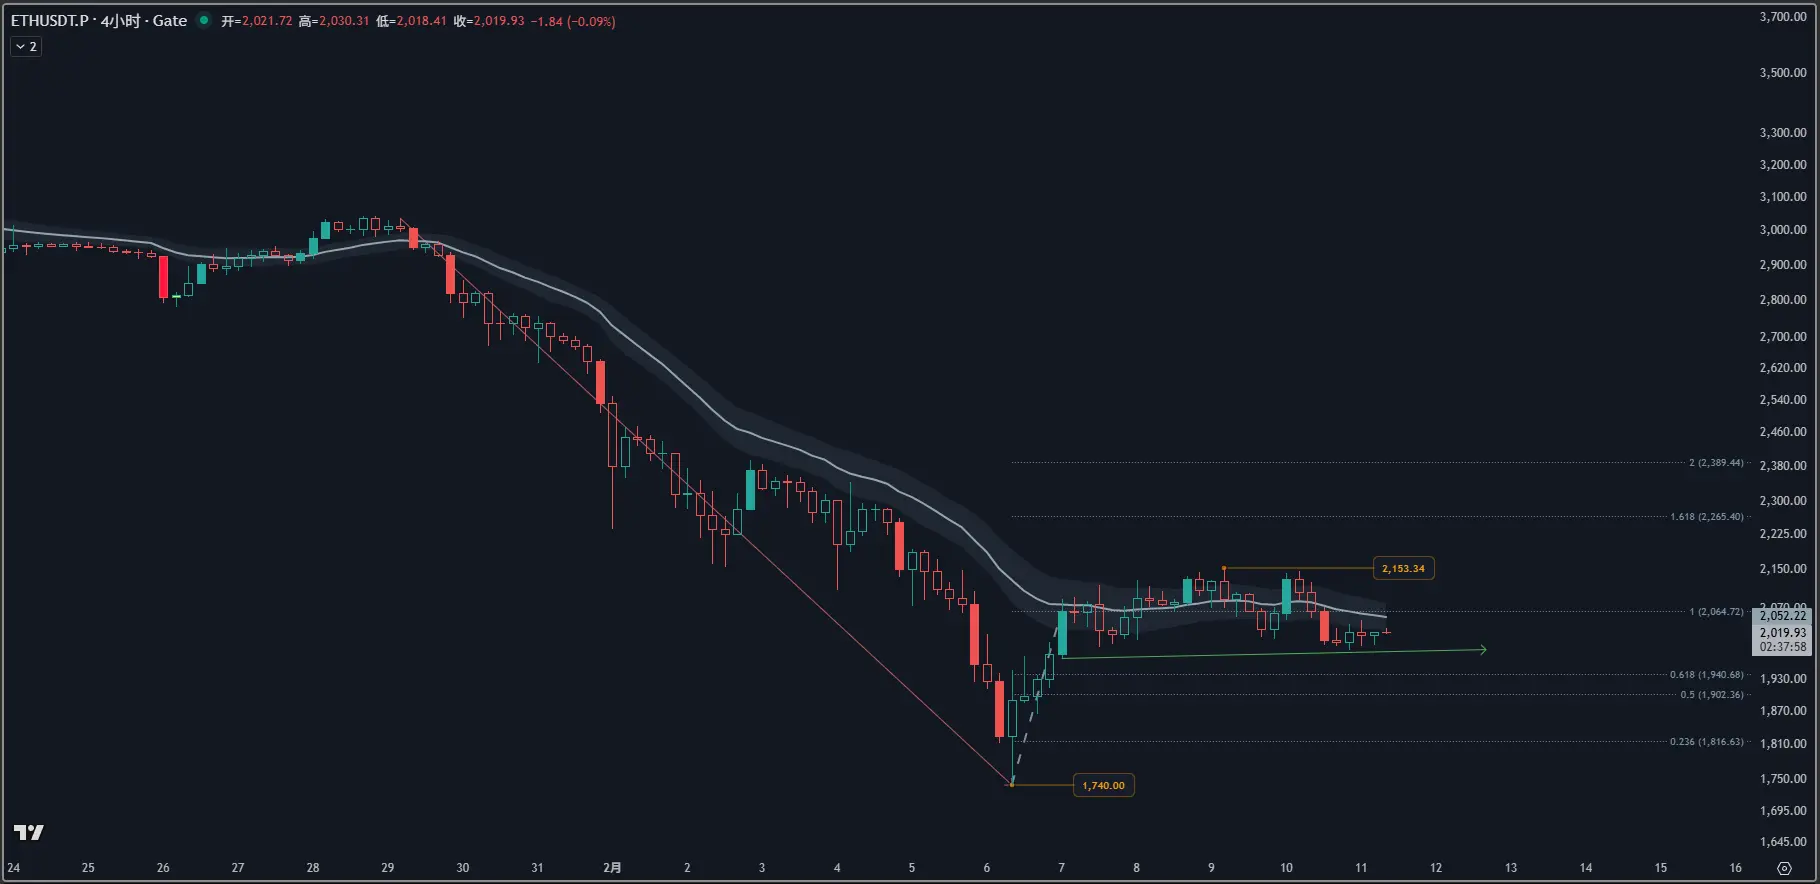
1. 結構形態分析:下跌通道的現狀從圖表中可以清楚看到,ETH 自 1 月底從 $3,000$ 上方跌落以來,價格長期受制於一個斜向下的壓力線,並伴隨斜向下的支撐線,構成了一個標準的大型下降通道 (Descending Channel)。
·当前位置: 价格目前正处于该通道的中轨上方,并尝试挑战通道的上轨压力区。
·关键特征: 20 EMA 目前已开始走平并有微弱上拐趋势,价格站稳在 EMA 之上,这在下降通道中属于“强力反弹”阶段。
2. 維持“下跌通道”持續下跌的概率:約 40%雖然目前大背景是下降通道,但以下信號表明單純維持下跌的動能正在減弱:
·低點不再降低: 2 月 6 日下探 $1,740$ 附近後,形成了一個明顯的极速 V 转 (Spike)。
·底部支撐強勁: 隨後的回踩並未創造新低,反而重心逐步上移。
概率評估: 如果價格無法放量突破通道上軌(約 $2,150 - 2,180$ 區域),則行情仍有 40% 的概率受阻回落,繼續在通道內向下運行測試底部。
3. 通道演變為“底部反轉/箱體震蕩”的概率:約 60%從 PA 指標和成交記錄來看,市場正在發生結構性變化:Spike
ETH-2.39%
- 打賞
- 1
- 回覆
- 轉發
- 分享
萬千代幣,我獨寵以太:致我的“心動標的”ETH 💌
有人在追逐暴漲暴跌的土狗,有人在玫瑰叢中尋找浪漫,而作為一名價格行為(PA)交易員,在這個“奔赴熱愛”的日子裡,我只想实名告白我的最愛——ETH。為什麼我對他“非他不可”?理由很簡單,也很硬核:
1️⃣ 他是最有“節奏感”的伴侶
在我的交易系統中,ETH 的走勢總是那麼優雅且符合邏輯。無論是 1H 級別的箱體突破,還是 10min 通道的穩步攀升,他總能精准地踩在我的 20 EMA 支撐線上。相比於那些上跳下竄、不講道理的代幣,ETH 給了我職業交易員最需要的確定性。
2️⃣ 他教我學會“去偽存真”
我堅持使用**“30% 實體準則”**來過濾市場噪音。ETH 的盤面就像一面鏡子:當他走出飽滿的趨勢棒(tB)時,那是他給我的“緊迫感”告白;當他走出碎步十字星時,那是他在提醒我保持冷靜。這種“高純度”的信號,是我在幣圈生存的保命符。
3️⃣ 我有我的“守護計劃”
愛不是盲目的。對於 ETH,我始終留有預案:
心動位置:我在等他回踩 2050(前期箱體頂)或 2030(通道底部)。
守護底線:如果他跌破 2010 生命週期線,我會理智轉身,等待下一次更好的遇見。
告白總結:
在 Gate 廣場遇見 ETH,是我在交易路上最心動的瞬間。他不一定是最瘋狂的,但一定是最懂我邏輯的。這個情人節,不看玫瑰看 K 線,守住我的 ETH,就是最穩
ETH-2.39%
- 打賞
- 按讚
- 回覆
- 轉發
- 分享
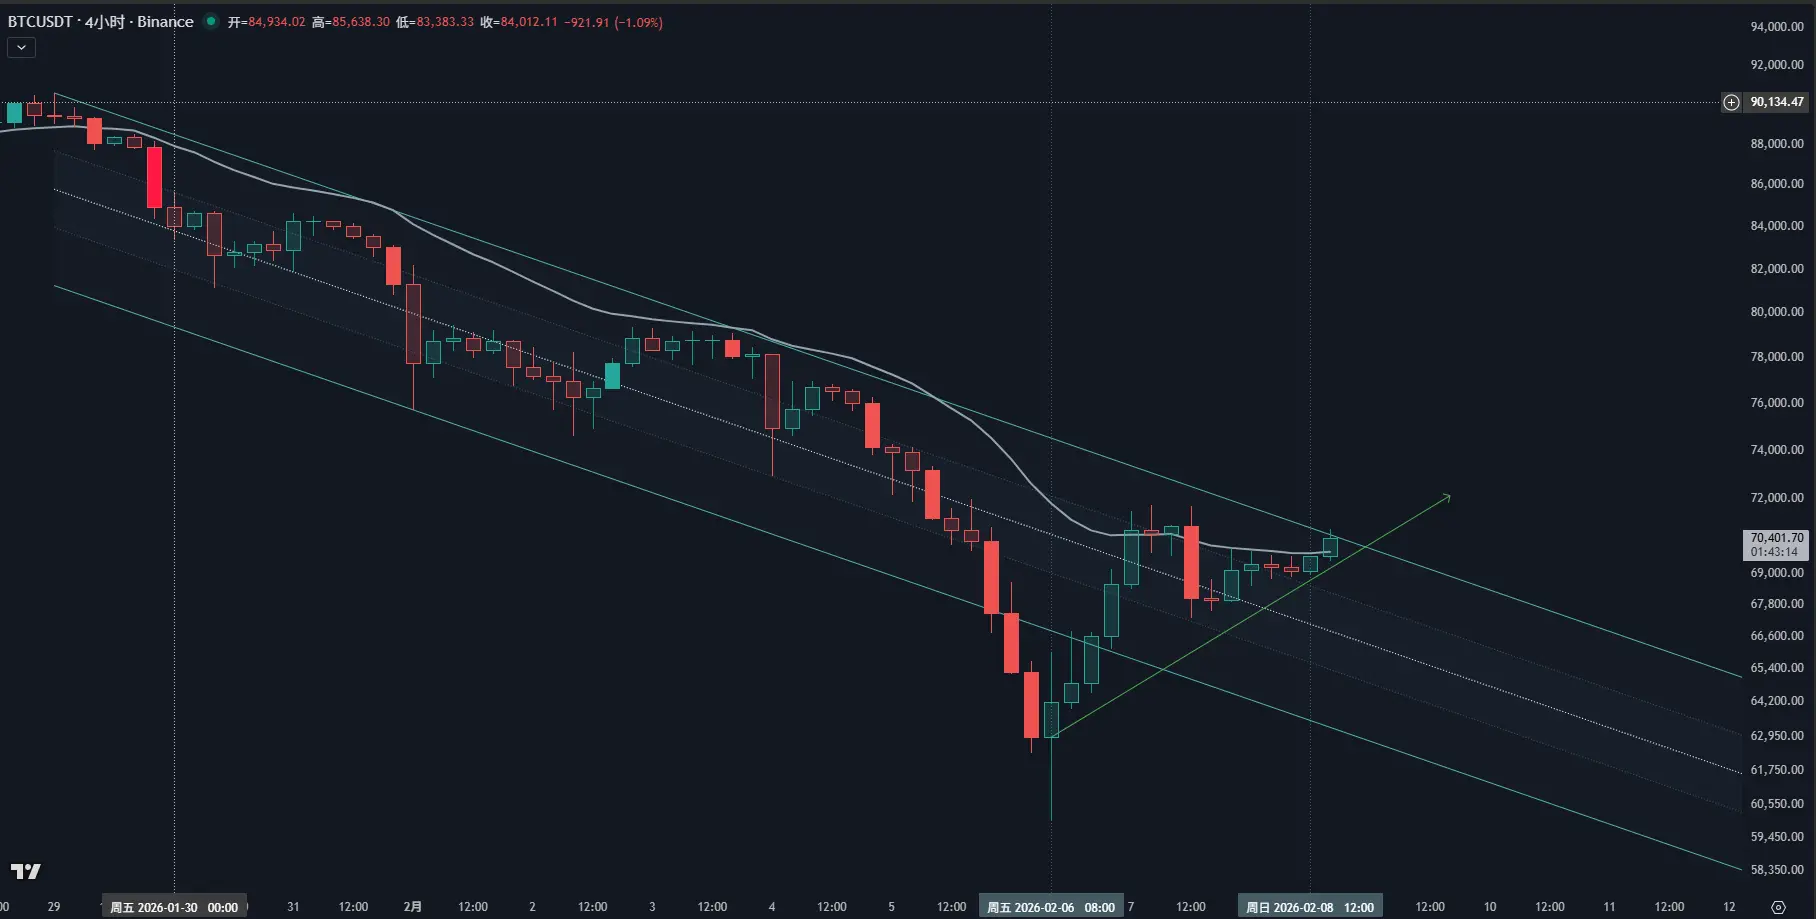
BTC 6萬大關決戰!是“誘空坑”還是“黃金底”?職業交易員的周末生存預案 🛡️
大盤跌跌不休,BTC 再次面臨 6 萬大關的生死考。與其在焦慮中盲目抄底,不如亮出你的 K 線邏輯。作為一名堅持價格行為(PA)的交易員,分享一下我的周末避險與應對祕訣:
1️⃣ 保命操作:過濾噪音,靜待“結構性”回歸
面對本輪劇烈回撤,我的首要動作不是急著操作,而是鎖定大周期趨勢。
·觀察點: 4H 級別 BTC 處於一個清晰的下降通道。
·保命邏輯: 在下降通道未被放量突破前,任何反彈都視為“空頭旗形”。
·我的準則: 只有當 30min 級別走出實體飽滿的放量陽線,且有效站穩 20 EMA 時,我才會考慮右側入場。
2️⃣ 心態建設:拒絕“抄底衝動”,只等“二次確認”
行情上跳下窜最容易引發情緒交易。
·我的克制之道是建立“入場緩衝區”:
·不摸絕對底: 即使 BTC 在 60,000 附近止跌,我也不會第一時間滿倉。
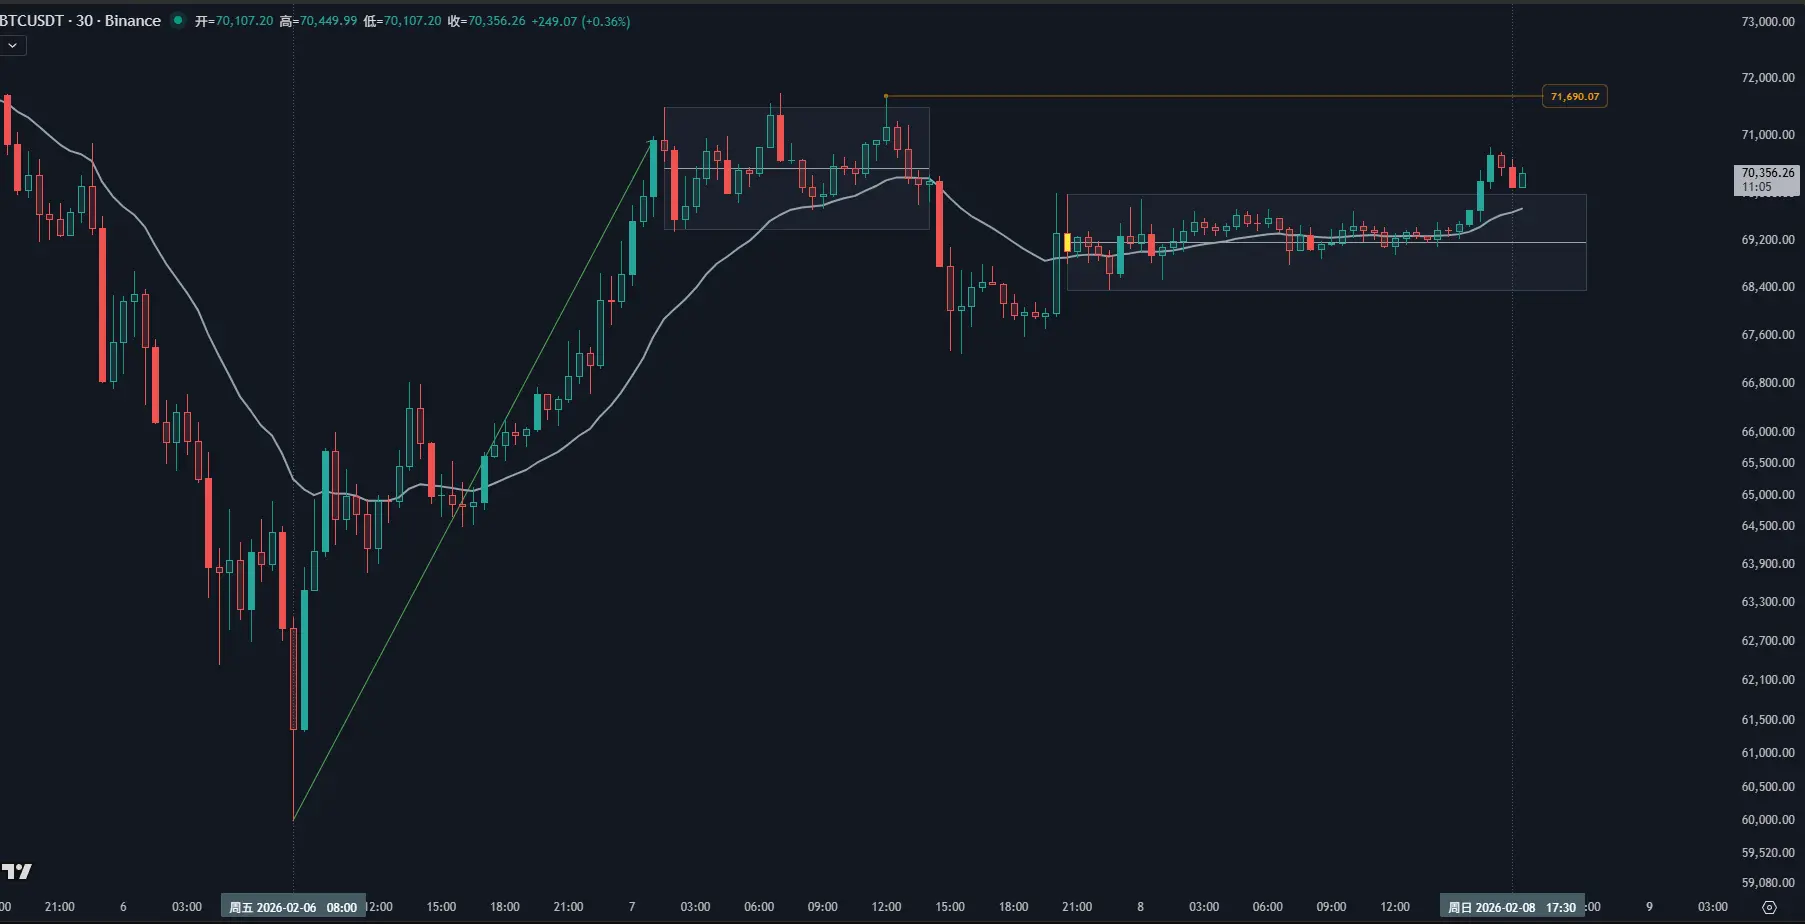
·等待測試: 我在等 30min 級別回踩前期箱體(約 69,200 區域)並獲得支撐的信號。
·感悟: 寧可錯過第一波反彈,也不要在下跌慣性中接飛刀。承認打臉,比死扛頭寸更重要。
3️⃣ 周末神預測:多空劇本的“雙向應對”
我不預測絕對漲跌,只做應對預案:
🚀 暴力反彈劇本: 若 30min 級別放量站上 71,690 关键阻力並伴隨陽線 tB,預示著 V 轉結構開啟,目標
大盤跌跌不休,BTC 再次面臨 6 萬大關的生死考。與其在焦慮中盲目抄底,不如亮出你的 K 線邏輯。作為一名堅持價格行為(PA)的交易員,分享一下我的周末避險與應對祕訣:
1️⃣ 保命操作:過濾噪音,靜待“結構性”回歸
面對本輪劇烈回撤,我的首要動作不是急著操作,而是鎖定大周期趨勢。
·觀察點: 4H 級別 BTC 處於一個清晰的下降通道。
·保命邏輯: 在下降通道未被放量突破前,任何反彈都視為“空頭旗形”。
·我的準則: 只有當 30min 級別走出實體飽滿的放量陽線,且有效站穩 20 EMA 時,我才會考慮右側入場。
2️⃣ 心態建設:拒絕“抄底衝動”,只等“二次確認”
行情上跳下窜最容易引發情緒交易。
·我的克制之道是建立“入場緩衝區”:
·不摸絕對底: 即使 BTC 在 60,000 附近止跌,我也不會第一時間滿倉。
·等待測試: 我在等 30min 級別回踩前期箱體(約 69,200 區域)並獲得支撐的信號。
·感悟: 寧可錯過第一波反彈,也不要在下跌慣性中接飛刀。承認打臉,比死扛頭寸更重要。
3️⃣ 周末神預測:多空劇本的“雙向應對”
我不預測絕對漲跌,只做應對預案:
🚀 暴力反彈劇本: 若 30min 級別放量站上 71,690 关键阻力並伴隨陽線 tB,預示著 V 轉結構開啟,目標
BTC-1.38%
- 打賞
- 1
- 回覆
- 轉發
- 分享
交易不是賭博,而是對“Plan B”的極致執行
ETH 在 2100 附近的震盪,讓很多人陷入了非黑即白的糾結。但我認為,一個職業交易員的視角裡不應該有“一定”,而應該有“預案”。
目前我的多頭計劃雖然明確,但我為自己留了足夠的緩衝餘地,防止“被打臉”:
-多頭預案(Plan A):我傾向在 2067 極值點破位後,尋找 2050(前期箱體頂)或 2030(通道底部)的支撐。如果這裡能出現 30% 實體以上的陽線確認,我會果斷切入。
-震盪預案(Plan B):如果價格在 20 EMA 附近形成窄幅橫盤,我不會在區間內盲猜方向。我會等待它走出“區間突破+回踩確認”的組合拳,用空間的確定性換取時間的安全。
-反轉警戒線(風控):交易不能一廂情願。如果回調演變成了連續飽滿的陰線跌破 2010(這波起漲點的生命線),我會毫不猶豫地撤銷所有多單計劃。
交易感悟:
我們要做的不是預測價格會跌到哪,而是預定好**“在什麼位置、看到什麼信號、做多少倉位”**。留有餘地,才不會在市場反轉時手忙腳亂。
#当前行情抄底还是观望? #ETH #职业交易员 #风险管理
ETH-2.39%
- 打賞
- 2
- 1
- 轉發
- 分享
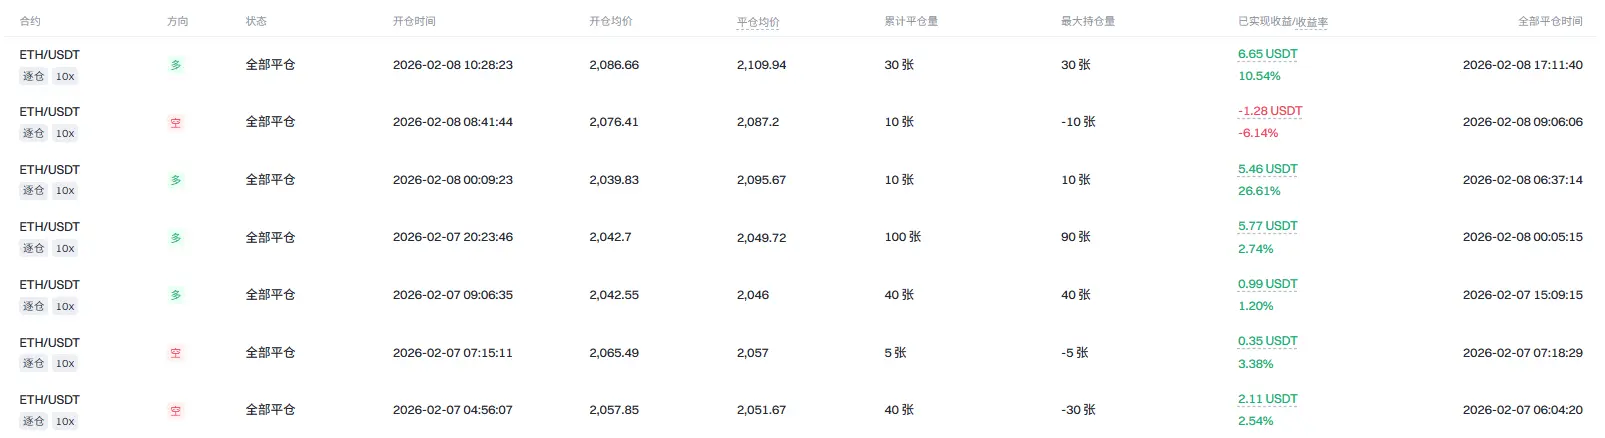
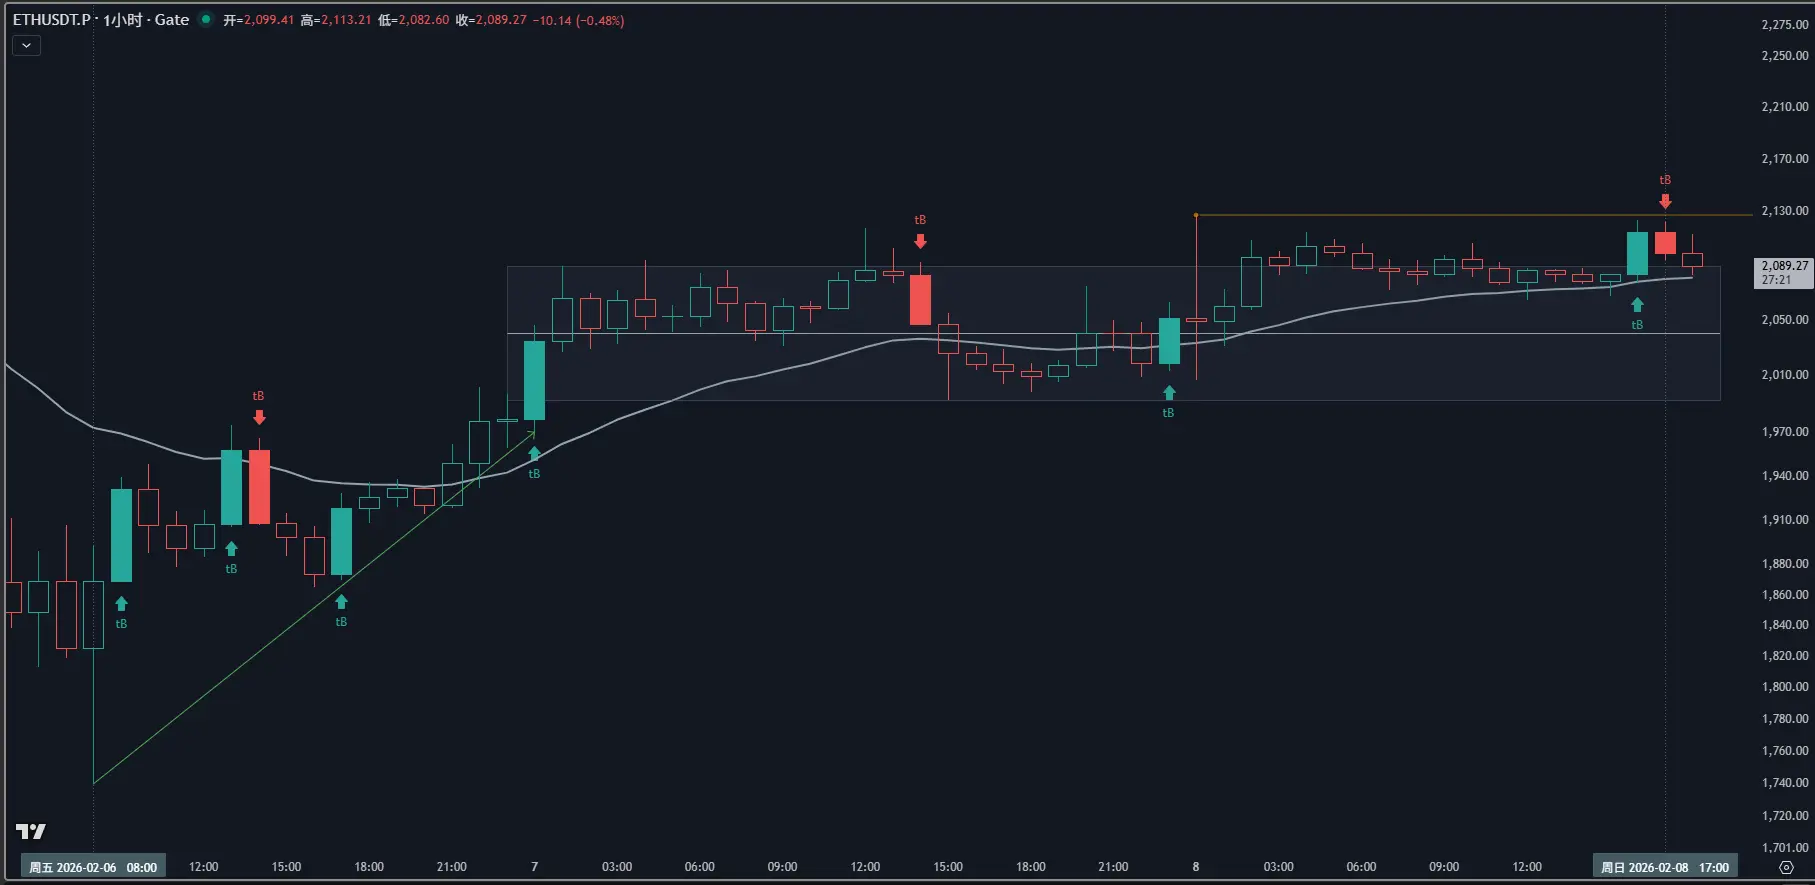
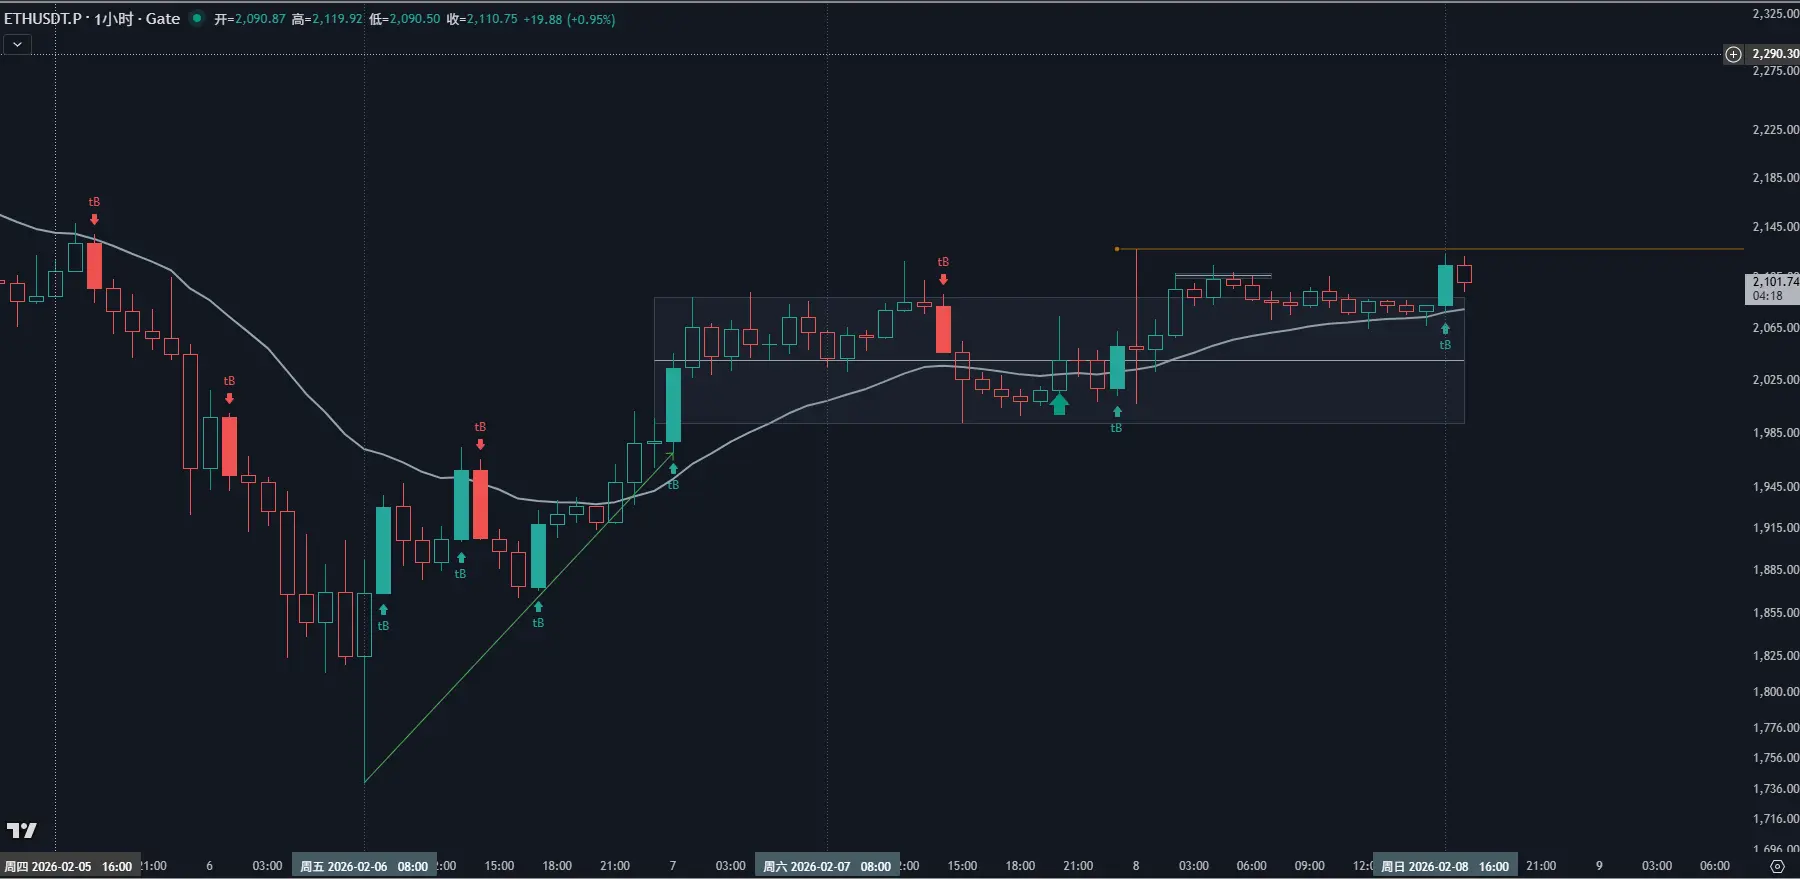
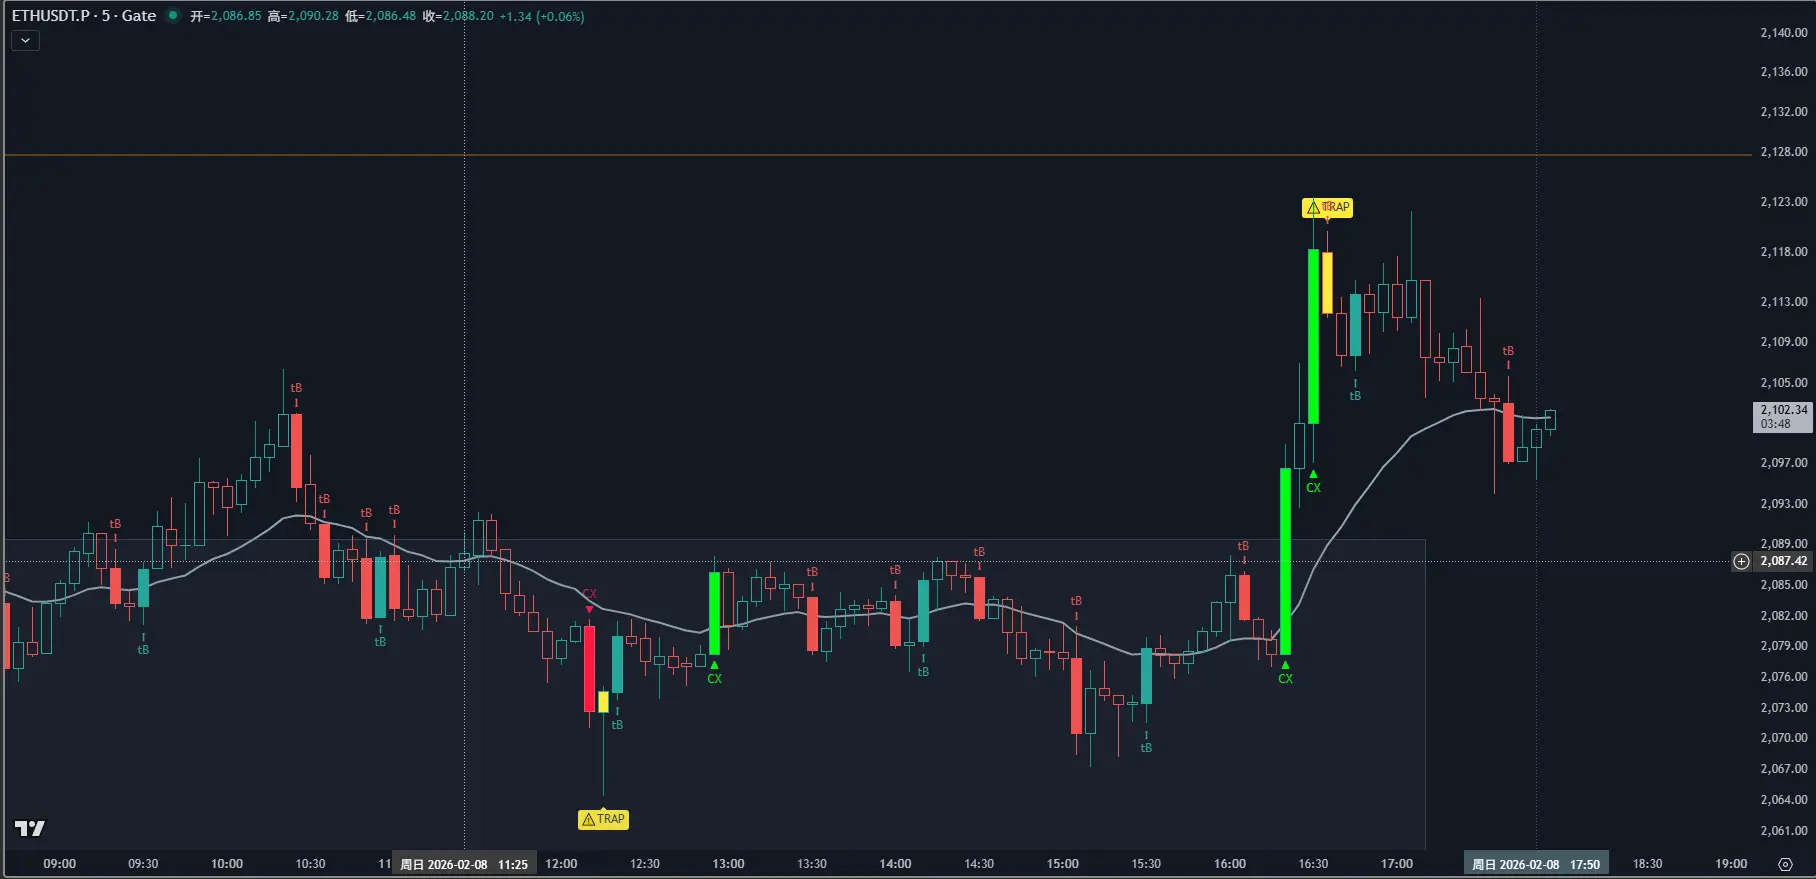
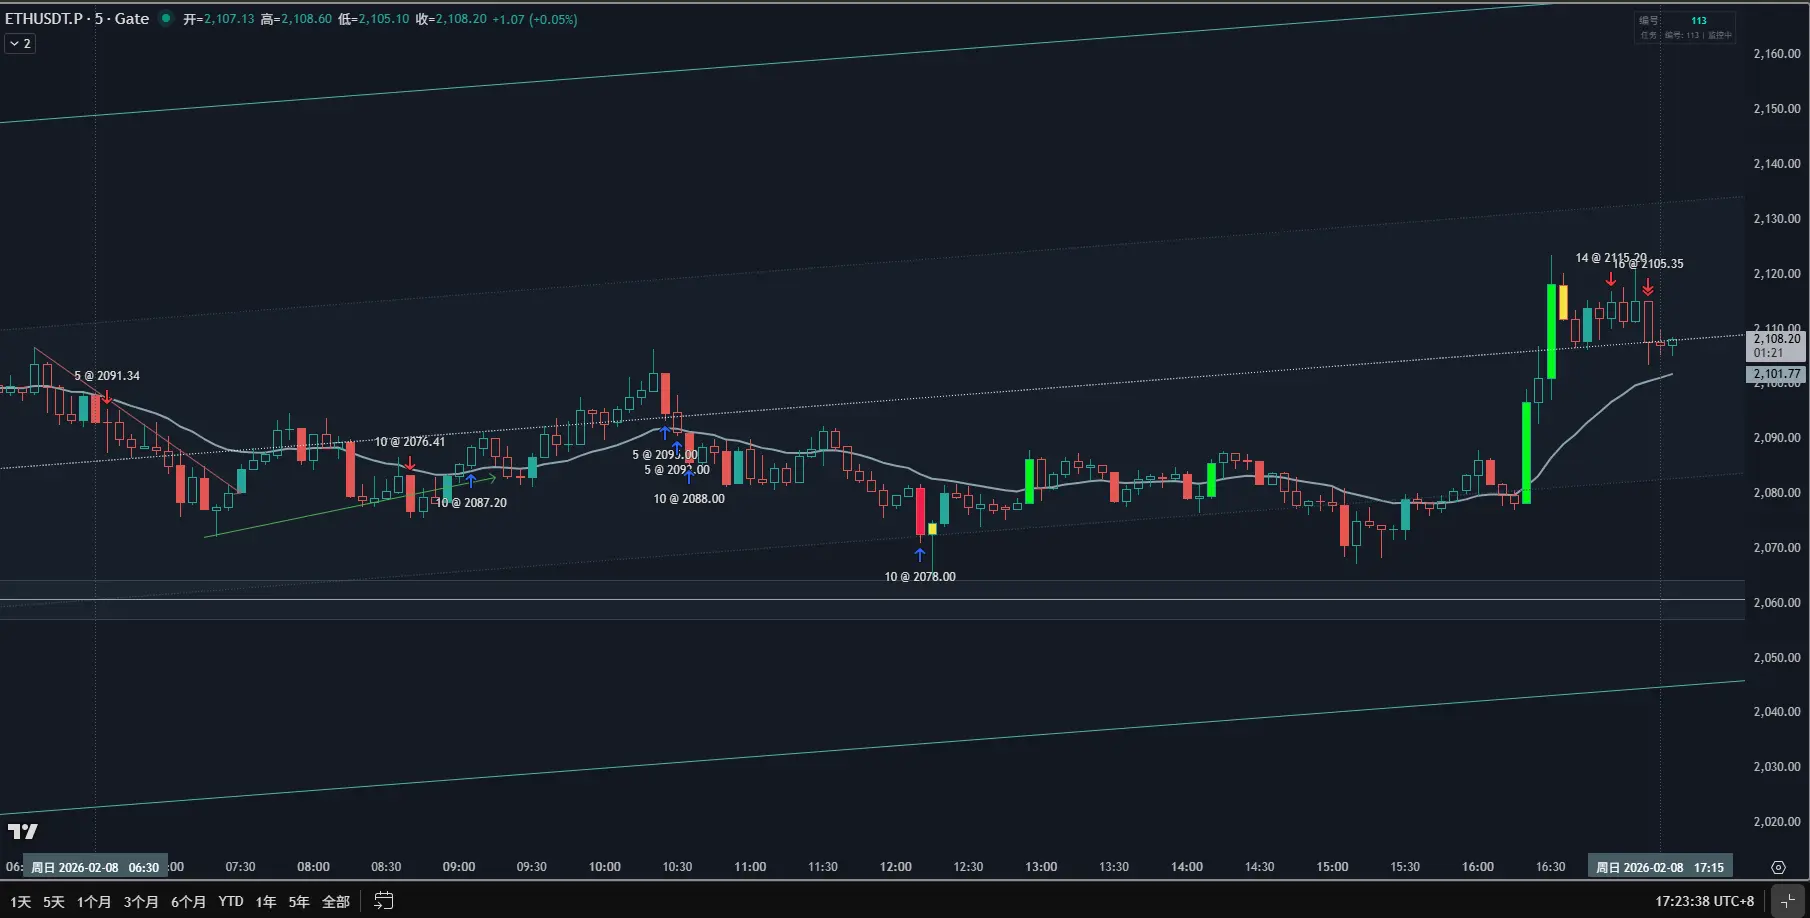
2026.2.8 復盤
交易標的: ETH/USDT 永續合約
核心邏輯: PA Master + 20 EMA 支撐邏輯
1.實戰復盤:止損不是失敗,是下一次盈利的門票❌ 錯誤摸頂 (08:41 - 09:06)
開倉位: 2076.41 (空)邏輯: 1H 級別觸及箱體上沿,5min 出現長上影線,以為要回調。
復盤: 雖然有阻力,但價格始終未跌破 20 EMA。在強趨勢裡,EMA 就是磁鐵,不破 EMA 不言頂。
感悟: 09:06 發現突破前高,我果斷止損(-6%)。止損要快,快到不帶一絲情感,這是生存的第一法則。
2.✅ 順勢修復 (10:28 - 17:11)開倉位: 2086.66 (多)
邏輯: 止損後發現多頭強勢回歸,5min 出現 30% 過濾後的實體 tB。
過程: 12:00 左右回撤 2078 附近,精準踩在 20 EMA 支撐位,我果斷進行了分批補倉。
止盈: 17:00 左右,5min 出現極長實體的 CX (高潮棒)。
根據 Brooks 理論,高潮後必有修整。我在 2115 和 2105 附近分批結清,獲利 10.54%。
3. 給粉絲的 3 點 PA 建議
尊重 EMA 的斜率: 只要 20 EMA 斜向上且價格在上方,任何陰線都是買入機會(Pullback),而不是開空理由。
過濾噪音: 5min 周期干擾太多。試著像我一樣 Doji 過濾,只
ETH-2.39%
- 打賞
- 1
- 1
- 轉發
- 分享


熱門話題
查看更多38.03萬 熱度
9099 熱度
70.94萬 熱度
16265.66萬 熱度
86.64萬 熱度
置頂
🔥 WCTC S8 全球交易賽正式開賽!
8,000,000 USDT 超級獎池解鎖開啟
🏆 團隊賽:上半場正式開啟,預報名階段 5,500+ 戰隊現已集結
交易量收益額雙重比拼,解鎖上半場 1,800,000 USDT 獎池
🏆 個人賽:現貨、合約、TradFi、ETF、閃兌、跟單齊上陣
全場交易量比拼,瓜分 2,000,000 USDT 獎池
🏆 王者 PK 賽:零門檻參與,實時匹配享受戰鬥快感
收益率即時 PK,瓜分 1,600,000 USDT 獎池
活動時間:2026 年 4 月 23 日 16:00:00 - 2026 年 5 月 20 日 15:59:59 UTC+8
⬇️ 立即參與:https://www.gate.com/competition/wctc-s8
#WCTCS810,000 USDT 悬賞,尋找跟單金牌星探!🕵️
挖掘頂級帶單員,贏取高額跟單體驗金!
立即參與:https://www.gate.com/campaigns/4624
🎁 三大活動,獎金疊滿:
1️⃣ 慧眼識英:發帖推薦帶單員,分享跟單體驗,抽 100 位送 30 USDT!
2️⃣ 強力應援:曬出你的跟單截圖,為大神打 Call,抽 120 位送 50 USDT!
3️⃣ 社交達人:同步至 X/Twitter,憑流量贏取 100 USDT!
📍 標籤: #跟单金牌星探 #GateCopyTrading
⏰ 限時: 4/22 16:00 - 5/10 16:00 (UTC+8)
詳情:https://www.gate.com/announcements/article/50848✍️ Gate 廣場「創作者認證激勵計劃」進行中!
我們歡迎優質創作者積極創作,申請認證
贏取豪華代幣獎池、Gate 精美周邊、流量曝光等超過 $10,000+ 豐厚獎勵!
立即報名 👉 https://www.gate.com/questionnaire/7159
📕 認證申請步驟:
1️⃣ App 首頁底部進入【廣場】 → 點擊右上角頭像進入個人主頁
2️⃣ 點擊頭像右下角【申請認證】進入認證頁面,等待審核
讓優質內容被更多人看到,一起共建創作者社區!
活動詳情:https://www.gate.com/announcements/article/47889