移动平均线是加密交易中最常用的技术指标之一,因为它能将杂乱的价格波动转化为更清晰的趋势线。交易者不必对每根突然波动的 K 线做出反应,而是可以通过移动平均线判断价格总体是在上涨、下跌,还是横盘整理。
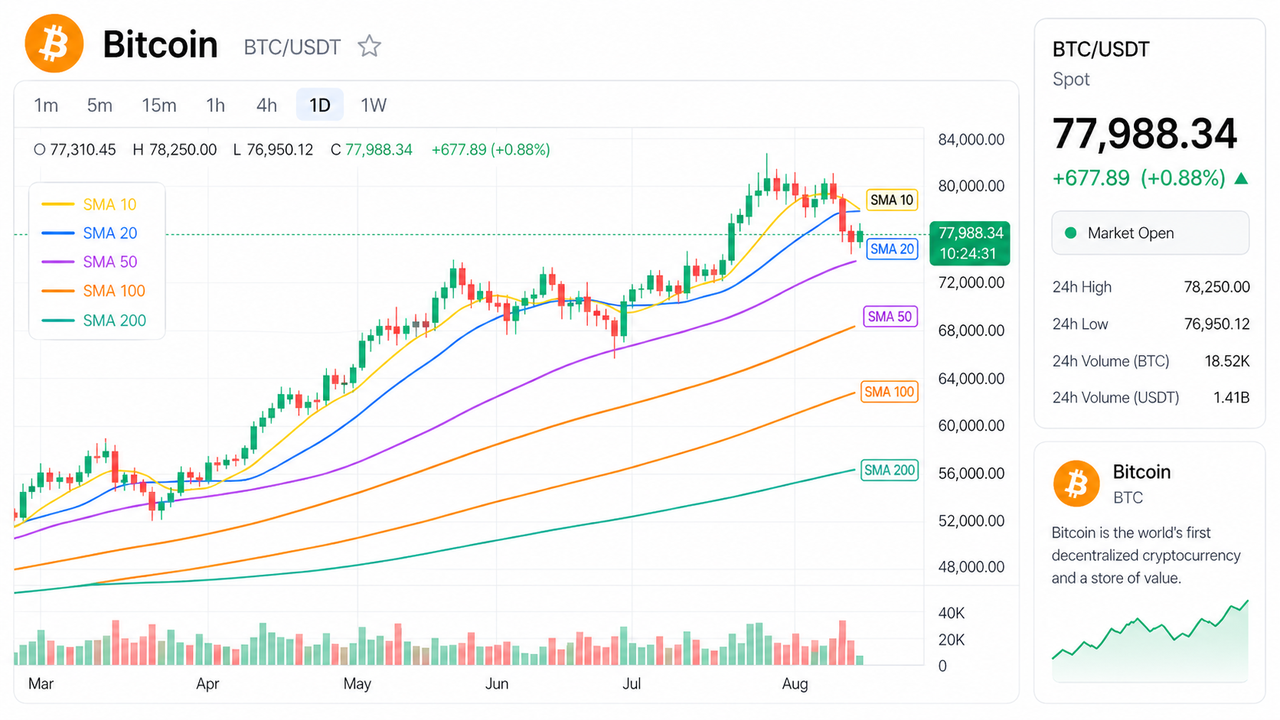
简单移动平均线(SMA)是最基础的移动平均工具之一。它通过计算一定周期内的收盘价平均值得到。例如,10 周期 SMA 统计最近 10 根 K 线的平均价格,而 200 周期 SMA 则统计最近 200 根 K 线。这个周期设定非常重要,因为它决定了均线对价格变化反应的快慢。
在波动快速的加密市场中,这种差异尤其重要。短周期 SMA 可以帮助交易者更快发现短期变化,但也更容易产生错误信号;长周期 SMA 反应较慢,但通常能更清晰地显示整体趋势。因此,许多交易者会结合多个 SMA 周期使用,而不是只依赖单一均线。
SMA 周期决定了什么
SMA 周期决定了均线计算时纳入多少历史价格数据。周期越短,使用的 K 线越少,因此均线越贴近当前价格;周期越长,纳入的数据越多,因此均线更平滑,反应也更慢。
例如,当比特币或其他加密资产价格快速波动时,SMA 10 会迅速做出反应,帮助交易者观察短期动能,但在震荡行情中也容易频繁改变方向。相比之下,SMA 200 的变化速度要慢得多。它不适合捕捉每一次短期波动,但有助于判断更大的市场环境。
这也是 SMA 与 EMA 在实际应用中的主要区别。EMA 会给予近期价格更高权重,因此反应更快;而 SMA 对周期内所有价格赋予相同权重,因此走势更平滑,更适合作为大趋势参考线。两者都属于移动平均线,但当交易者希望获得更清晰、更稳定的趋势参考时,通常更偏向使用 SMA。
SMA 10:短期基准线
SMA 10 是一种短周期移动平均线,能够紧密跟踪近期价格变化。它常被活跃交易者用来判断市场当前的即时方向。
当价格持续运行在 SMA 10 上方时,通常意味着短期走势较强;当价格跌破 SMA 10 时,则可能说明短期动能减弱。不过,由于加密市场波动剧烈,SMA 10 也容易产生较多噪音信号。
这一周期特别适合观察低时间周期图表中的快速行情。例如,在 15 分钟图或 1 小时图上,交易者可以利用 SMA 10 判断买方是否仍掌控短期走势;在日线图上,它则可在快速上涨或回调期间作为短期趋势参考。
不过,SMA 10 不应被视为完整交易系统,更适合作为帮助交易者判断价格是否顺应短期动能的参考基准。
SMA 20:布林带中轨
SMA 20 是最常见的短中期 SMA 周期之一,也是布林带(Bollinger Bands)中的标准中轨。因此,即使交易者没有单独使用 SMA 20,也通常会通过布林带关注这一均线。
在加密交易中,SMA 20 经常用于判断短期趋势节奏。在强势上涨行情中,价格可能多次回踩 SMA 20 后继续上升;而在下跌趋势中,价格则可能在接近 SMA 20 时受阻继续下跌。
相比 SMA 10,SMA 20 更平滑,但仍能较快反映近期价格变化,因此适合希望在“反应速度”和“稳定性”之间取得平衡的交易者。
此外,它还可用于判断市场是否过度延伸。如果价格远高于 SMA 20,交易者可能会警惕动能降温;如果价格长期位于其下方,则可能意味着市场持续疲弱。
SMA 30:稳定的中期参考线
SMA 30 虽然不像 SMA 20 或 SMA 50 那样常见,但它可以作为稳定的中期趋势参考线。它位于短期分析与中期分析之间,适合希望获得更平滑走势、又不想等待 SMA 50 的交易者。
在波动较大的加密市场中,SMA 30 能减少短周期均线带来的噪音。它不像 SMA 10 或 SMA 20 那样敏感,但能更清晰地反映市场是否仍在维持原有方向。
对于波段交易者而言,SMA 30 可以帮助判断回调是否仍属于原趋势的一部分,还是趋势结构开始减弱。如果价格在回落后多次重新站上 SMA 30,说明市场仍具备潜在强势;若价格反复在 SMA 30 附近受阻,则可能意味着卖方力量增强。
SMA 30 不是行业标准,但对于觉得 SMA 20 太快、SMA 50 太慢的交易者来说,是一个实用的折中选择。
SMA 50:中期趋势判断线
SMA 50 是最受关注的中期移动平均线之一,交易者常用它来判断资产趋势是否健康,或是否开始走弱。
在加密市场中,SMA 50 可作为趋势过滤器使用。如果价格位于 SMA 50 上方且均线向上,通常表示中期趋势较强;如果价格跌至 SMA 50 下方且均线向下,则可能意味着市场进入较弱阶段。
SMA 50 还可以作为动态支撑或阻力位。在上涨趋势中,价格可能回踩 SMA 50 后反弹;在下跌趋势中,价格反弹至 SMA 50 附近则可能遇到卖压。
这一周期在日线图中特别实用。许多交易者用它来区分正常回调与趋势破坏。短暂跌破 SMA 50 不一定代表趋势改变,但若连续多次收盘于其下方,则可能意味着市场结构正在转弱。
SMA 100:中长期趋势参考线
SMA 100 比 SMA 50 提供更广阔的趋势视角,同时又比 SMA 200 更灵敏。它常用于帮助交易者判断市场中长期趋势,而不必只依赖最慢的长期均线。
在加密交易中,如果价格保持在 SMA 100 上方,通常说明整体趋势仍然较强;如果价格跌破 SMA 100 且无法重新站上,交易者往往会变得更加谨慎。
SMA 100 在趋势过渡阶段尤其有用。有时价格跌破 SMA 50,但仍保持在 SMA 100 上方,这可能表示短期走弱,但大趋势尚未完全破坏。如果 SMA 50 和 SMA 100 同时开始向下,则空头趋势可能进一步加强。
因此,SMA 100 是连接中期趋势跟踪与长期市场判断的重要参考层。
SMA 200:最受关注的长期趋势线
SMA 200 是技术分析中最重要的长期趋势线之一。在加密市场中,交易者通常将其视为牛市和熊市的重要分界参考。
当价格运行在 SMA 200 上方时,市场通常被视为结构较强;当价格跌至 SMA 200 下方时,市场环境则可能偏向谨慎或防御。这并不意味着价格一定会上涨或下跌,但它为交易者提供了长期趋势背景。
由于纳入了大量历史价格数据,SMA 200 变化缓慢。虽然这会降低其短线入场价值,但也正因如此,它能够有效过滤市场噪音,不会因为一次快速拉升或急跌而大幅改变方向。
许多交易者还会关注价格在 SMA 200 附近的表现。强势突破并重新站上 SMA 200 往往会引发市场关注,而持续受阻于 SMA 200 下方则可能意味着买方难以重新掌控趋势。
由于大量交易者、机构和分析师都关注 SMA 200,它也具备重要的心理意义。它的重要性不在于“精准预测未来”,而在于它是市场广泛认可的长期趋势参考。
不同 SMA 周期差异对比表
| SMA 周期 | 核心角色 | 在加密交易中的典型用途 | 信号风格 |
|---|---|---|---|
| SMA 10 | 短线基准线 | 追踪即时价格方向和快速动量 | 反应快但噪音多 |
| SMA 20 | 短至中期参考 | 常作为布林带中轨及回撤指引 | 兼具响应性与平滑度 |
| SMA 30 | 稳定的中期参考 | 在保持响应性的同时减少短线噪音 | 平衡 |
| SMA 50 | 中期趋势线 | 用于趋势判定、回撤及动态支撑/阻力 | 温和 |
| SMA 100 | 中长期参考 | 辅助确认更广泛的趋势结构 | 较慢且更稳健 |
| SMA 200 | 长期市场结构 | 作为主要的牛熊趋势过滤器 | 缓慢但受到广泛关注 |
总结
不同的 SMA 周期帮助交易者从不同角度理解加密市场。SMA 10 和 SMA 20 更关注短期波动;SMA 30 和 SMA 50 提供更稳定的趋势判断;SMA 100 和 SMA 200 虽然反应较慢,但有助于识别更大的市场结构和长期趋势环境。
没有哪一个 SMA 周期适合所有交易场景。短线交易者可能更关注 SMA 10 或 SMA 20,波段交易者可能更依赖 SMA 50 或 SMA 100,而长期分析者通常重点观察 SMA 200,以判断市场是否运行在长期趋势线上方。
SMA 周期最大的价值不在于预测每一次价格波动,而在于建立市场背景。当 SMA 与价格结构、成交量、EMA、支撑阻力及其他技术指标结合使用时,能帮助交易者在波动剧烈的加密市场中做出更有纪律性的决策。
FAQs
什么是最适合加密交易的 SMA 周期?
没有适用于所有交易者的最佳 SMA 周期。SMA 10 和 SMA 20 更适合观察短期走势,而 SMA 100 和 SMA 200 更适合分析整体趋势。
为什么交易者会使用 SMA 200?
因为 SMA 200 是最受关注的长期移动平均线之一,可帮助判断价格处于长期趋势参考线的上方还是下方。
SMA 比 EMA 更好吗?
不一定。SMA 更平滑,对所有价格赋予相同权重;EMA 对近期价格赋予更高权重,因此反应更快。交易者通常根据策略需求选择使用哪一种。
SMA 可以作为支撑或阻力吗?
可以。在趋势行情中,SMA 常作为动态支撑或阻力。上涨趋势中价格可能在 SMA 附近反弹,下跌趋势中价格可能在 SMA 附近受阻,但这并非绝对。
交易者应该同时使用多个 SMA 周期吗?
是的。许多交易者会同时使用多个 SMA 周期来观察短期、中期和长期趋势,这比只依赖单一均线更容易识别市场结构。
分享
目录


相关文章


Gate 研究院:ORE 单日收入突破百万美元|x402 协议生态交易量暴跌 90%

什么是山寨币