For swing trading, no single indicator consistently outperforms the other. The more suitable choice depends on whether the trading strategy emphasizes broader trend confirmation through multiple moving averages or faster entry signals from a single, responsive EMA.
TL;DR
-
Moving Average Ribbon shows whether several moving averages are aligned, expanding, compressing, or crossing.
-
EMA provides a clearer and faster reference for trend direction, pullbacks, and price position.
-
The ribbon is generally better for trend-strength confirmation, while EMA is more practical for timing entries.
-
EMA can detect market changes earlier but may create more false signals during consolidation.
-
Neither indicator should be used without price structure, risk management, and additional confirmation.
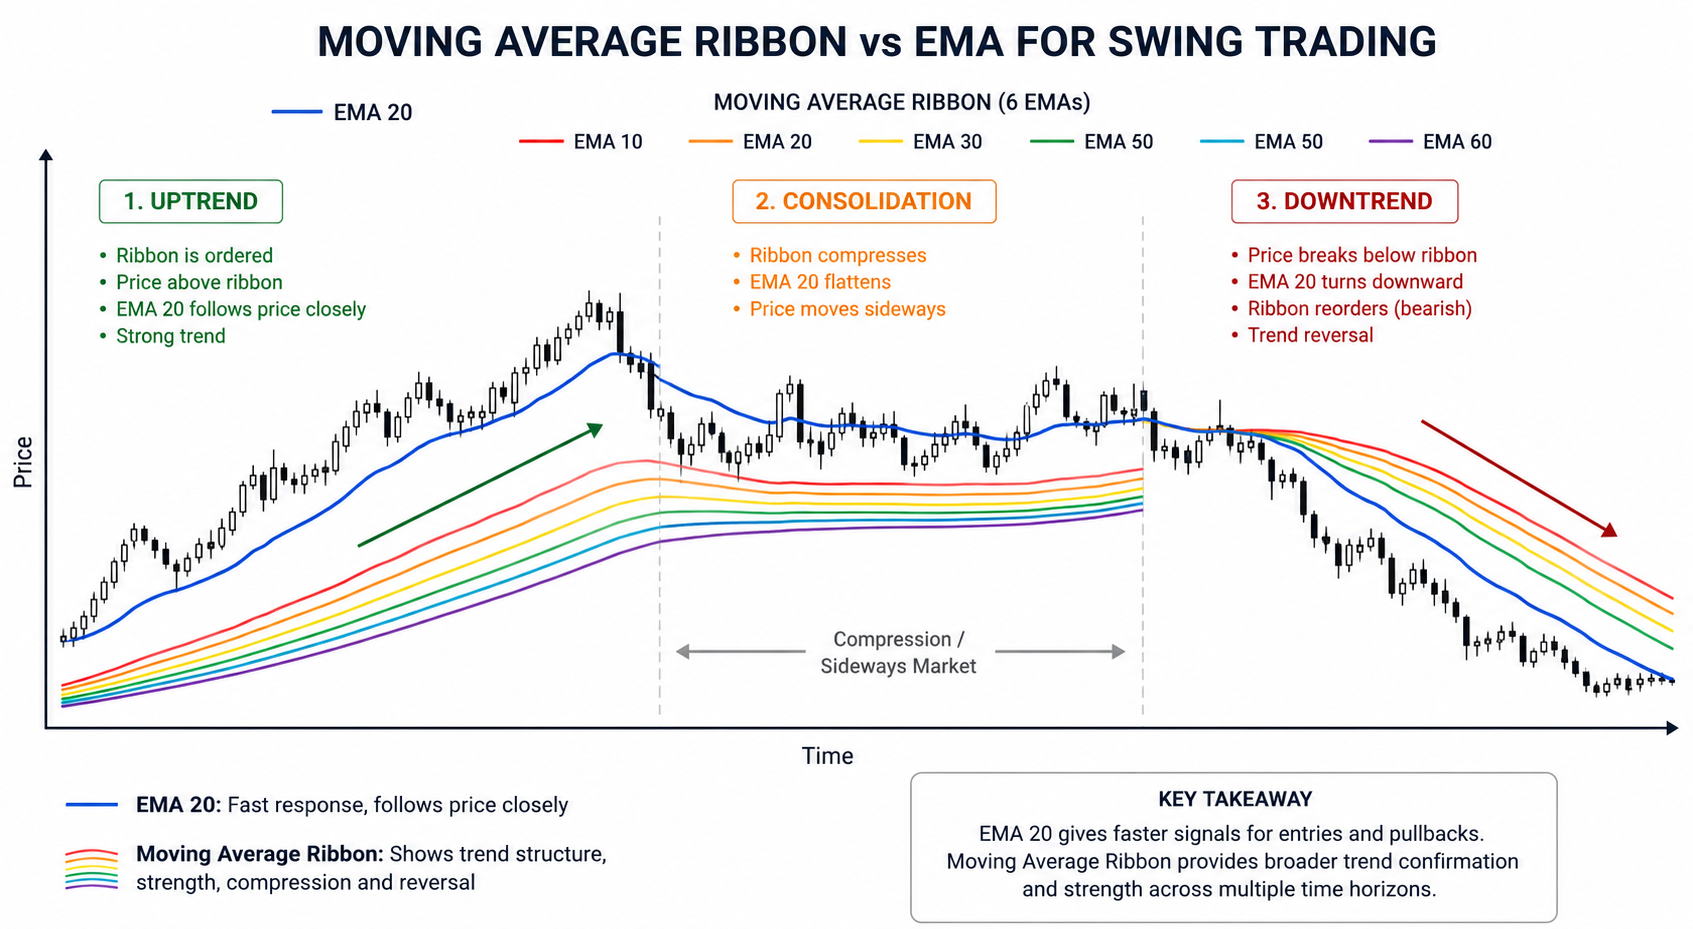
Moving Average Ribbon vs. EMA at a Glance
The central difference between Moving Average Ribbon and EMA is the amount of trend information presented. EMA condenses recent price behaviour into one responsive line, whereas a ribbon plots several moving average lines on the same chart across progressively longer lookback periods. That broader view can help show trend structure, but a single EMA is usually simpler to interpret because a ribbon can become cluttered with multiple lines.
| Comparison factor |
Moving Average Ribbon |
EMA |
| Chart structure |
Several moving averages |
One exponential moving average |
| Main purpose |
Trend alignment and strength |
Trend direction and pullbacks |
| Signal speed |
Moderate to slow |
Faster |
| Visual complexity |
Higher |
Lower |
| Trend-strength detail |
Strong |
Limited to slope and price distance |
| Sideways behaviour |
Lines compress and overlap |
Line flattens as price crosses repeatedly |
| Best swing-trading role |
Trend filter and confirmation |
Entry reference and active trend tracking |
A ribbon provides more structural information, but that does not make it universally superior. EMA may produce clearer decisions when price action, volume, or another indicator already confirms the wider trend. Traders often combine the EMA with other indicators when they want clearer signals without giving up broader context.
What Is a Moving Average Ribbon?
A Moving Average Ribbon is a multiple moving average tool built from moving averages of different periods or different lengths, plotted on the same chart. A common setup might contain six exponential moving averages emas set to 10, 20, 30, 40, 50, and 60 periods, using varying lengths across several time periods, although the selection can vary depending on the trader’s method; commonly used moving averages include SMA, EMA, and WMA.
The overall pattern matters more than any individual line. Short term moving averages are usually plotted closer to price, while longer term moving averages sit farther away and help frame the current trend. During a sustained bullish phase, shorter EMAs crossing above longer EMAs indicate an uptrend, helping traders identify trends; in bearish conditions, faster averages move below slower averages as the group slopes downward.
The Moving Average Ribbon indicator can be interpreted through four characteristics:
-
Direction: Whether most averages slope upward, downward, or sideways across broader market trends.
-
Ordering: Whether faster averages remain consistently above or below slower averages, as with simple moving averages or EMAs.
-
Expansion: Whether the distance between the lines is increasing.
-
Compression: Whether the averages are converging and beginning to overlap.
An orderly, evenly spaced and expanding ribbon generally reflects a strong trend. A compressed or tangled ribbon suggests weaker momentum, consolidation, or a possible transition between market conditions.
What Is an EMA?
An Exponential Moving Average is a technical analysis average that gives more weight to recent closing prices, helping traders analyze trends with faster reactions to current market movement than an equally sized Simple Moving Average. A 20-period EMA reflects recent price movement more strongly than older observations within the calculation.
A short term MA reacts faster to price changes, while a long term MA smooths noise and helps track long term trends.
Swing traders usually assess an EMA through four questions:
-
Is price above or below the EMA?
-
Is the EMA rising, falling, or flattening?
-
Are pullbacks holding near the line?
-
Is price crossing the EMA repeatedly?
The EMA 20 indicator is frequently used as a short-term trend and pullback reference. Comparing EMA 20 vs. EMA 50 also shows how shorter periods react faster while longer periods provide smoother trend confirmation.
EMA is more responsive than SMA because recent prices receive greater weight. The broader SMA vs. EMA comparison demonstrates that greater responsiveness can improve signal speed but may also increase sensitivity to short-term volatility. For that reason, EMA remains a common choice for short term traders who want faster responses than simple moving averages.
Moving Average Ribbon vs. EMA: Which Indicator Shows Trend Direction More Clearly?
EMA shows immediate trend direction more clearly, while Moving Average Ribbon offers a broader assessment across multiple time horizons.
A rising EMA beneath price creates a straightforward bullish reading. A falling EMA above price supports a bearish interpretation. This simplicity makes it easier to determine whether the market remains on the preferred side of the average.
A bullish ribbon requires more complete alignment. In an ema ribbon, multiple moving average lines help identify the current trend by showing whether short-term and longer-term averages stay aligned. Faster averages should remain above slower averages, most lines should slope upward, and price should generally trade above the group. When only the shortest averages turn downward while longer averages continue rising, the movement may represent a temporary pullback rather than a complete reversal, especially if price is moving sideways with no clear direction.
EMA is therefore easier to interpret at a glance. Moving Average Ribbon provides more context about whether short-, medium-, and longer-period trends agree, but a single EMA gives clearer direction at a glance.
Moving Average Ribbon vs. EMA: Which Indicator Measures Trend Strength Better?
Moving Average Ribbon measures trend strength more effectively because the ordering and separation of its lines reveal whether directional momentum extends across several periods.
An expanding bullish ribbon suggests that shorter-term averages are pulling away from slower trend measurements. Compression shows that the averages are converging, often because momentum has weakened. A strong trend is often visible when the ribbon fans out and the lines stay evenly spaced. Numerous crossovers indicate unstable control between buyers and sellers and can warn of a trend change.
A single EMA can still indicate strength through its slope, the distance between price and the line, and the consistency of pullbacks. However, one average cannot show agreement among multiple time horizons.
The ADX indicator can provide independent information about trend strength, while the MACD indicator can help evaluate whether momentum is expanding or weakening.
Ribbon expansion should not automatically be treated as an entry signal. Excessive separation sometimes develops after an extended price move, when the probability of a pullback may be increasing.
Moving Average Ribbon vs. EMA: Which Indicator Is Better for Swing-Trading Entries?
EMA is generally more practical for timing swing-trading market entries because it creates one visible reference for pullbacks and potential entry timing.
During an established uptrend, a trader may monitor a retracement toward a rising EMA and assess whether price holds above the line for entries or exit points. During a downtrend, a falling EMA can act as a reference when price rebounds before potentially continuing lower.
Moving Average Ribbon is better suited to determining whether the entry occurs within a healthy trend. A pullback touching the faster side of an ordered bullish ribbon differs from a decline that moves through a flat and compressed group of averages.
A combined process may involve:
-
Using the ribbon to identify trends and classify market trends as trending, weakening, or sideways before execution.
-
Selecting one EMA as the pullback or entry reference.
-
Confirming the setup through price structure, volume, momentum, or other factors.
-
Defining invalidation from the chart instead of assuming an average will hold.
Moving averages should be interpreted as zones rather than exact support or resistance prices. Crypto volatility can push price briefly through an EMA or several ribbon lines without producing a lasting reversal.
Moving Average Ribbon vs. EMA: Which Indicator Detects Reversals Faster?
EMA usually identifies a potential reversal earlier because a short-period EMA reacts relatively quickly to recent price changes, but exponential moving averages emas are more susceptible to false signals than ribbons when price lacks follow-through. Price may cross the EMA and change its slope before the complete ribbon develops a new order.
Faster detection also increases false-signal risk. During consolidation, price may cross an EMA repeatedly while the line alternates between shallow upward and downward slopes.
Moving Average Ribbon filters some of this noise because a broader reversal normally requires several averages to flatten, cross, and reorder. Traders often consider how many crossovers occur before treating the move as a credible reversal signal. This additional confirmation reduces sensitivity but causes the signal to arrive later.
A volatility-adjusted indicator may offer another form of confirmation. In the SuperTrend vs. EMA comparison, SuperTrend changes direction according to price and volatility, while EMA reacts directly to weighted price movement.
How Do Moving Average Ribbon and EMA Behave in Sideways Markets?
Neither Moving Average Ribbon nor EMA performs reliably as a standalone signal during sideways markets, when price has no clear direction.
EMA tends to flatten while price crosses above and below the line. These repeated crossings can resemble trend changes but frequently fail to produce sustained follow-through.
A Moving Average Ribbon compresses and becomes tangled as the averages converge around similar prices. Compressed average ribbons and tangled average lines make the market harder to read on a single chart. The ribbon has an advantage as a warning system because the loss of trend organisation becomes visually clear. However, compression does not predict the direction of the next breakout.
The Aroon indicator can provide additional context by measuring how recently price formed its highest high or lowest low within a selected period. Repeated Aroon crossings combined with a compressed ribbon may reinforce the interpretation that the market lacks a stable direction.
Moving Average Ribbon vs. EMA: Which Trading Strategy Should Swing Traders Choose?
Moving Average Ribbon suits swing traders who prioritize trend alignment, structural confirmation, and protection against short-term market noise. It can help identify short-term and long-term market trends, while EMA suits traders who prefer a cleaner chart for faster execution, quicker signals, and a direct reference for pullbacks that influence trading decisions.
| Trading need |
More suitable choice |
| Faster pullback reference |
EMA |
| Cleaner chart structure |
EMA |
| Multi-period trend alignment |
Moving Average Ribbon |
| Trend-strength confirmation |
Moving Average Ribbon |
| Earlier reversal warning |
EMA |
| Filtering short-term volatility |
Moving Average Ribbon |
| Combined trading process |
Ribbon for context, EMA for execution |
Using both indicators may create a more balanced process and support better trading decisions. The ribbon can establish whether market conditions support trend-following trades, while one selected EMA can define the area where a pullback or continuation setup becomes relevant by combining structure with faster signals.
Adding more averages does not automatically improve analysis. Each period should serve a defined purpose, and the configuration should be tested against the chosen cryptocurrency, chart timeframe, and trading method; for example, some traders validate settings on the daily chart before applying them to a faster setup.
Risks and Limitations of Moving Average Ribbon and EMA in Technical Analysis
Moving Average Ribbon and EMA are lagging indicators calculated from historical prices. Neither tool can predict breakouts, eliminate false signals, or account for unexpected news, liquidity shocks, or abrupt volatility.
The main limitations include:
-
Parameter sensitivity: Short periods increase responsiveness and noise, while long periods improve smoothing but delay signals.
-
Whipsaw risk: Repeated crosses can generate misleading signals in range-bound markets.
-
Confirmation delay: Waiting for full ribbon realignment may result in late entries or exits, and after an extended move that can reduce potential profits.
-
Chart clutter: Too many averages can obscure price action and may be harder to interpret than one EMA.
-
Correlated evidence: Every ribbon line is derived from the same price data, so multiple averages do not provide fully independent confirmation.
Swing traders should combine moving averages with price structure, position sizing, stop-loss planning, and predetermined risk controls. Technical indicators provide analytical context rather than guaranteed trading outcomes.
Conclusion
Moving Average Ribbon provides the stronger framework for evaluating trend alignment, strength, compression, and broader market structure. EMA provides the more responsive and practical reference for pullbacks, entries, and early momentum changes.
The most suitable choice depends on the trader’s process rather than the number of lines on the chart. A ribbon works well as a trend filter, while EMA supports faster execution. Using the ribbon for context and one EMA for timing can combine structural confirmation with clearer entry decisions, provided both signals are supported by price action and disciplined risk management.
Technical indicators do not guarantee profitable trades or accurately predict every reversal. Cryptocurrency and financial markets can be highly volatile, and this material is provided for educational purposes rather than financial advice.
FAQ
Is Moving Average Ribbon better than EMA for swing trading?
Moving Average Ribbon is generally better for assessing broad trend structure and strength, while EMA is more effective for responsive entry and pullback signals. The better indicator depends on whether the strategy prioritizes confirmation or speed.
Can a Moving Average Ribbon use EMAs?
Yes. A Moving Average Ribbon can be built with several EMAs, SMAs, or another consistent moving-average type, and ribbon-style setups also include the guppy multiple moving average, often called the guppy multiple, which layers several EMAs into one visual tool. In GMMA, the long term EMAs reflect investor sentiment, while the shorter EMAs track short term traders. EMA-based ribbons respond more quickly to recent price movement, while SMA-based ribbons usually appear smoother.
How many moving averages should a ribbon contain?
A ribbon commonly contains between six and twelve moving averages, but no fixed number works for every market. These lines usually use multiple moving averages of different lengths, and the exact count can vary depending on the strategy. Traders also watch whether the lines stay evenly spaced or begin showing numerous crossovers as the ribbon becomes more complex. Too few averages may provide limited structural information, while too many can create unnecessary chart clutter.
Which EMA is best for swing trading?
EMA 20 and EMA 50 are commonly used for swing trading because they represent different trend horizons. EMA 20 reacts faster to short-term price movement, while EMA 50 provides a smoother view of the broader trend. The appropriate period depends on the asset, timeframe, and trading strategy.
Can Moving Average Ribbon and EMA be used together?
Yes. A Moving Average Ribbon can identify trend alignment and strength, while one selected EMA can act as a pullback or execution reference. The signals should still be confirmed with price structure, volume, momentum, and risk controls. Traders may also combine the ribbon and EMA with other indicators to confirm a trend change before acting.
Are Moving Average Ribbon and EMA reliable in sideways markets?
Neither indicator is consistently reliable during sideways conditions. EMA may generate repeated price crossings, while a ribbon can become compressed and tangled, and numerous crossovers can create a bearish signal or bullish signal that quickly fails. These behaviours are better interpreted as warnings that trend-following setups may have lower reliability, which is why multiple moving signals work best when the market shows clearer trend structure.







