Panorama des insights on-chain
Panorama de l’activité on-chain et des flux de capitaux
Pour évaluer avec précision le niveau d’usage réel des écosystèmes blockchain, cette section analyse plusieurs indicateurs clés d’activité on-chain : volume quotidien de transactions, frais de gas, adresses actives et flux nets sur les bridges inter-chaînes. Ces métriques permettent de saisir le comportement utilisateur, l’intensité d’utilisation du réseau et la mobilité des actifs entre écosystèmes. Contrairement au simple suivi des flux de capitaux, les données natives on-chain offrent une vision complète des fondamentaux sous-jacents, facilitant l’évaluation de la pertinence des mouvements de capitaux au regard de la demande réelle et de la croissance des utilisateurs. Cela permet d’identifier les réseaux à potentiel de développement durable.
Analyse du nombre de transactions : Solana en consolidation haut de gamme, Base et les principales L2 affichent des structures stables
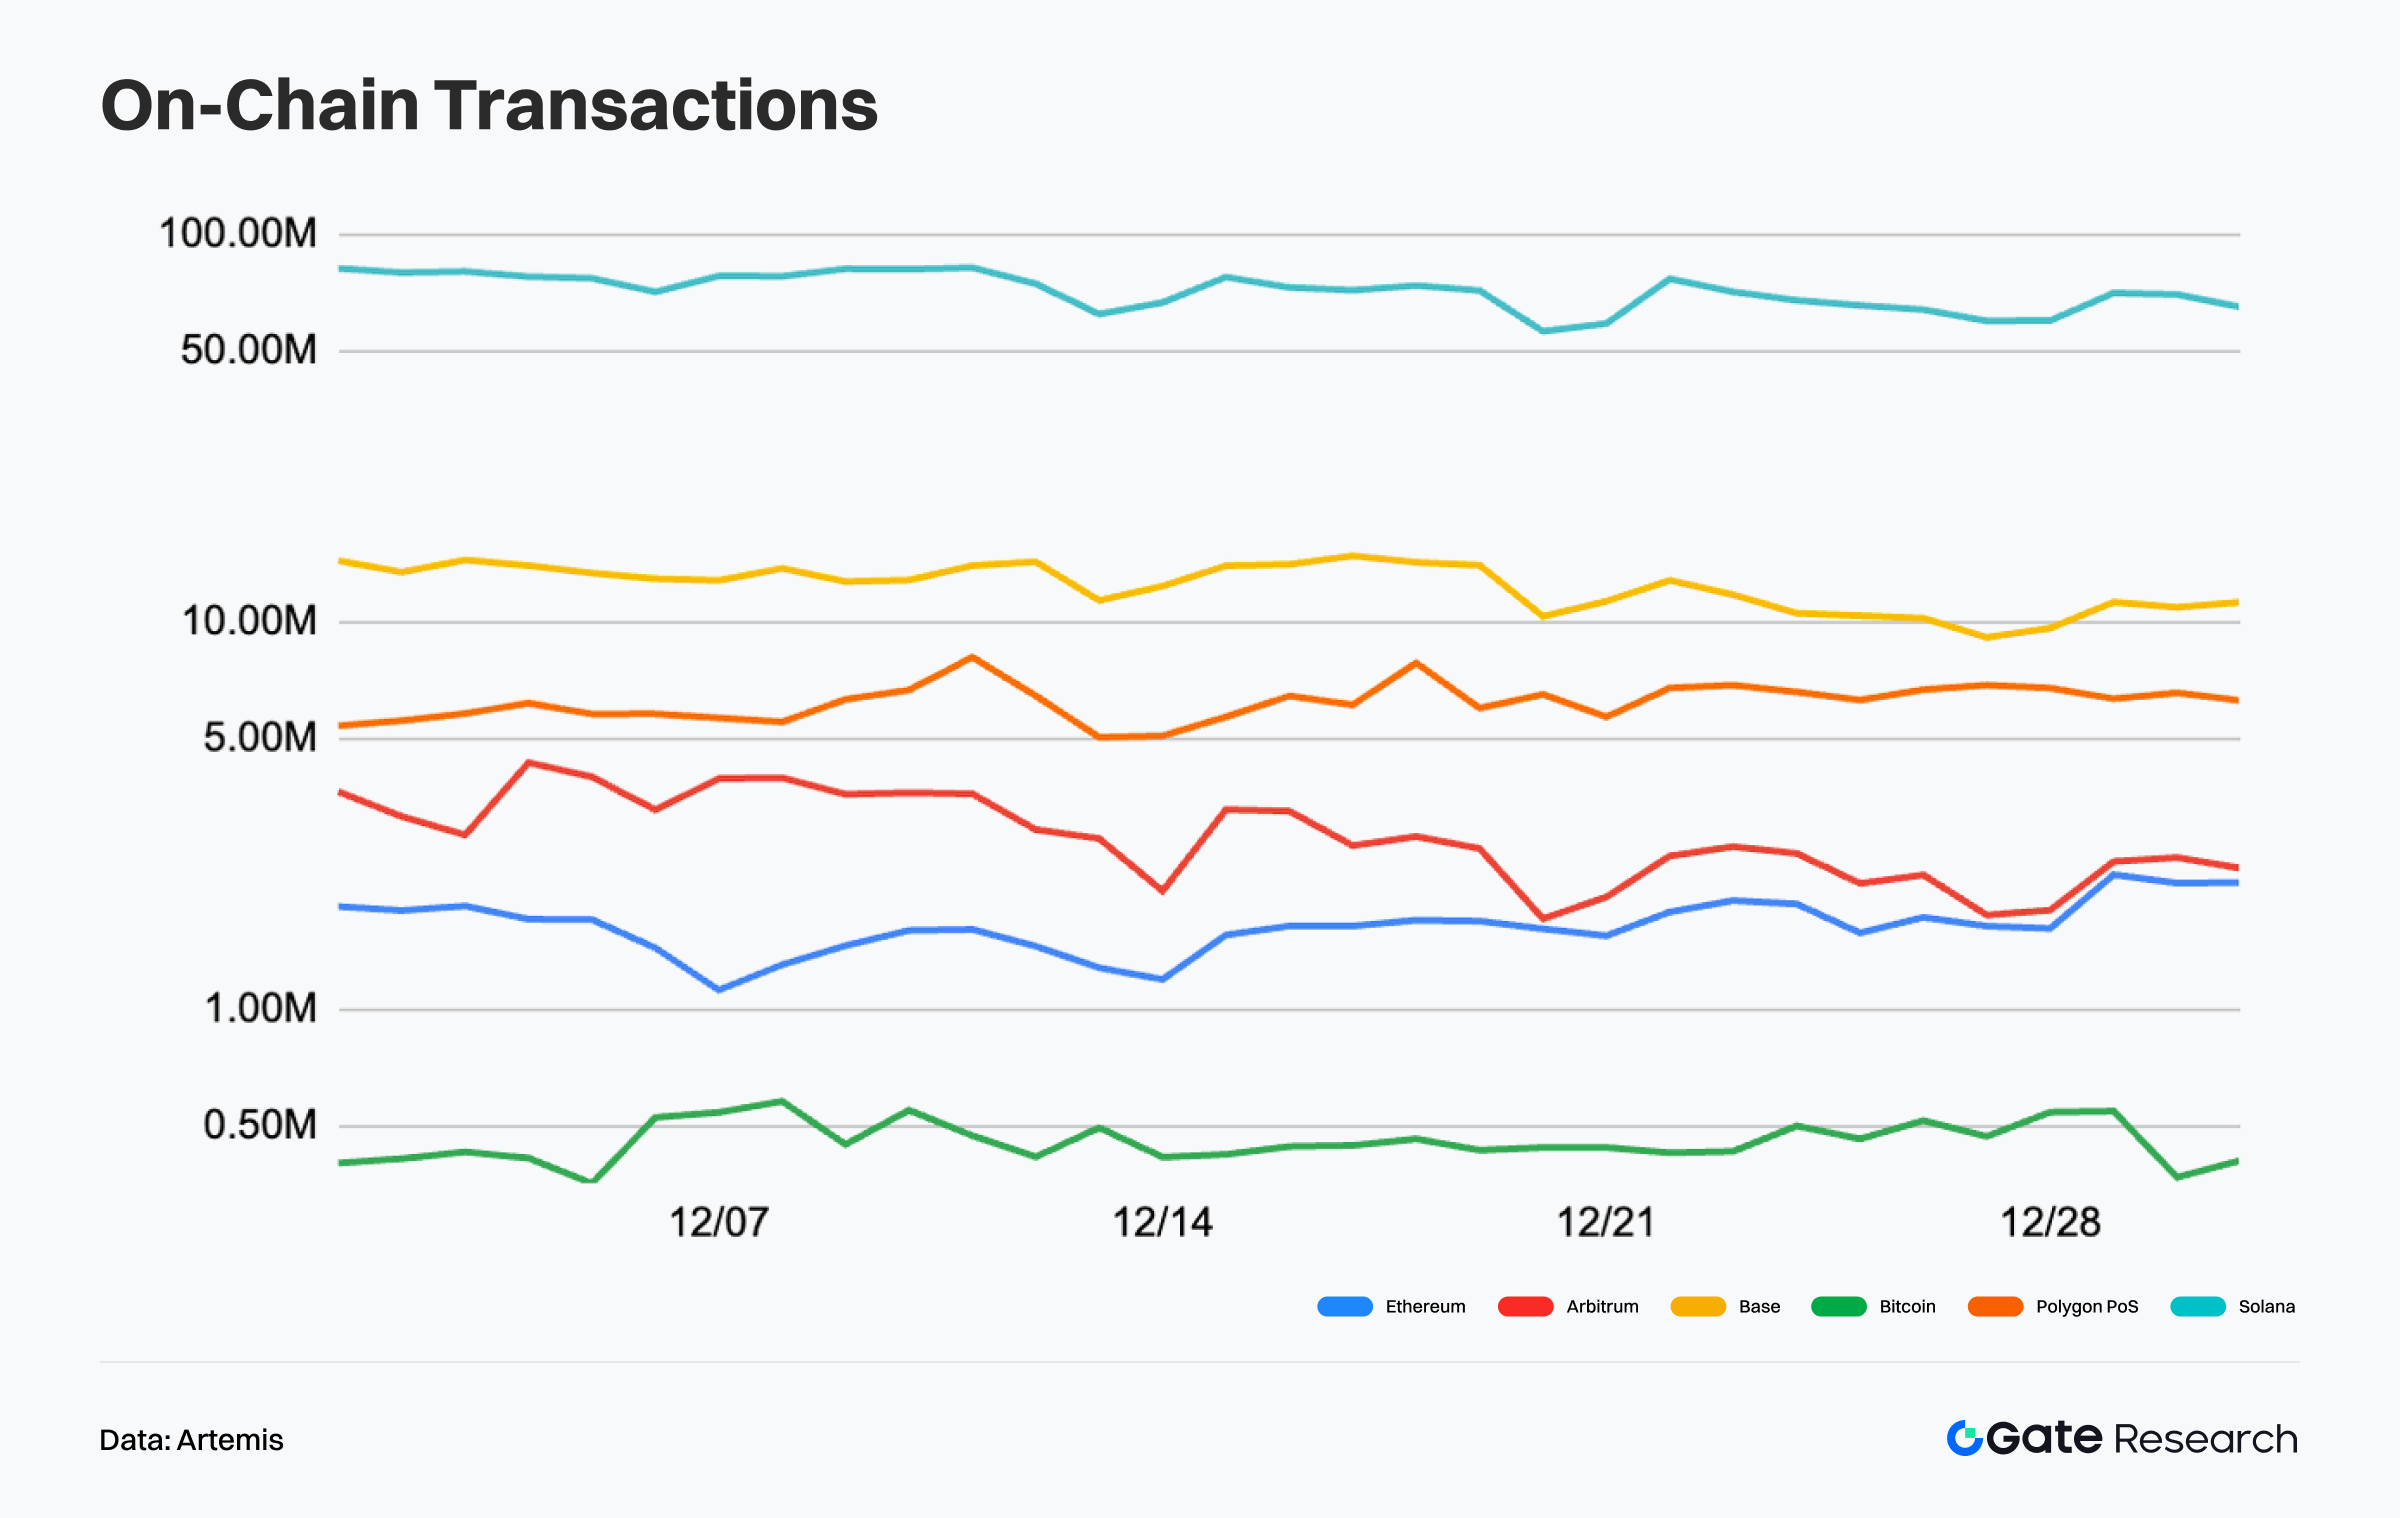
D’après Artemis, l’activité transactionnelle on-chain des principales blockchains publiques en décembre a présenté une consolidation à haut niveau. Même en phase de consolidation de fin d’année, l’intensité d’usage sur les chaînes majeures n’a pas faibli, ce qui traduit un socle d’interaction solide. Solana s’est maintenue à un sommet absolu sur la période, avec un volume quotidien de 60 à 80 millions de transactions. Malgré des replis ponctuels à la mi-décembre et en fin de mois, la volatilité globale est restée modérée. Cela illustre le rôle stabilisateur des applications à haute fréquence et d’une base utilisateur active sur les volumes, et démontre la résilience de l’usage on-chain malgré le refroidissement du sentiment de marché.【1】
Sur Base, le volume quotidien de transactions en décembre a fluctué entre 10 et 13 millions. La tendance mensuelle est restée latérale, sans expansion marquée, mais la structure globale demeure stable. Cela montre que l’écosystème social et applicatif continue de générer une demande régulière d’interaction. À titre de comparaison, Arbitrum a connu une activité transactionnelle en range, la plupart du temps entre 2 et 3,5 millions de transactions par jour. Après un creux mi-décembre, l’activité a rebondi sans persistance, ce qui indique que l’écosystème reste actif sans entrer dans une dynamique d’expansion claire.
En résumé, la structure des transactions on-chain en décembre confirme le schéma « chaînes à haute performance en tête, divergence entre Layer 2 ». Solana concentre le trafic, Base maintient un niveau intermédiaire stable, et Arbitrum reste stable sans expansion. Dans un contexte de ralentissement de fin d’année, la stratification de l’activité on-chain demeure manifeste, et les variations à court terme n’ont pas modifié les positions d’usage ou la concurrence entre ces blockchains.
Analyse des adresses actives : Solana conserve la tête, Arbitrum reste en consolidation basse
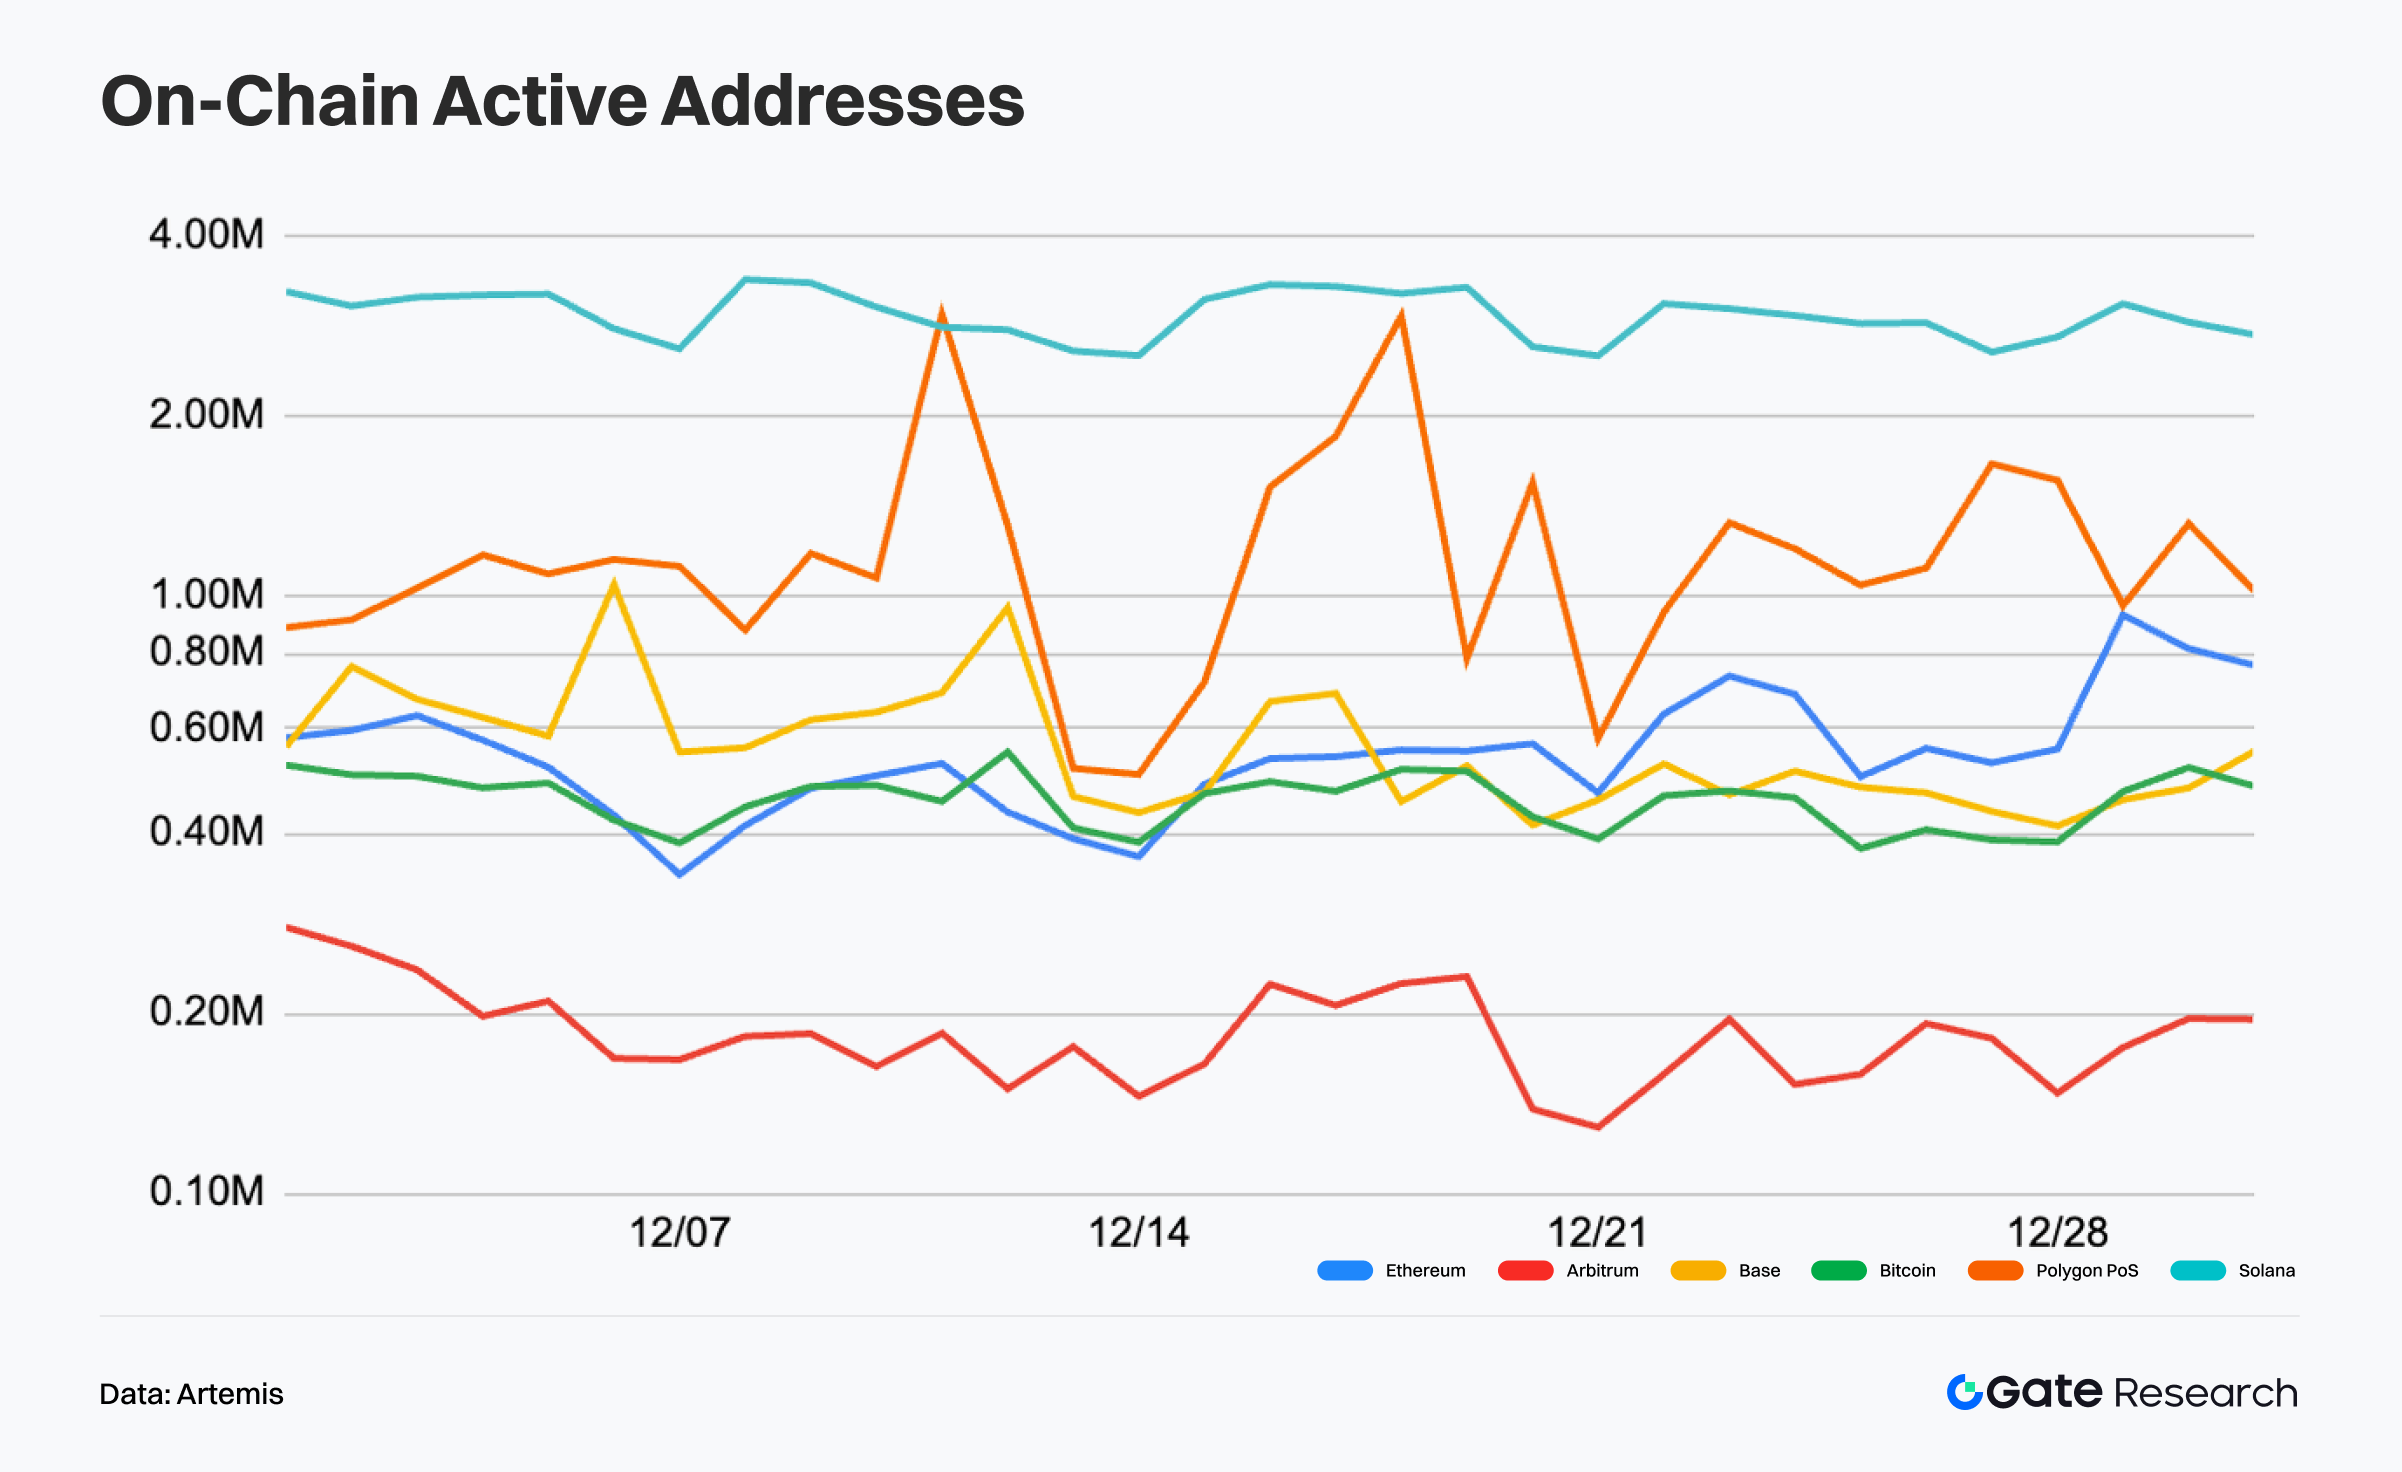
D’après Artemis, la dynamique des adresses actives sur les principales blockchains publiques en décembre a montré une divergence nette. L’activité utilisateur globale n’a pas reculé de façon systémique, mais la prudence de fin d’année a limité l’expansion. Les chaînes à haute performance et certains réseaux applicatifs sont restés résilients, tandis que plusieurs Layer 2 ont consolidé à bas niveau.【2】
Solana conserve une avance nette en volume d’adresses actives, stable entre 2,5 et 3,5 millions par jour, avec une volatilité limitée. Les applications à haute fréquence et le trading continuent de soutenir la participation. Polygon PoS a fluctué de 800 000 à 1,5 million d’adresses actives, avec quelques pics, mais une dynamique globalement stable. Arbitrum est resté dans une zone basse prolongée, autour de 120 000 à 200 000 adresses, sans reprise marquée. Ethereum et Bitcoin sont restés stables, confirmant leur rôle de couches de règlement et de porteurs de valeur.
La stratification des adresses actives en décembre est donc claire : Solana domine les interactions à haute fréquence, Polygon PoS et Base maintiennent un niveau intermédiaire, Arbitrum reste en consolidation basse. La divergence au sein de l’écosystème Layer 2 s’est accentuée en fin d’année.
Analyse des revenus de frais on-chain : Ethereum et Solana restent en tête, volatilité accrue pour Base et Arbitrum
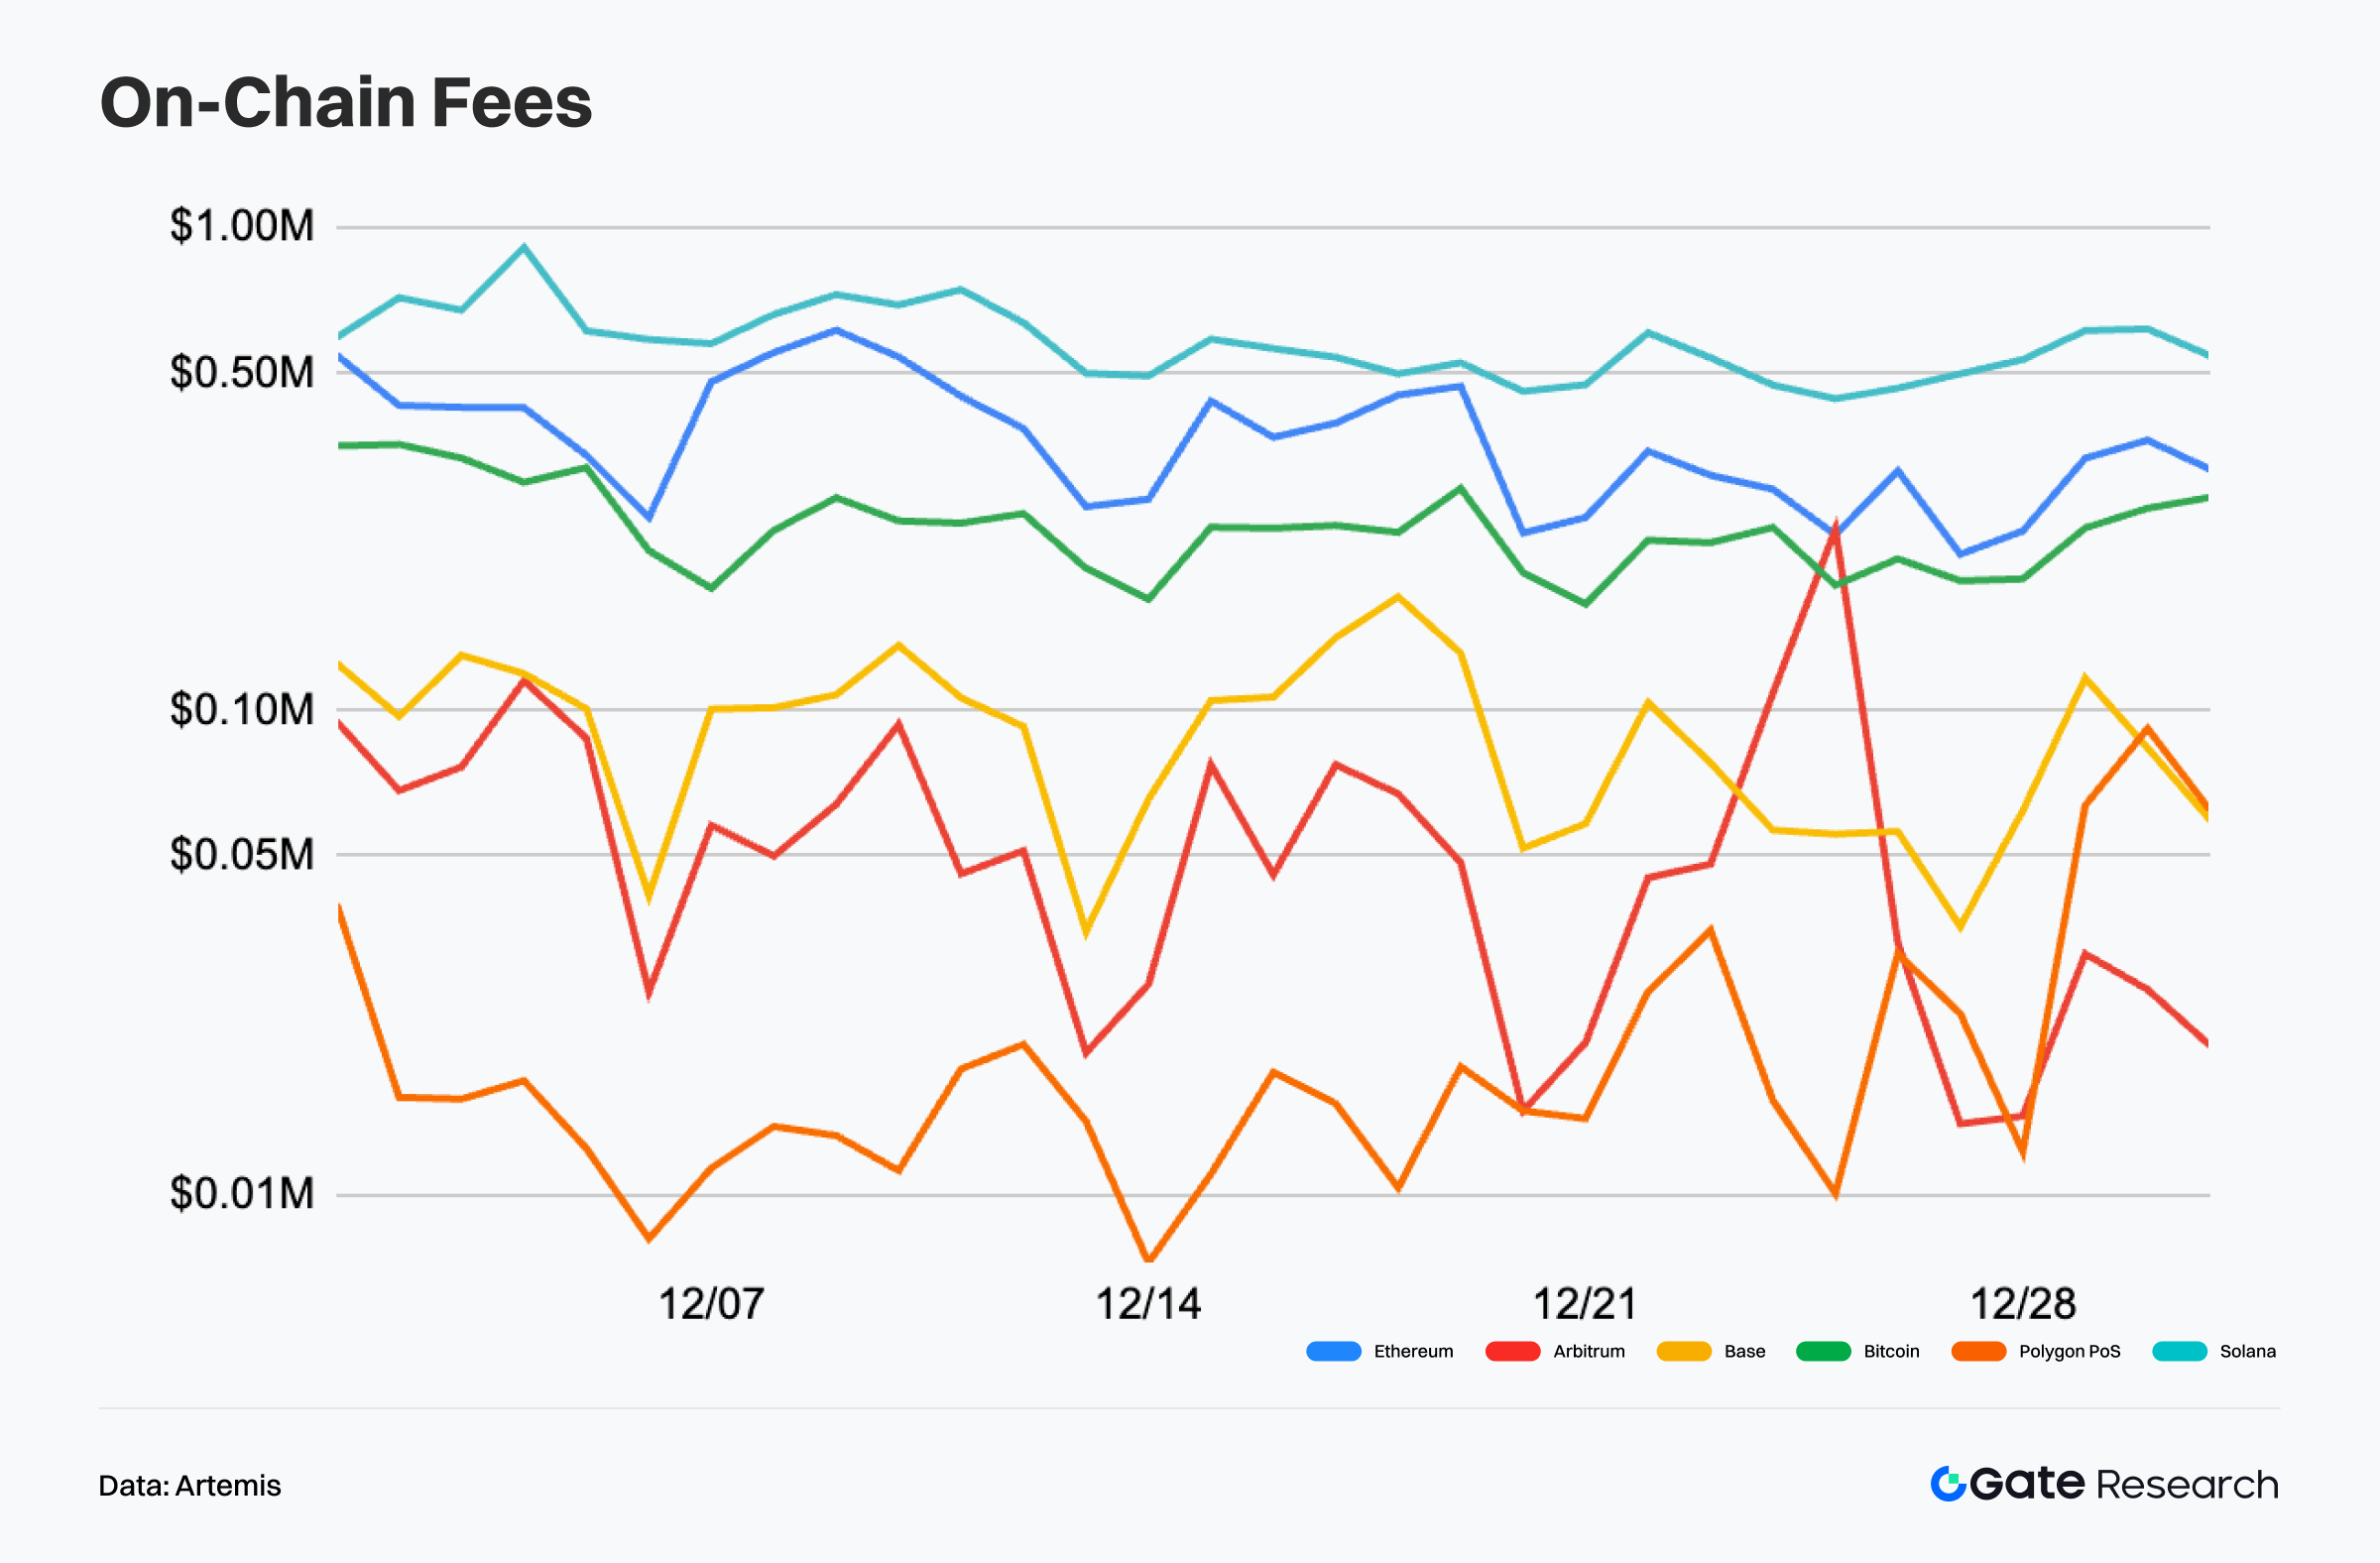
Selon Artemis, les revenus de frais on-chain sur les principales blockchains publiques en décembre ont été globalement volatils. Les réseaux de base à forte valeur sont restés stables, alors que les chaînes intermédiaires et inférieures ont connu des fluctuations prononcées. Dans un contexte de ralentissement des échanges de fin d’année, les revenus de frais n’ont pas suivi de tendance haussière, étant surtout liés à des événements ponctuels. 【3】
Ethereum et Solana sont restées en tête en matière de frais. Ethereum a généré entre 300 000 et 700 000 dollars de frais quotidiens, oscillant avec l’activité DeFi et les interactions smart contracts à forte valeur, et demeure l’indicateur central de l’activité économique on-chain. Solana est restée stable, avec 500 000 à 800 000 dollars de frais par jour, soutenue par le trading à haute fréquence et l’usage applicatif continu.
À l’inverse, Base et Arbitrum ont connu plus de volatilité. Base a fluctué entre 50 000 et 150 000 dollars, avec des pics brefs et peu persistants. Arbitrum est resté à un niveau bas, avec des rebonds courts vite effacés. En décembre, la structure des frais est donc clairement stratifiée, la captation de valeur se concentrant sur Ethereum et Solana, les autres chaînes n’ayant pas encore enclenché de croissance stable.
Divergence des flux de capitaux sur les chaînes publiques : retour vers les couches de règlement, absorption du risque par les réseaux trading
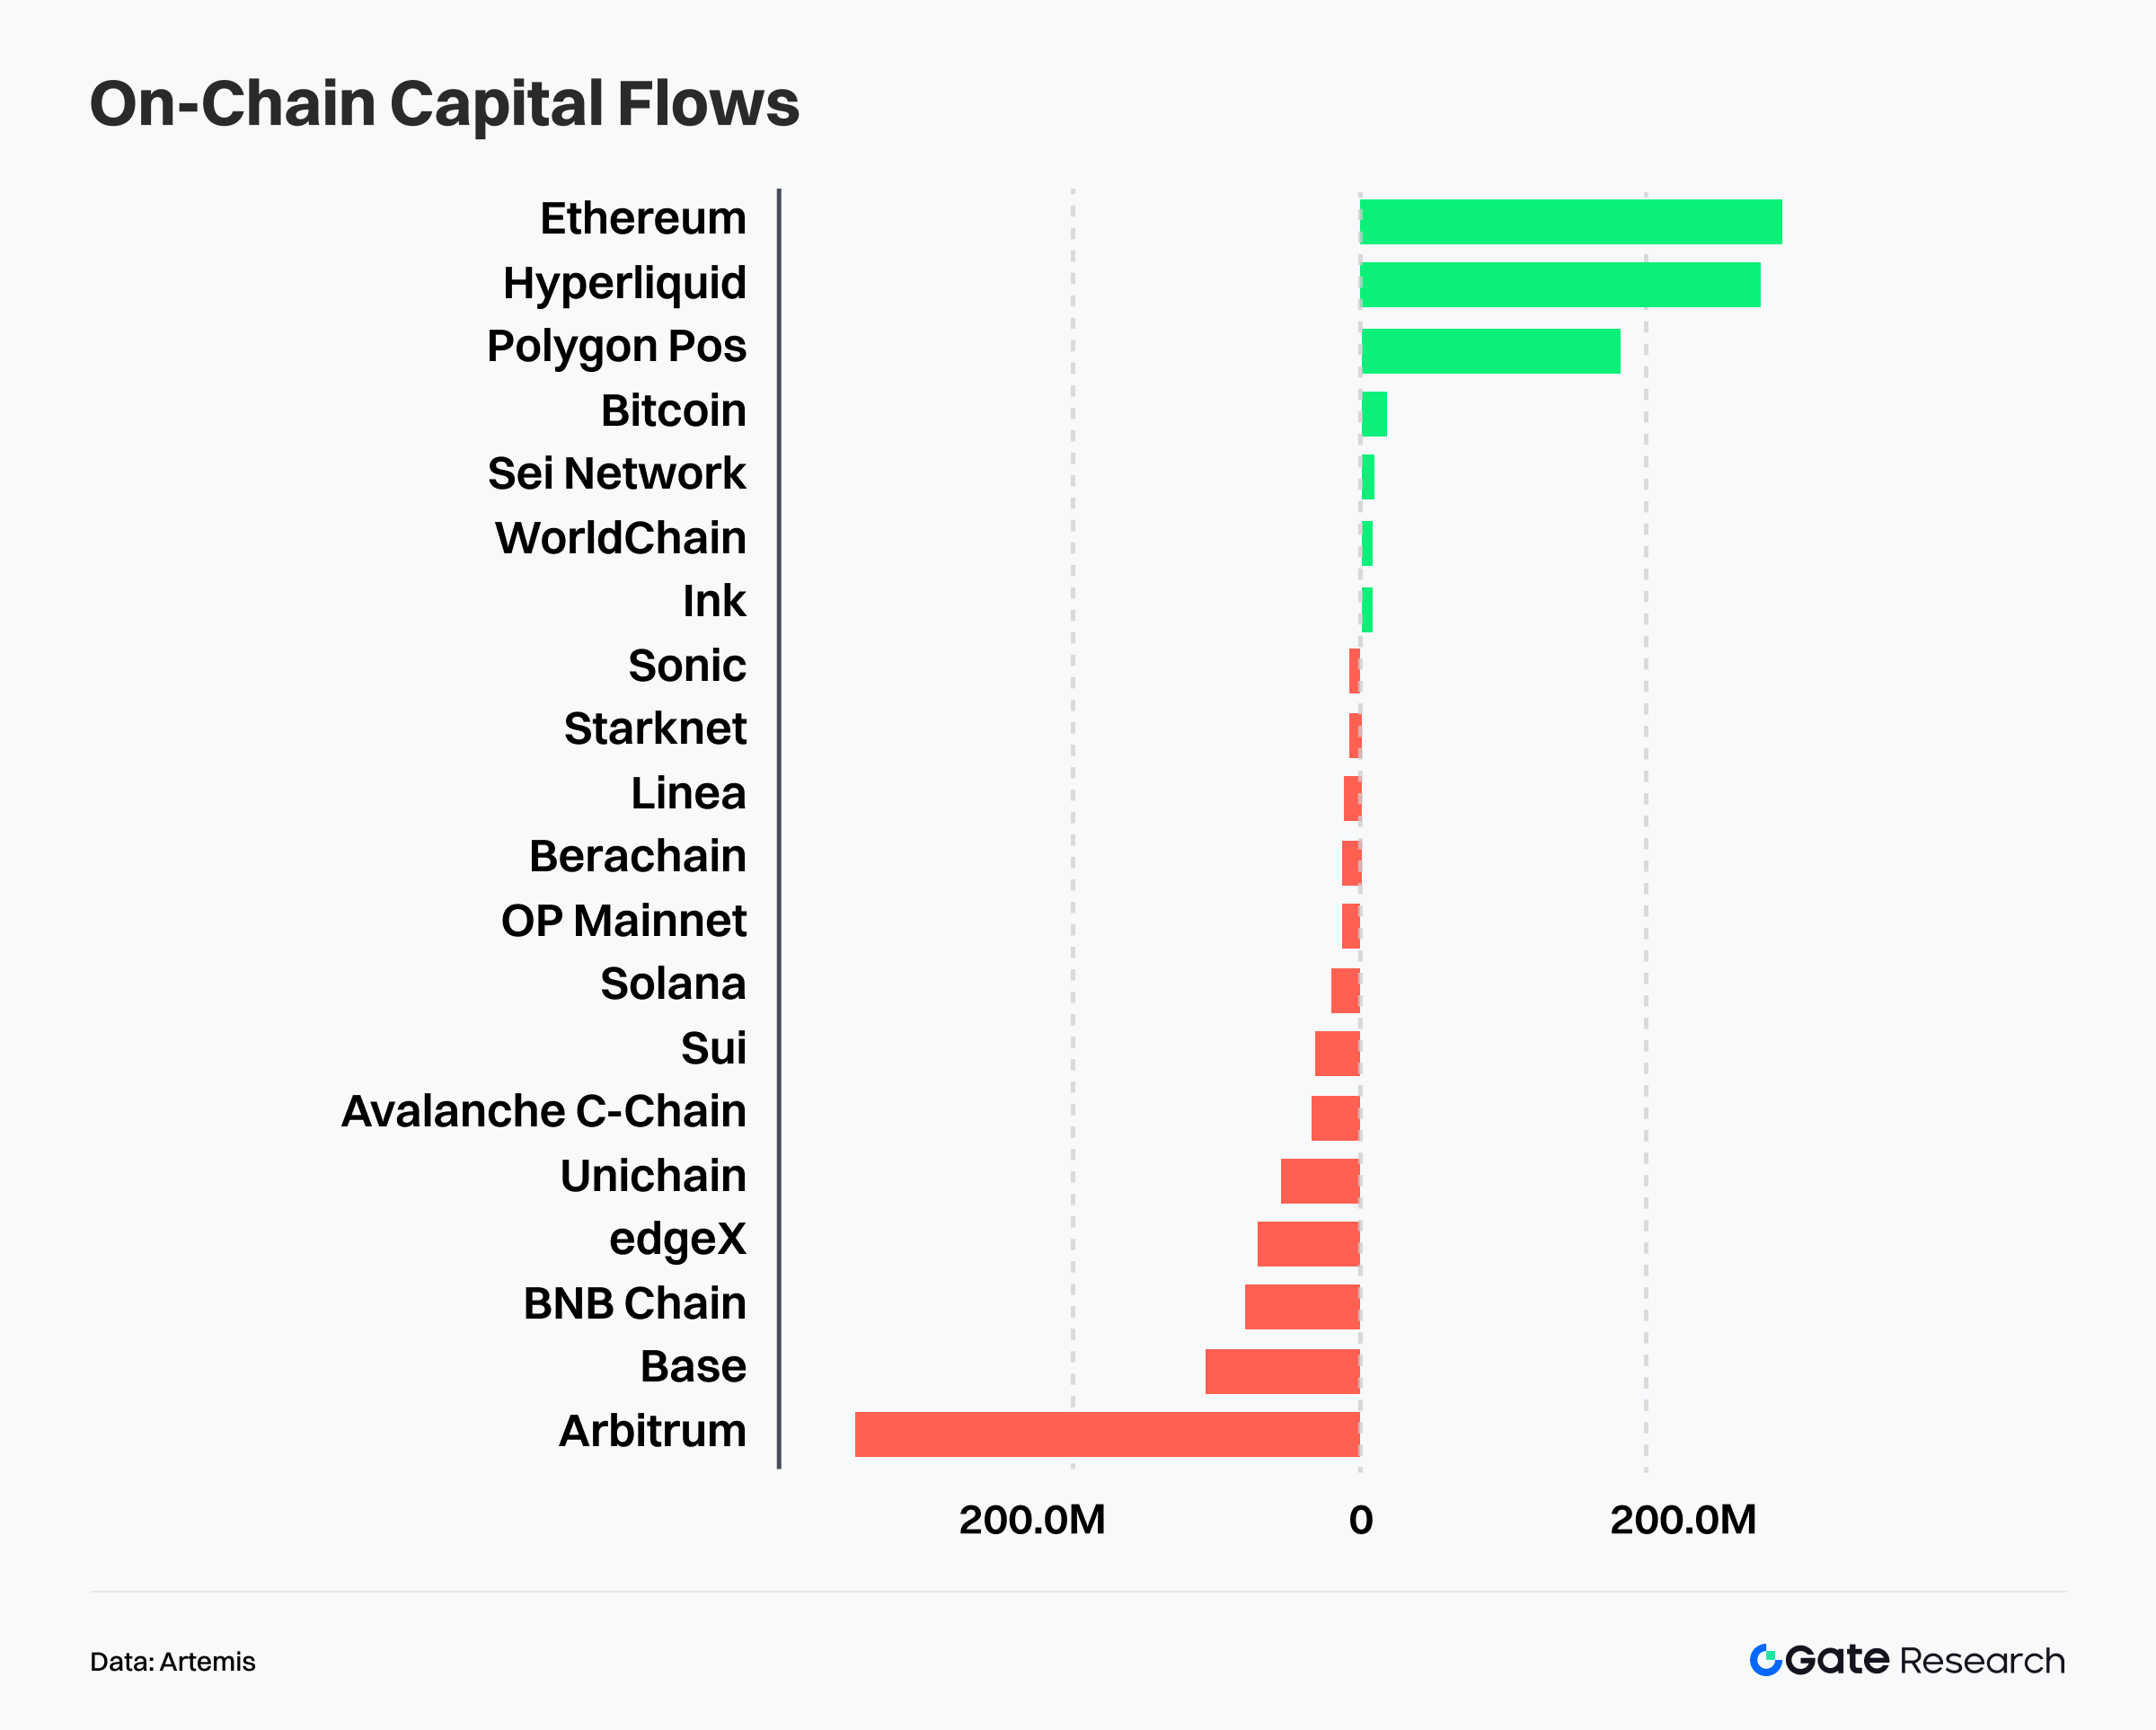
D’après Artemis, les flux de capitaux sur les blockchains publiques le mois dernier présentent une divergence structurelle nette. Plutôt qu’une prise de risque généralisée, les capitaux se sont alloués selon des préférences différenciées : d’un côté vers les couches de règlement centrales à forte sécurité, de l’autre vers les réseaux trading à efficacité accrue. Parallèlement, certaines Layer 2 et écosystèmes à forte valorisation subissent une pression continue de sorties nettes.【4】
En termes d’entrées, Ethereum, Hyperliquid et Polygon PoS ont enregistré les flux nets les plus importants, surclassant les autres chaînes. Ethereum affiche le plus fort afflux, ce qui indique qu’en phase d’incertitude et de faible volatilité, les capitaux privilégient la profondeur de liquidité et la robustesse des réseaux de règlement pour parquer ou réallouer les positions. Les entrées sur Hyperliquid montrent que le capital trading ne quitte pas le marché mais migre vers des réseaux spécialisés à rotation rapide et matching efficace. Les entrées sur Polygon PoS restent modérées, davantage liées à l’usage applicatif et à la demande d’interaction régulière.
En sortie, la pression se concentre sur Arbitrum, qui affiche la plus forte déperdition de capitaux majeurs, devenant la principale source de drainage. En parallèle, une partie des capitaux quittant Arbitrum pourrait migrer vers des réseaux trading à cycle court comme Hyperliquid. Base et Avalanche enregistrent aussi des sorties nettes, ce qui montre qu’au sein des Layer 2 et chaînes applicatives, la réallocation interne prime sur le retrait pur des actifs risqués.
En synthèse, les flux de capitaux actuels sur les chaînes publiques relèvent d’une « allocation parallèle selon le profil de risque ». Le capital prudent se redéploie sur les couches de règlement centrales (Ethereum), soutenant la gestion de positions cross-cycle, tandis que le capital tolérant au risque quitte certains environnements d’exécution traditionnels pour se concentrer sur des réseaux comme Hyperliquid, axés trading et efficacité du capital. Le marché entre dans une phase de rotation structurelle et de revalorisation du risque, la logique d’allocation passant d’un moteur narratif unique à une analyse plus fine des rôles de chaque réseau et de l’efficience du capital.
Analyse des principaux indicateurs Bitcoin
En décembre, le contexte macroéconomique et la performance des actifs risqués ont divergé : les marchés actions se sont renforcés, tandis que le marché crypto est resté sous pression. Les données sur l’emploi sont ressorties contrastées et la Fed a maintenu une posture attentiste. Dans ce contexte, le BTC a entamé une phase de consolidation et de reprise : la structure court terme s’est stabilisée, mais l’élan haussier reste à confirmer. L’enjeu central demeure la capacité du prix actuel à être absorbé par la structure de coût existante et soutenu par la répartition de l’offre.
Dans ce cadre, les données on-chain délivrent des signaux cohérents sur trois axes : distribution des coûts, offre en perte latente et structure des détenteurs. Le BTC reste négocié au-dessus de son coût de base, ce qui traduit la persistance de la tendance principale ; toutefois, une offre dense en surplomb limite les rebonds à court terme. La hausse des pertes latentes traduit une purge du sentiment, la pression vendeuse se concentrant sur les détenteurs court terme, alors que l’offre long terme demeure stable. Le marché semble ainsi passer d’un mouvement unidirectionnel à une phase de consolidation, digestion et rééquilibrage.
Assouplissement de l’offre BTC haut de gamme, consolidation au-dessus des zones de coût denses
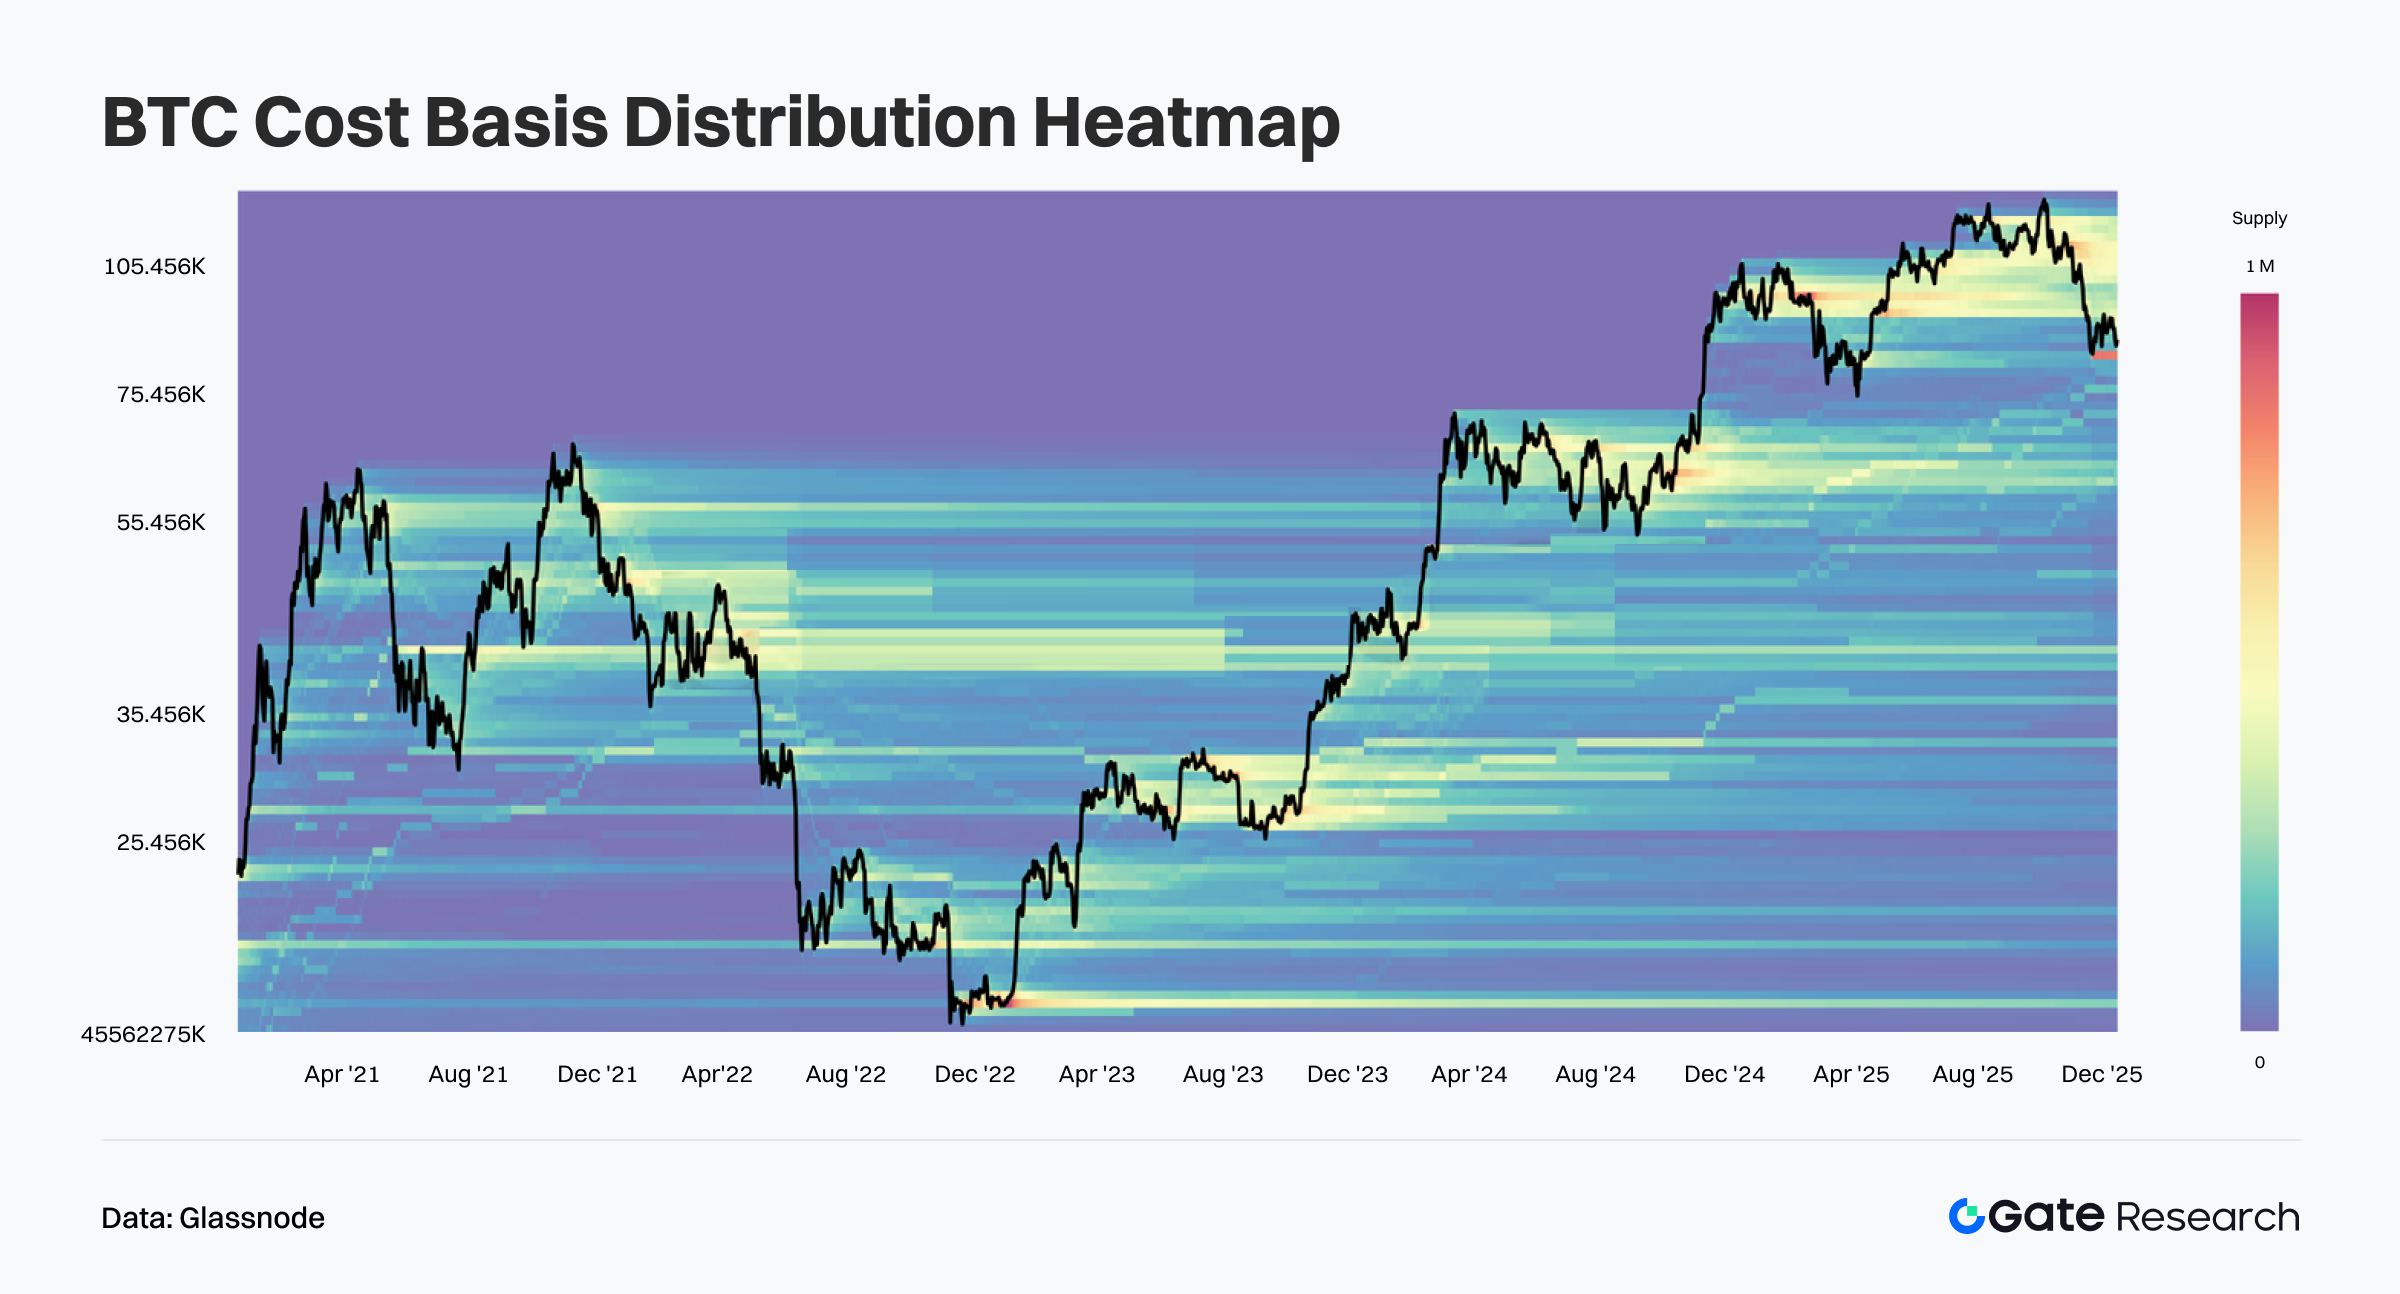
D’après Glassnode, la heatmap de la distribution du coût de base BTC montre qu’au cours du récent repli depuis les sommets, l’offre à coût élevé au-dessus du marché s’est affaiblie, sans migration descendante brutale. Les prix sont restés dans les zones de coût dense proches, sans déclencher de redistribution massive vers le bas. Cela suggère que les détenteurs haut de gamme absorbent les corrections et attendent la reprise, le sentiment de marché devenant plus neutre et prudent. 【5】
Structurellement, plusieurs bandes historiques de concentration de coûts subsistent sous les niveaux actuels. Ces bandes continues et stables indiquent que les détenteurs moyens et bas conservent un avantage de coût, assurant un support potentiel en cas de baisse. L’absence de zones vides d’offre en expansion rapide indique que les récents replis relèvent d’une rotation en haut de cycle et d’un relâchement de pression, non d’une détérioration structurelle de la tendance.
En synthèse, le BTC présente un schéma de rééquilibrage typique : « digestion de l’offre en surplomb, support sous-jacent préservé ». La dynamique haussière court terme est freinée par la résistance des coûts, ce qui rend plus probable une consolidation latérale et une redistribution progressive de l’offre. Tant que les structures de coût inférieures tiennent, le cadre haussier moyen terme reste intact, et la phase actuelle s’apparente à une correction saine plutôt qu’à une inversion de tendance.
Hausse contenue de l’offre BTC en perte latente, entrée en phase de stress-test
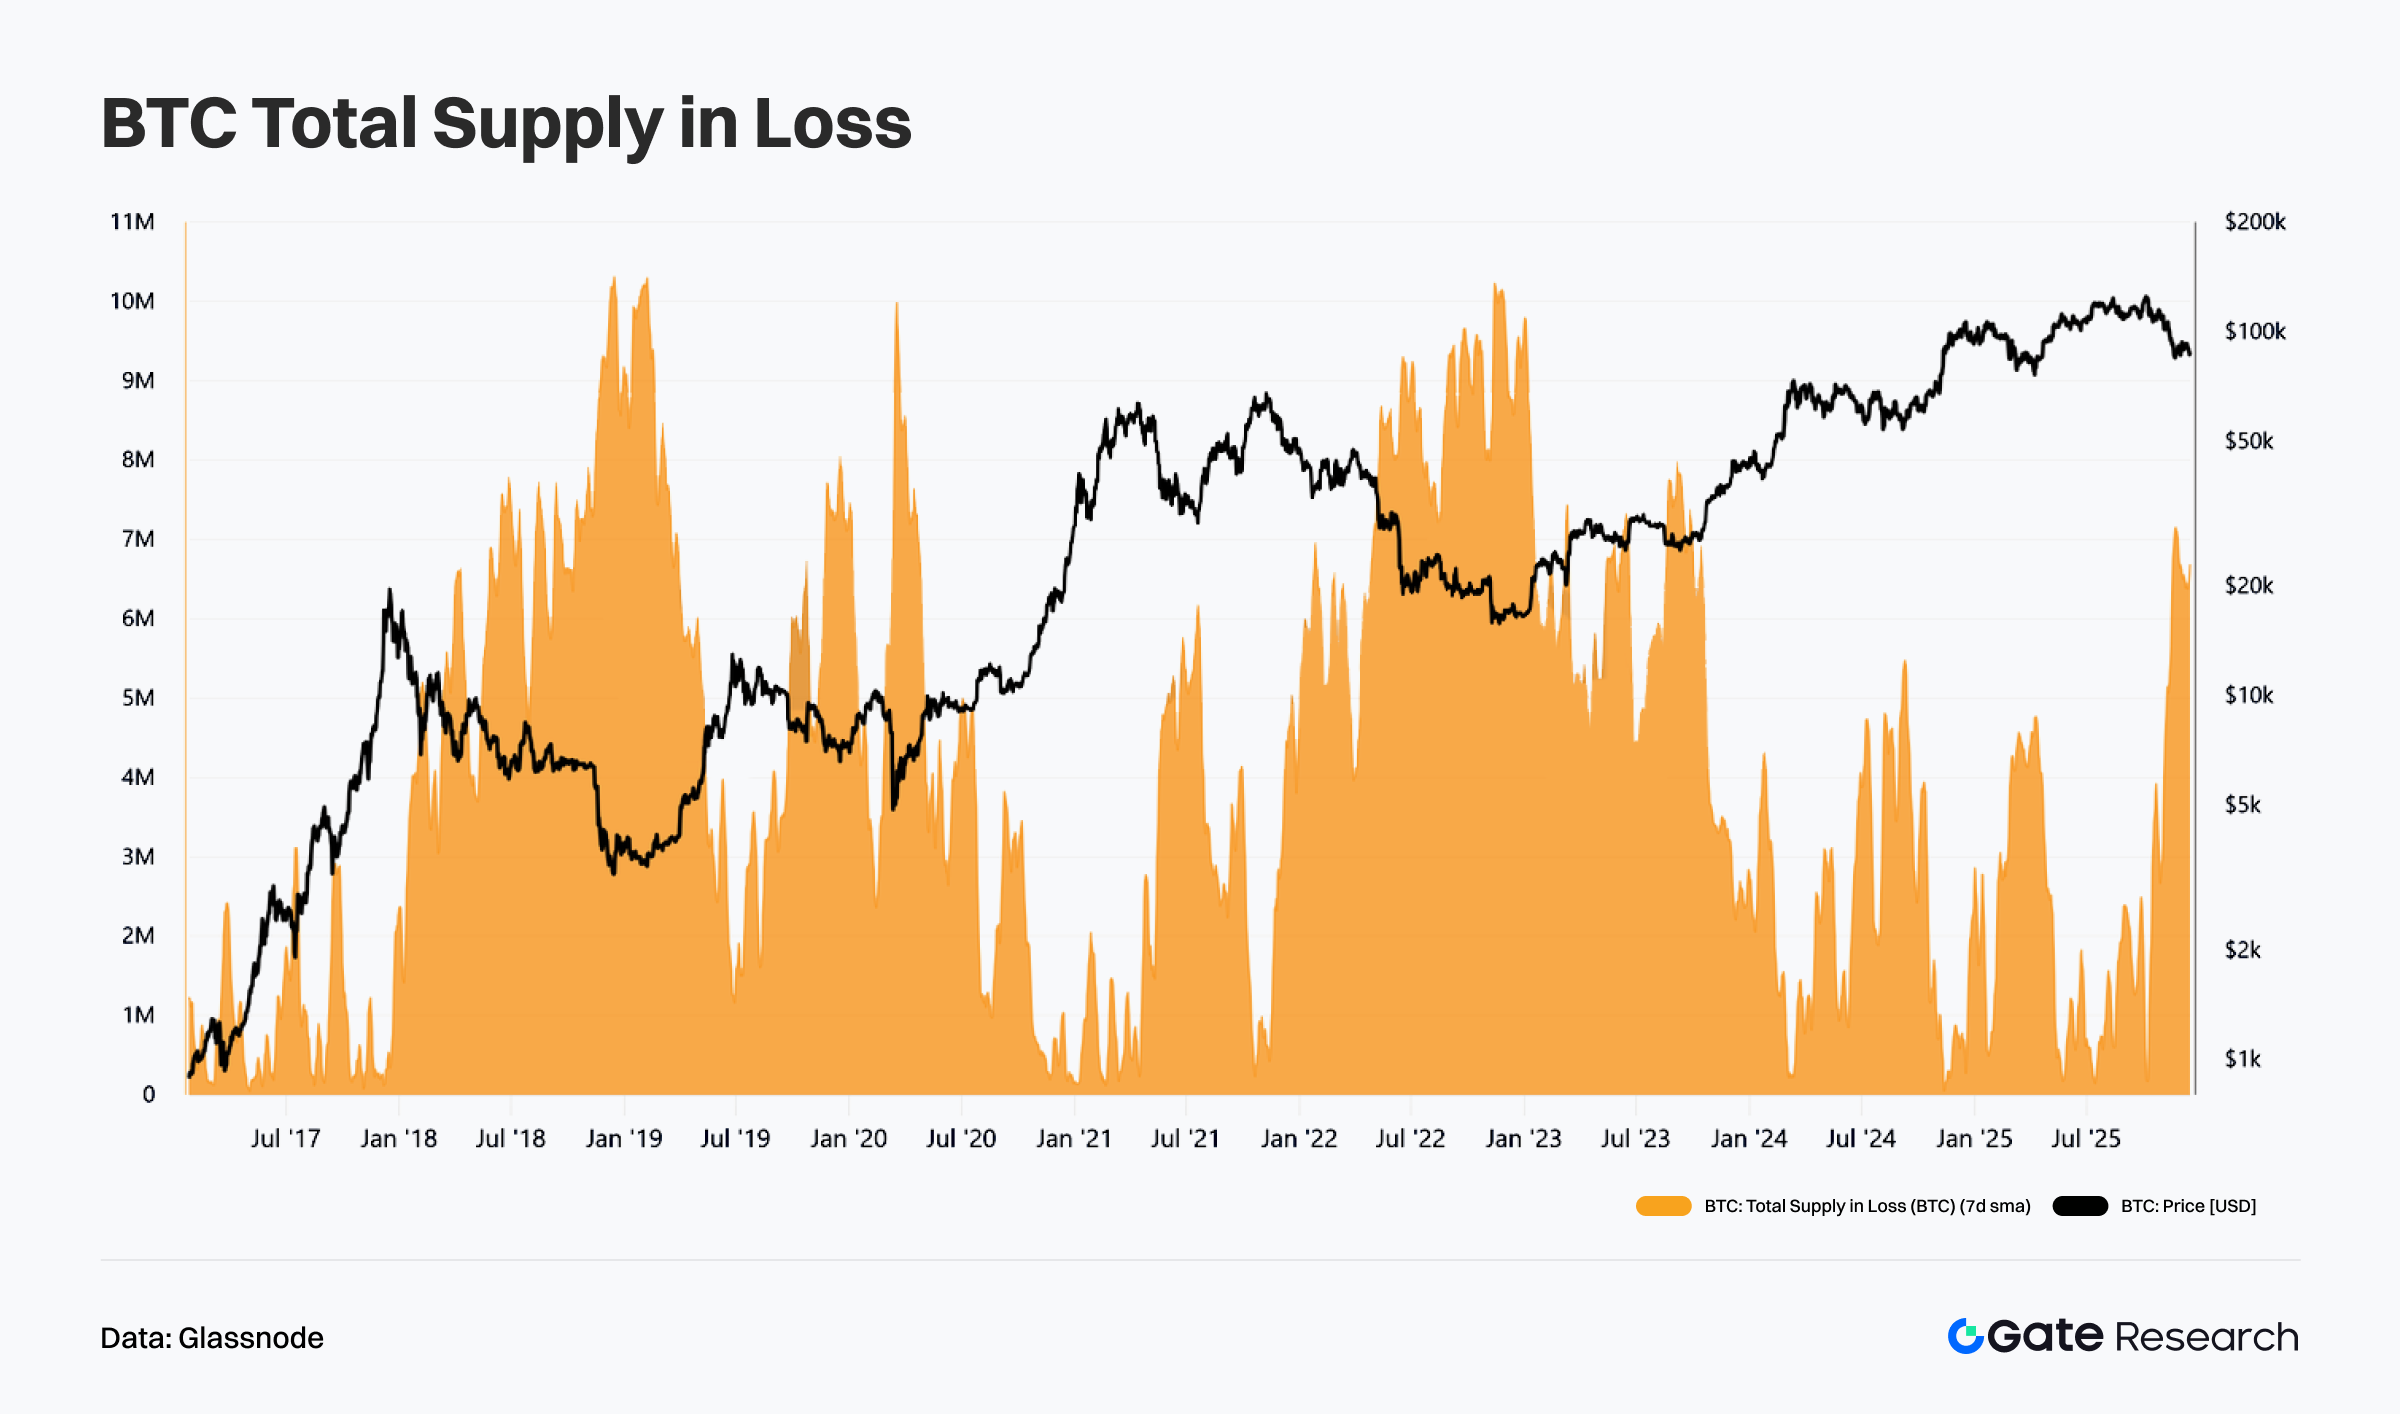
Selon Glassnode, l’offre BTC en perte latente (moyenne mobile 7 jours) a nettement augmenté le mois dernier, les prix s’étant repliés depuis les sommets. Cela montre qu’une part de l’offre court terme et momentum est passée en perte latente, ce qui accroît la pression à court terme. Toutefois, en valeur absolue, les pertes latentes restent très inférieures aux pics des corrections profondes ou marchés baissiers précédents, et ne témoignent pas d’une panique systémique. La hausse actuelle traduit un stress-test post-rallye et un refroidissement du sentiment.【6】
Historiquement, les pics de pertes latentes coïncident avec les débuts de repli ou de transition de tendance, alors que les retournements profonds s’accompagnent de pertes latentes élevées et persistantes. À ce stade, la hausse de l’indicateur reste limitée dans le temps, ce qui montre que l’offre en perte n’a pas encore conduit à une capitulation généralisée. Le marché demeure dominé par la détention passive et la patience plutôt que par des ventes agressives.
En résumé, l’augmentation de l’offre en perte latente traduit un resserrement de l’appétit pour le risque et le passage à la prudence, sans dégradation structurelle. Tant que les prix ne passent pas sous les zones de coût moyen terme, l’indicateur reste cohérent avec un repli haussier et une rotation de l’offre. À suivre : une contraction rapide confirmerait la fin de l’ajustement, une hausse prolongée signalerait une consolidation plus profonde et une nouvelle revalorisation à venir.
Détenteurs court terme sous pression, l’offre long terme reste en profit
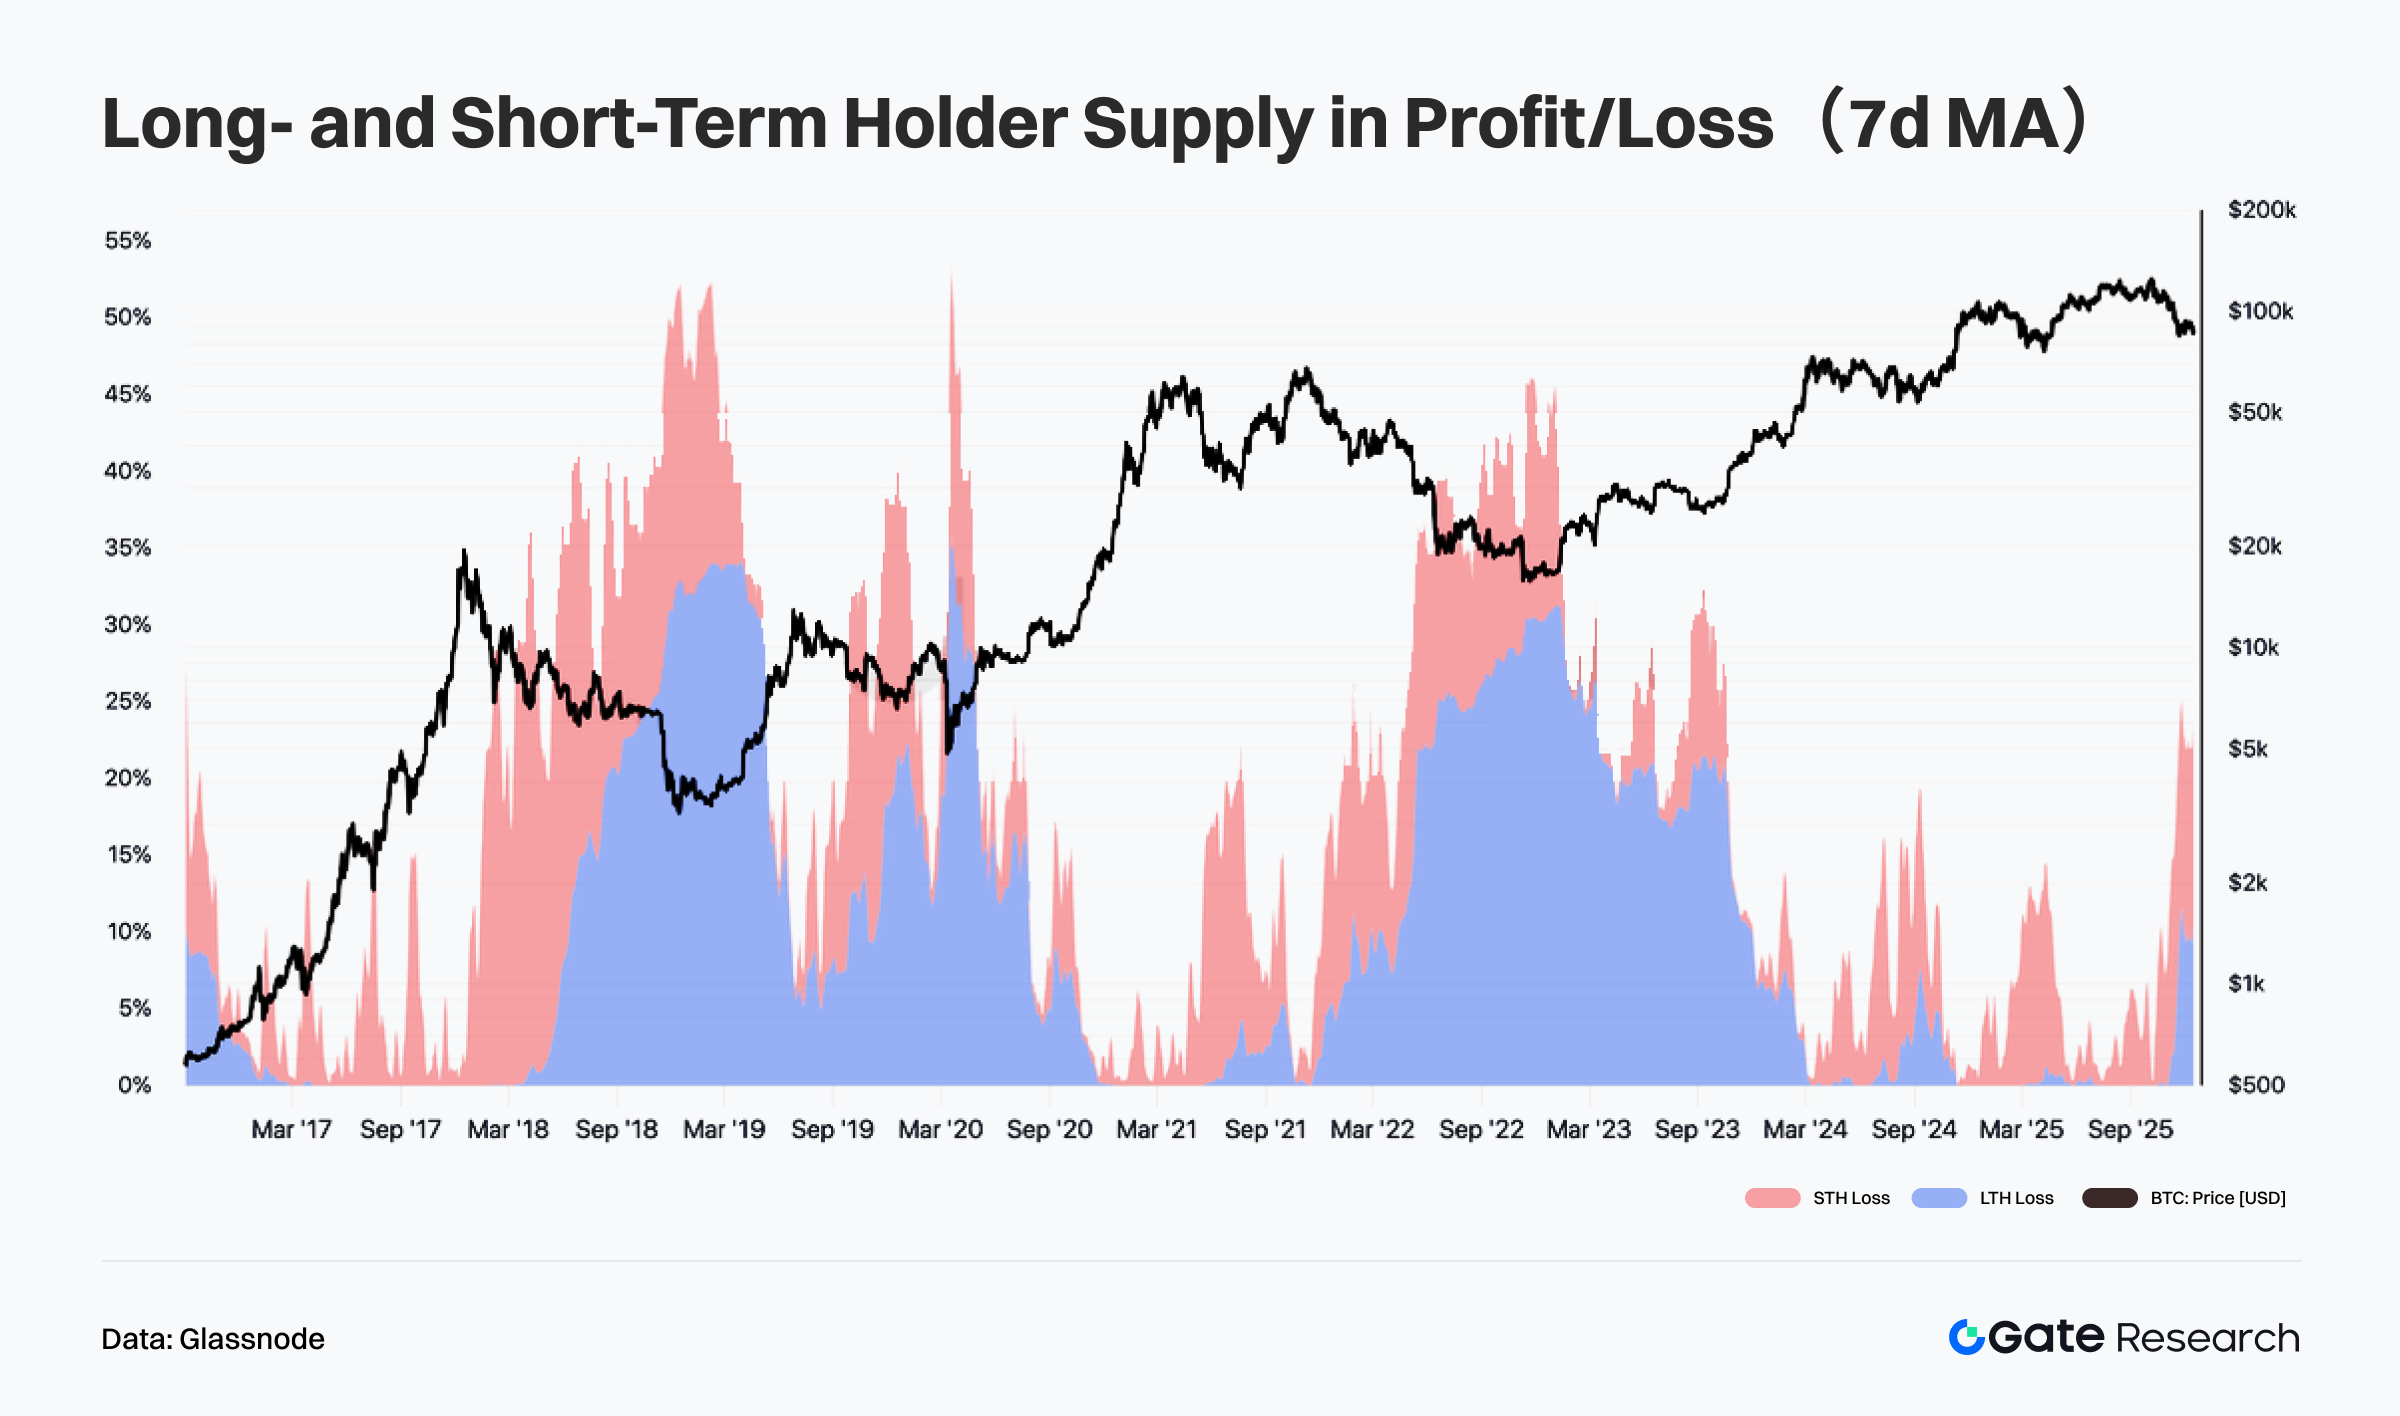
Selon Glassnode, la répartition profit/perte de l’offre BTC entre détenteurs long terme et court terme (moyenne mobile 7 jours) montre que sur le mois, la part de l’offre court terme (STH) en perte a fortement augmenté avec le repli des prix. Cela traduit le passage des nouveaux entrants en perte latente, ce qui réduit la tolérance au risque court terme et concentre la pression sur l’offre à courte durée. Ce schéma est typique des replis post-rallye, indiquant une digestion par le capital momentum et non une liquidation généralisée.【7】
Structurellement, l’offre long terme (LTH) reste majoritairement en profit, avec des ratios de perte proches des plus bas historiques. Cela montre que l’offre centrale n’a pas été affaiblie par la volatilité court terme. Historiquement, seul un basculement massif de l’offre LTH en perte coïncide avec des retournements de tendance ou marchés baissiers — ce qui n’est pas le cas actuellement.
En synthèse, la répartition actuelle profit/perte du BTC illustre une correction haussière classique : « stress court terme, stabilité long terme ». Si les pertes court terme poussent le marché en consolidation et rotation, la structure d’offre long cycle reste intacte, soutenant la résilience de la tendance moyen terme. Un rebond rapide ferait reculer les pertes STH et réparerait la structure court terme. À l’inverse, une baisse prolongée jusqu’aux zones de coût long terme nécessiterait une vigilance accrue sur le risque structurel.
Projets tendance & activité tokens
Les données on-chain montrent une concentration croissante des capitaux et utilisateurs dans les écosystèmes à forte base d’interaction et profondeur applicative. Parallèlement, les projets à fort narratif et innovants deviennent le nouveau centre d’intérêt des investisseurs. Cette section met en lumière les projets et tokens majeurs des dernières semaines, en analysant leur logique de croissance et leur potentiel d’impact sur le marché.
Panorama des projets tendance
BSC Prediction Markets
Avec les lancements successifs de Predict Fun et Probable, le réseau BSC voit émerger un marché de prédiction structuré autour de trois plateformes, dont Opinion. Toutes opèrent dans des cadres de capitaux et ressources similaires. À ce stade, la concurrence sur BSC s’apparente à une expérimentation parallèle plutôt qu’à la domination ou la consolidation par une plateforme unique. Chaque projet adopte une différenciation sur les frais, les incitations et le positionnement utilisateur. 【8】
Depuis la montée en puissance du marché de la prédiction BSC fin octobre, le volume notionnel cumulé progresse, approchant 6,5 milliards de dollars à fin décembre. Cette trajectoire traduit une demande de trading soutenue dans l’écosystème BSC, sans dépendre de pics événementiels ponctuels.
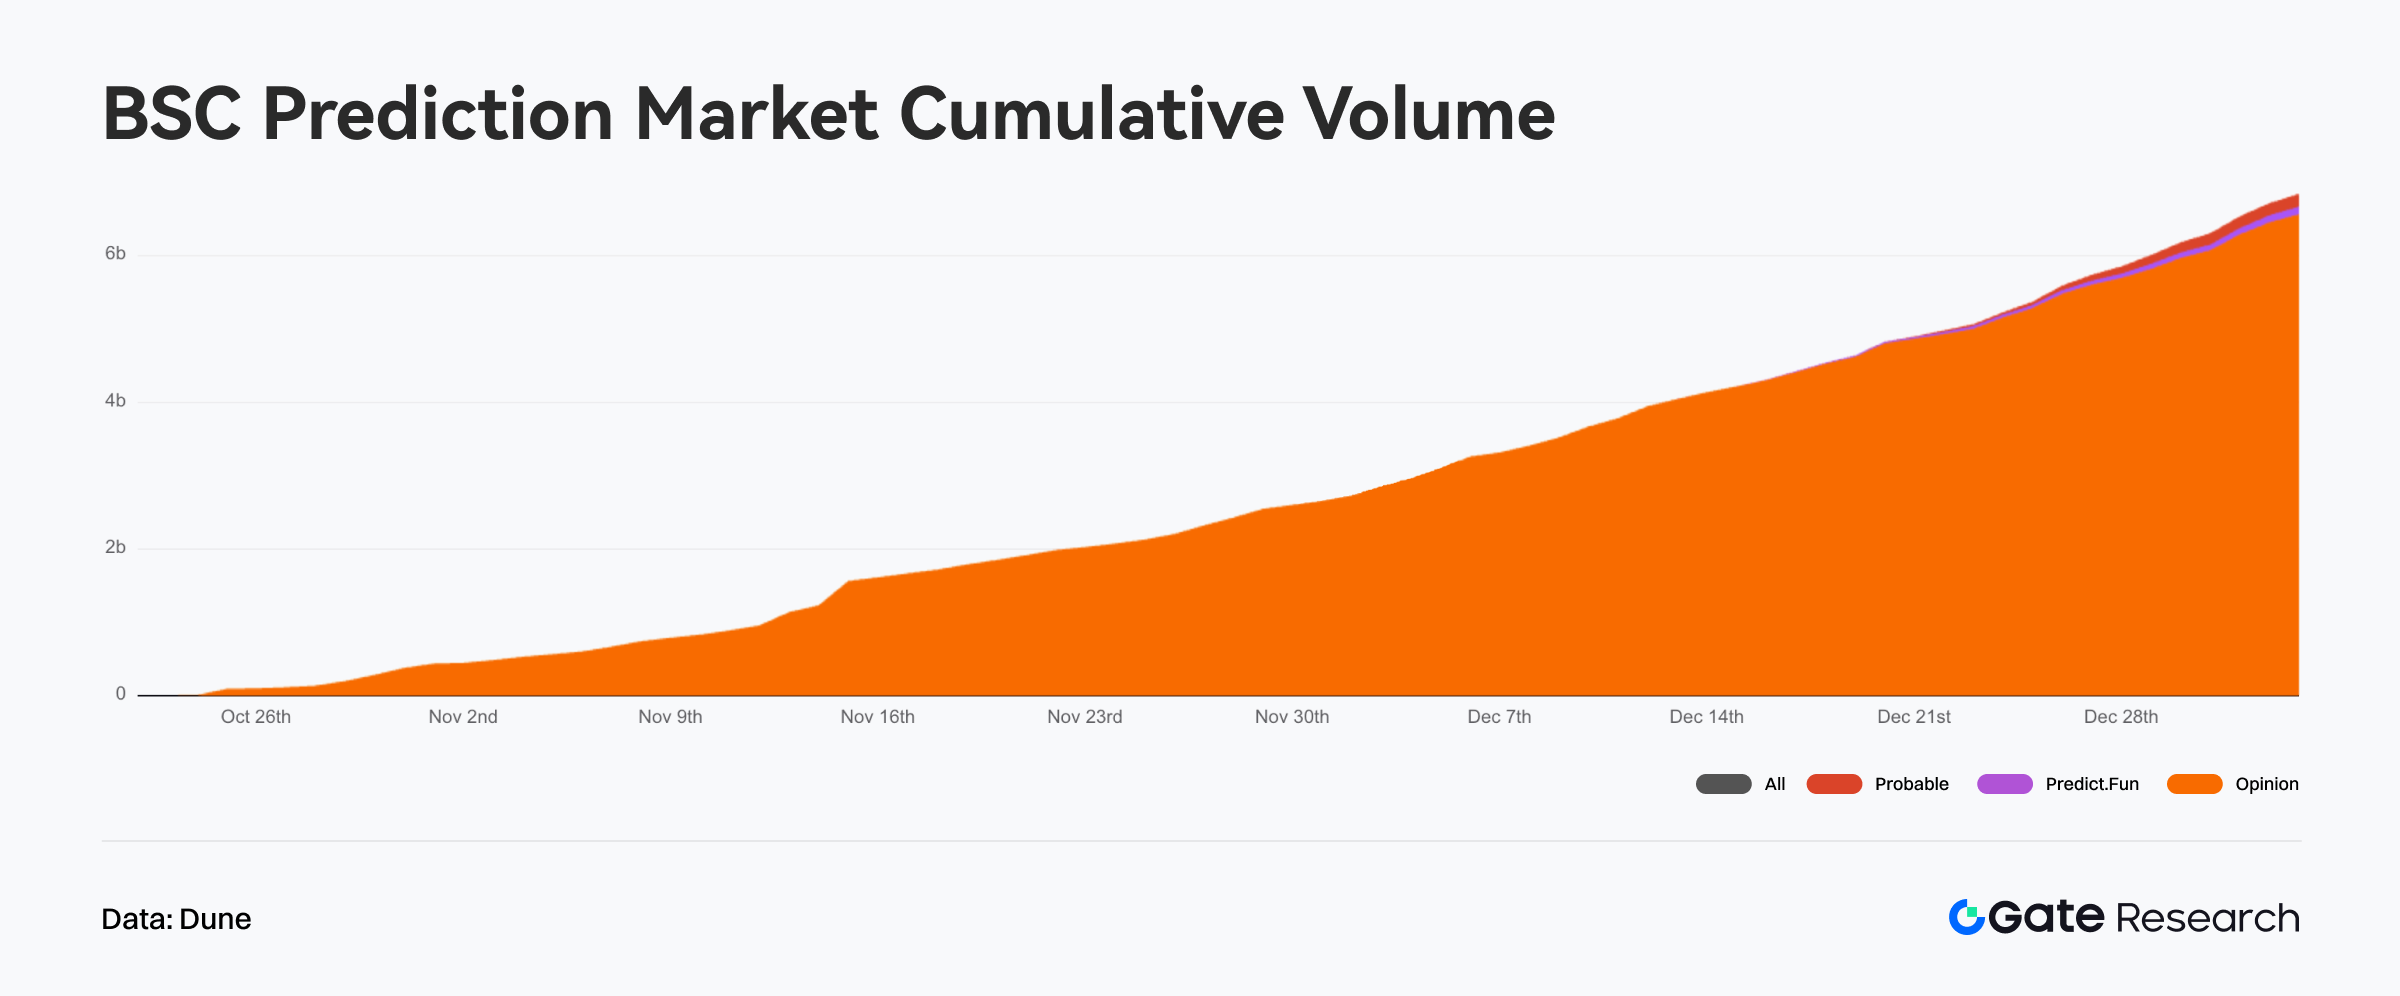
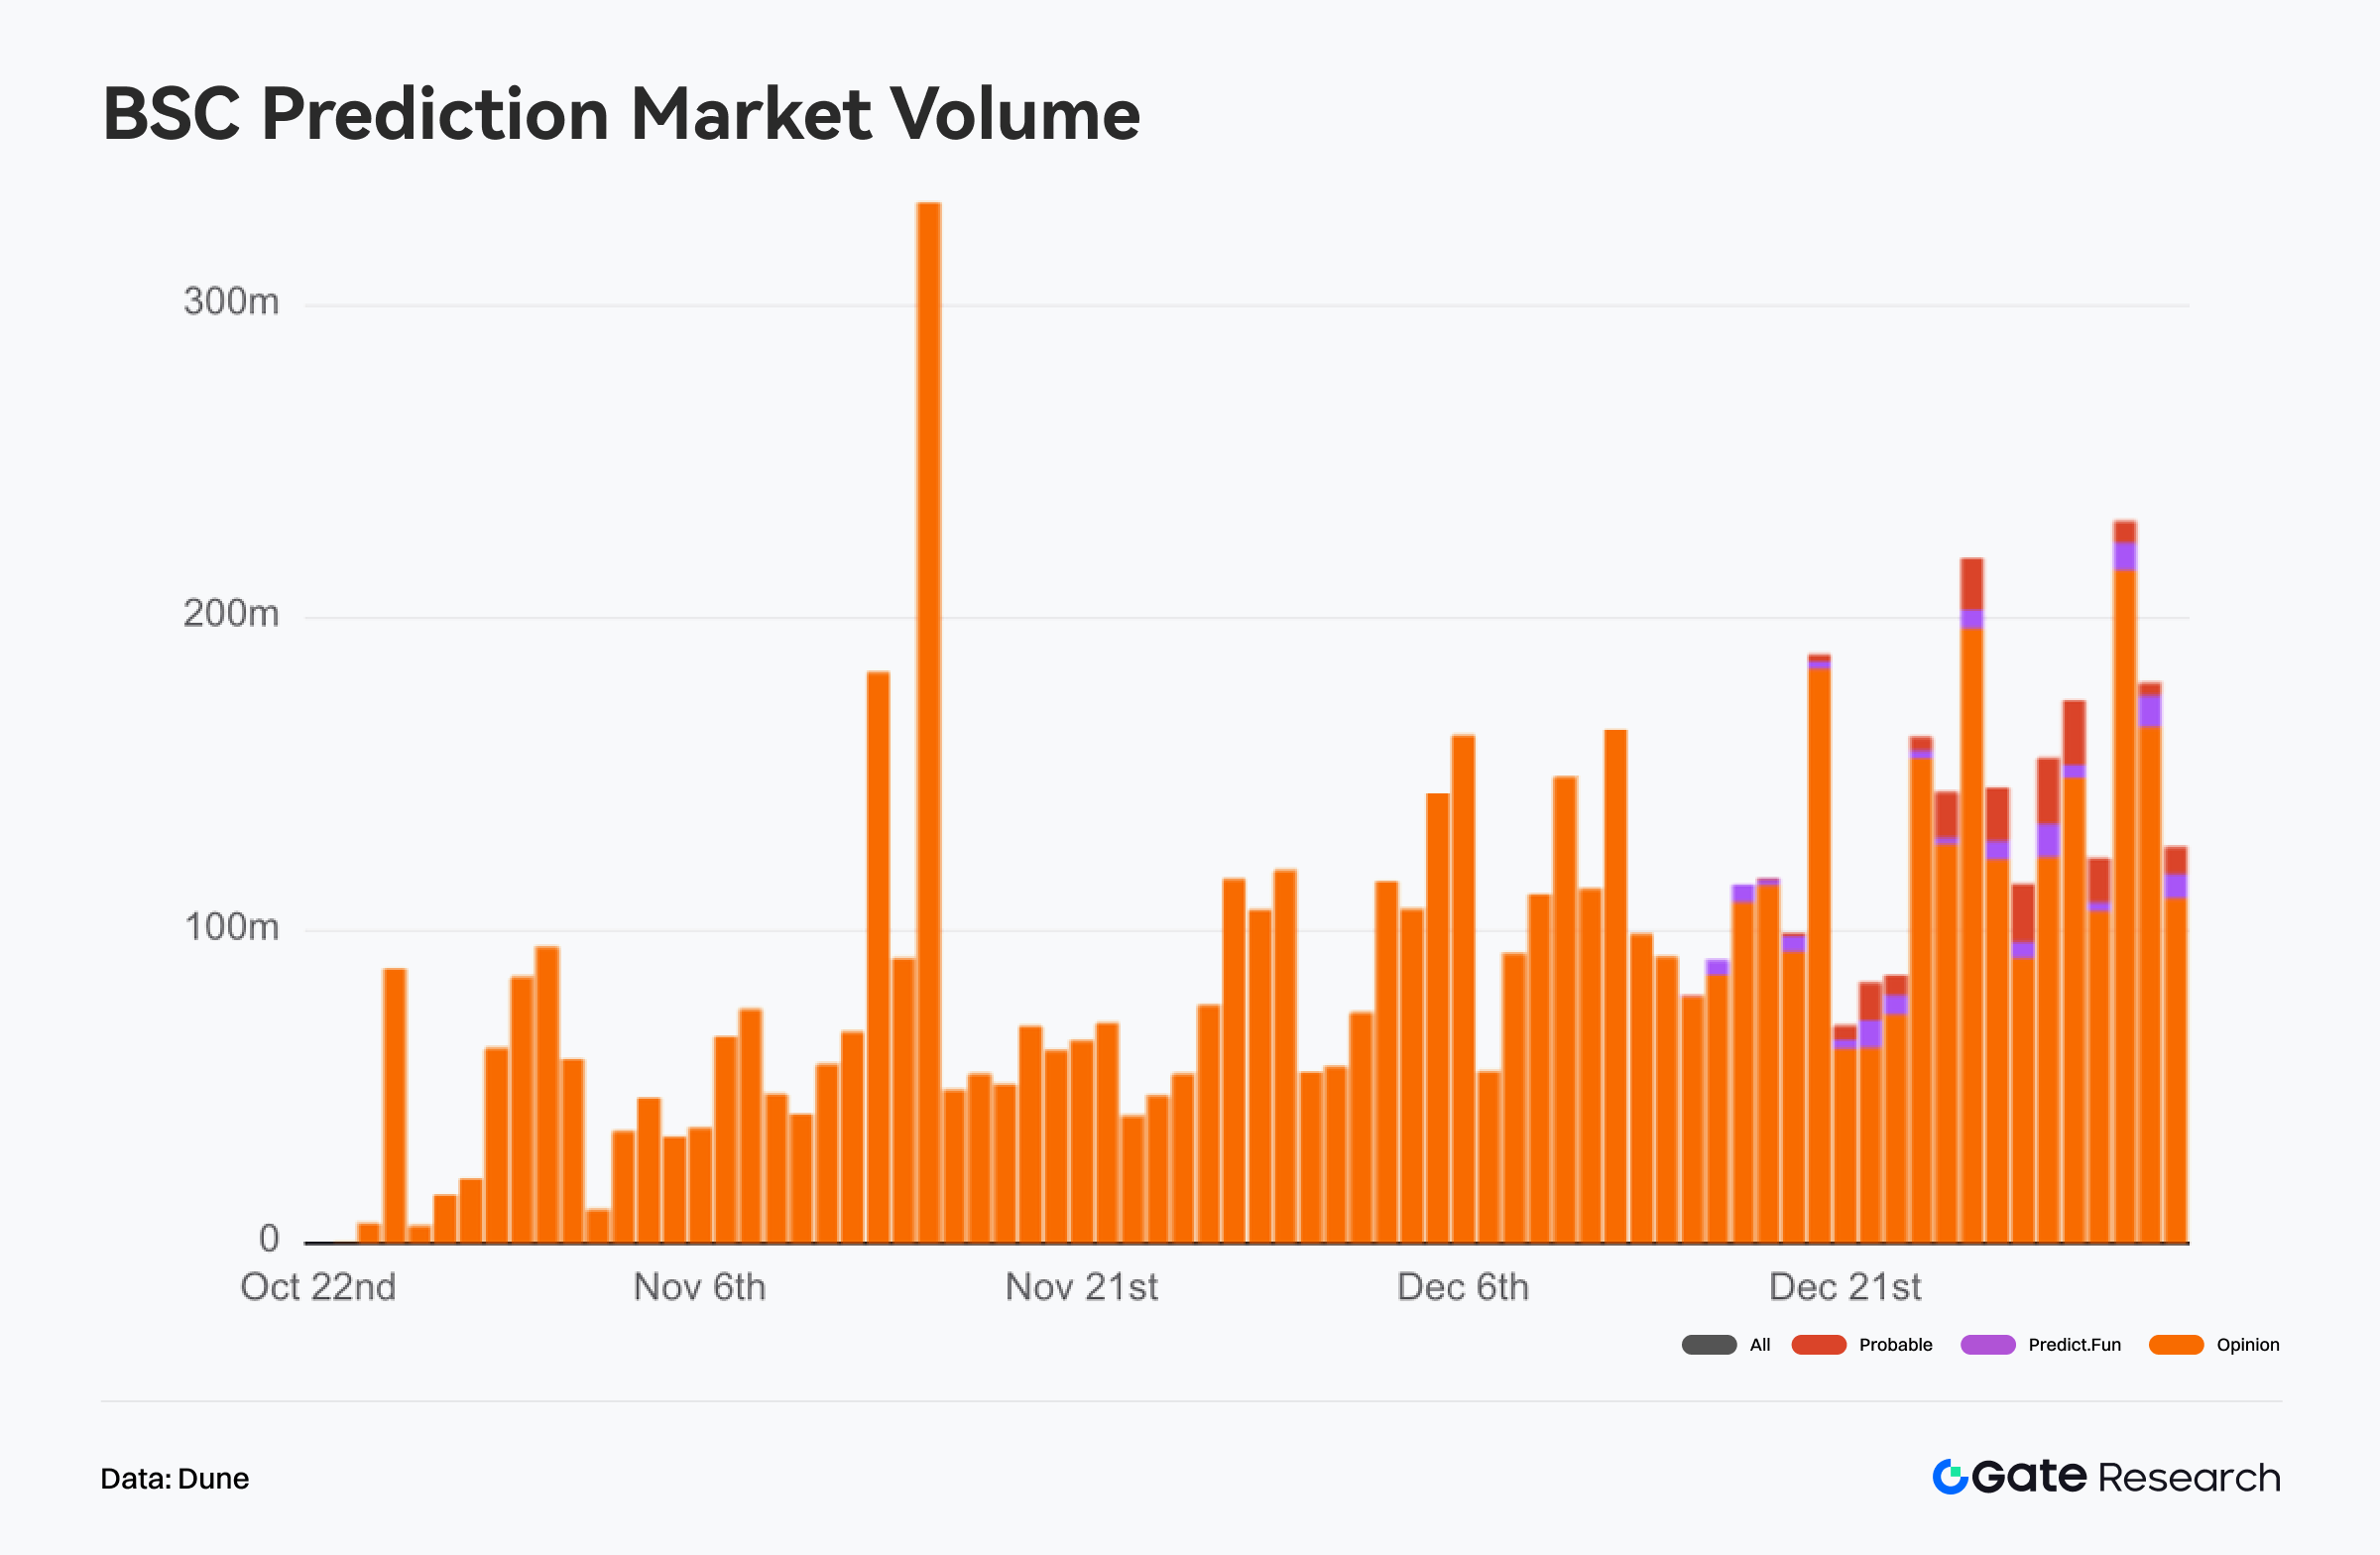
En volume, le marché est très concentré sur Opinion, qui assure plus de 95 % de l’activité, tant en cumulé qu’en quotidien, et constitue le moteur de l’expansion. Opinion a régulièrement enregistré des journées actives entre 100 et 300 millions de dollars. Predict Fun et Probable n’ont commencé à afficher de l’activité qu’à partir de mi-décembre, avec des volumes encore marginaux.
Sur le plan concurrentiel, le marché de la prédiction BSC s’apparente à une « plateforme dominante à l’échelle, les autres étant en phase de test et de validation ». Opinion a instauré une boucle de trading à fort volume et forte rétention grâce à des frais bas et une liquidité mature. Predict Fun propose un design plus agressif, mais reste en retrait en volume et en acquisition utilisateur. Probable mise sur le zéro frais et l’incitation par points, illustrant une phase d’amorçage et d’expérimentation.
Cette structure interne n’implique pas un paysage concurrentiel figé. Les nouvelles plateformes n’en sont qu’aux premiers stades, la profondeur de marché et les fonctionnalités restant à développer. Le marché BSC reste en expansion, et les données actuelles reflètent surtout un effet de concentration en phase de formation d’échelle, plus qu’une concurrence mature. L’évolution dépendra de la capacité des nouveaux entrants à déployer incitations de liquidité, fidélisation et différenciation produit.
Panorama des tokens tendance
$BEAT
Audiera (BEAT) est l’extension Web3 du jeu de danse et musique classique Audition, visant une base de plus de 600 millions d’utilisateurs. En intégrant IA et blockchain, le projet ambitionne un écosystème immersif axé sur la création musicale, l’interaction avec des idoles IA, le minting de NFT et le fitness par le mouvement. Son offre couvre jeux mobiles, mini-apps et studios créatifs IA, positionnant BEAT comme projet Web3 de divertissement à forte interactivité et capacité de création de contenu.
Selon CoinGecko, $BEAT a enregistré un pic de plus de 300 % en décembre. Ce rallye n’a pas été provoqué par un catalyseur fondamental unique, mais s’est produit dans un marché en range, marqué par une rotation du capital des grandes capitalisations vers des tokens mid et small cap à bêta élevé. Avant la hausse, la structure d’offre de BEAT était saine, sans pression vendeuse prolongée. L’amélioration de la liquidité et de la profondeur de carnet a favorisé l’entrée de capitaux suiveurs de tendance. 【9】
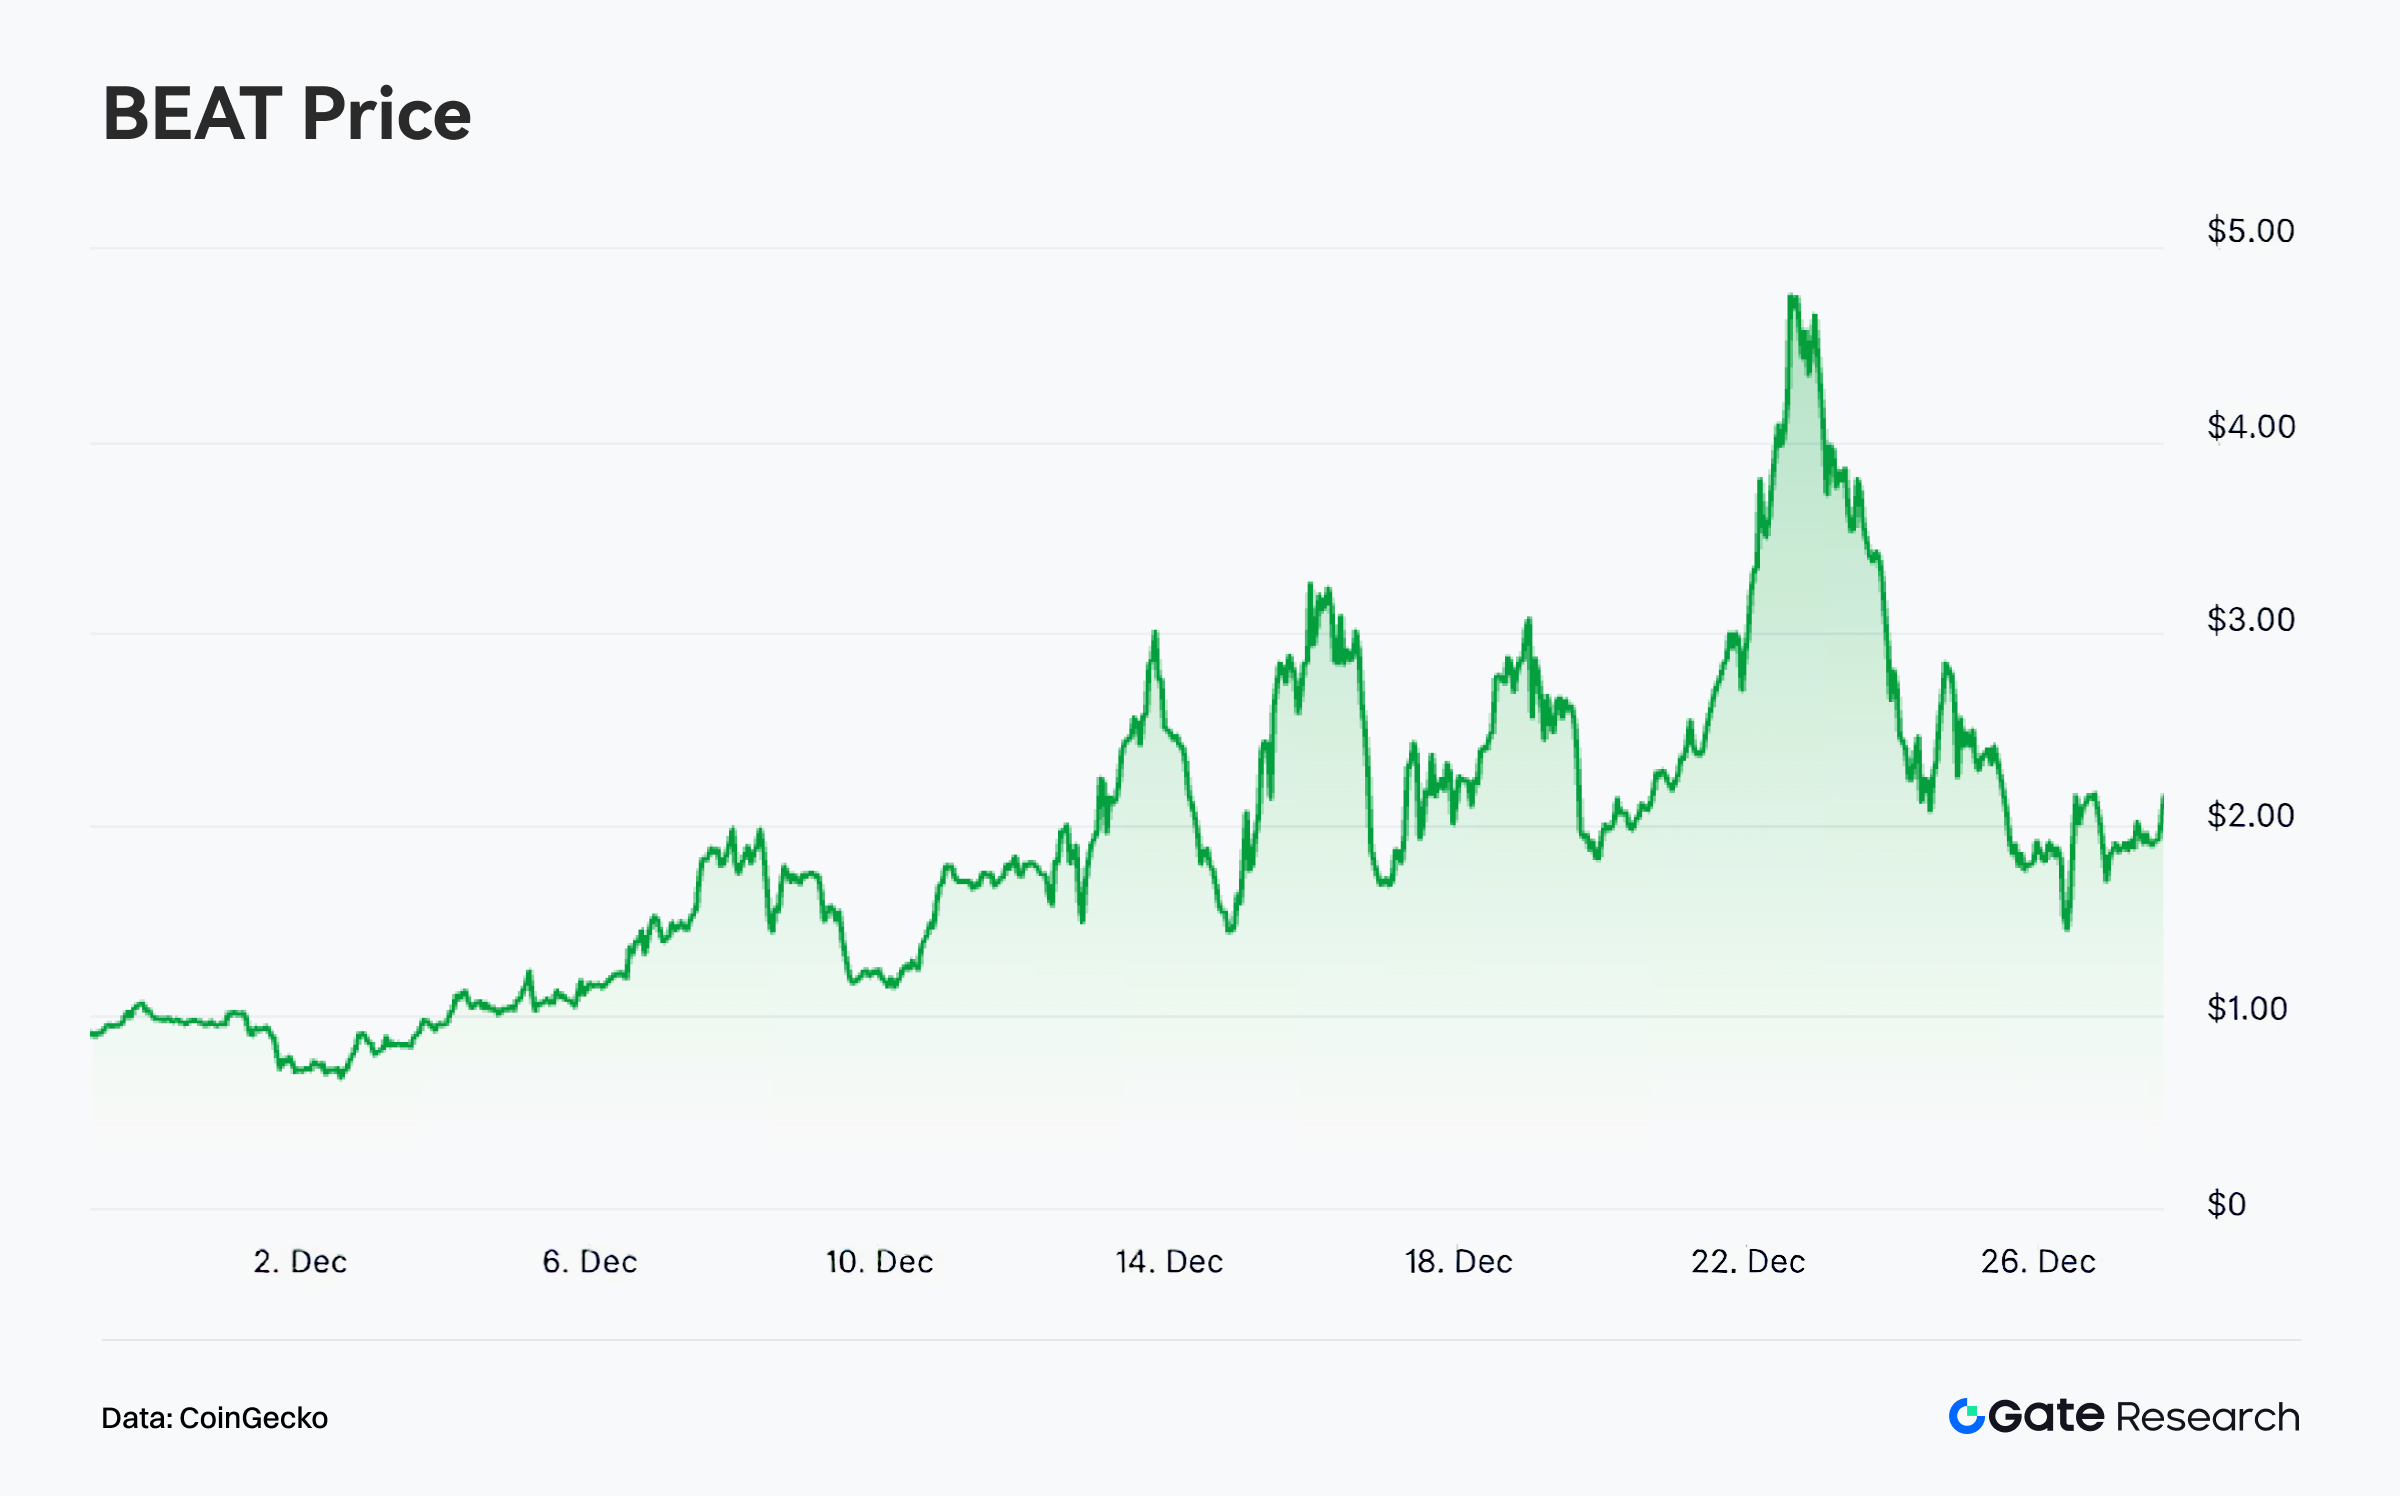
Au niveau projet, BEAT n’a pas connu d’événement négatif ni de signe de dégradation fondamentale récemment. Le prix a donc été dicté par ses caractéristiques de trading et les attentes d’élasticité court terme. L’absence de frein fondamental et l’amélioration de la structure de trading ont fait de BEAT une cible pour le capital opportuniste durant une phase volatile, générant un rallye ponctuel. Sur les réseaux sociaux, la hausse rapide du prix a intensifié les discussions, l’attention se portant sur l’ampleur du rallye, la liquidité court terme et la possibilité d’une nouvelle jambe haussière. Le sentiment communautaire a amplifié la volatilité et la rotation sur les sommets, après l’entrée du capital principal.
La performance récente de $BEAT illustre un rallye typique porté par la rotation du capital, l’amélioration de la structure de trading et l’amplification communautaire. Sa vigueur dépend avant tout du contexte de marché et de la dynamique de trading, la trajectoire future restant liée à l’évolution des volumes et à la préservation ou non des seuils techniques clés.
Conclusion
En décembre 2025, l’écosystème blockchain public a affiché un schéma de « stabilisation de l’activité sur un rythme ralenti et divergence structurelle accrue ». Les chaînes à haute performance et couches de règlement centrales maintiennent des fondamentaux stables : Solana domine en fréquence transactionnelle et activité utilisateur, Ethereum reste le pôle central en frais et allocation de capitaux. À l’inverse, la divergence Layer 2 s’accentue. Base conserve une capacité stable d’absorption, tandis qu’Arbitrum subit une pression sur l’activité, les frais et les flux de capitaux. Le marché de fin d’année n’a pas connu d’expansion généralisée ; capitaux et utilisateurs adoptent une approche plus rationnelle, et la concurrence entre blockchains se concentre sur l’évaluation fonctionnelle, l’efficacité du capital et l’usage réel, au-delà des dynamiques narratives.
Pour Bitcoin, le repli du mois a engagé l’offre haut de gamme dans une phase d’assouplissement et de rotation, formant une consolidation au-dessus des zones de coût denses. L’action court terme passe de la vigueur à la pression. Les pertes latentes augmentent mais restent concentrées sur les détenteurs court terme, tandis que l’offre long terme demeure en profit. Le cadre haussier moyen terme n’est pas invalidé. Le marché est en phase de transition « repli, rotation, rééquilibrage », la trajectoire future dépendant de la solidité du support sur les coûts inférieurs et de la capacité à reconstruire un momentum haussier après refroidissement du sentiment.
Sur les projets et tokens, le marché de la prédiction BSC entre en phase d’expérimentation interne après le lancement de plusieurs plateformes. Le volume notionnel agrégé approche 6,5 milliards USD, la liquidité restant concentrée sur Opinion. Les nouveaux entrants sont en phase de validation et d’acquisition, ce qui laisse le paysage concurrentiel ouvert. Côté tokens, $BEAT a profité de la rotation du capital et d’une structure de trading améliorée dans un marché en range, avec un rallye ponctuel proche de 300 %. Cette hausse est portée par le trading à bêta élevé et l’amplification communautaire. Le marché reste ainsi défini par une expansion structurelle et une dynamique orientée trading, une phase de tendance durable dépendant de nouveaux catalyseurs macro ou on-chain.
Références :
- Artemis, https://app.artemisanalytics.com/chains
- Artemis, https://app.artemisanalytics.com/chains
- Artemis, https://app.artemisanalytics.com/chains
- Artemis, https://app.artemisanalytics.com/flows
- Glassnode, https://studio.glassnode.com/charts/indicators.CostBasisDistributionHeatmap?a=BTC&period=5y
- Glassnode, https://studio.glassnode.com/charts/supply.LossSum?a=BTC&chartStyle=column&s=1485388800&u=1765929600&zoom=
- Glassnode, https://studio.glassnode.com/charts/supply.LthSthProfitLossRelative?a=BTC&mAvg=7&s=1472860800&u=1765929600&zoom=
- Dune, https://dune.com/defioasis/prediction-market-wars-on-bsc
- CoinGecko, https://www.coingecko.com/coins/audiera
Gate Research est une plateforme de recherche blockchain et crypto offrant des analyses techniques, des insights de marché, des études sectorielles, des prévisions de tendances et des analyses macroéconomiques approfondies.
Avertissement
L’investissement sur les marchés de cryptomonnaies comporte un risque élevé. Les utilisateurs doivent effectuer leurs propres recherches et bien comprendre la nature des actifs et produits avant toute décision. Gate décline toute responsabilité en cas de pertes ou dommages résultant de telles décisions.