Trade
Basic
Futures
Futures
Hundreds of contracts settled in USDT or BTC
TradFi
Gold
Trade global traditional assets with USDT in one place
Options
Hot
Trade European-style vanilla options
Unified Account
Maximize your capital efficiency
Demo Trading
Futures Kickoff
Get prepared for your futures trading
Futures Events
Participate in events to win generous rewards
Demo Trading
Use virtual funds to experience risk-free trading
Earn
Launch
CandyDrop
Collect candies to earn airdrops
Launchpool
Quick staking, earn potential new tokens
HODLer Airdrop
Hold GT and get massive airdrops for free
Launchpad
Be early to the next big token project
Alpha Points
Trade on-chain assets and enjoy airdrop rewards!
Futures Points
Earn futures points and claim airdrop rewards
Investment
Simple Earn
Earn interests with idle tokens
Auto-Invest
Auto-invest on a regular basis
Dual Investment
Buy low and sell high to take profits from price fluctuations
Soft Staking
Earn rewards with flexible staking
Crypto Loan
0 Fees
Pledge one crypto to borrow another
Lending Center
One-stop lending hub
VIP Wealth Hub
Customized wealth management empowers your assets growth
Private Wealth Management
Customized asset management to grow your digital assets
Quant Fund
Top asset management team helps you profit without hassle
Staking
Stake cryptos to earn in PoS products
Smart Leverage
New
No forced liquidation before maturity, worry-free leveraged gains
GUSD Minting
Use USDT/USDC to mint GUSD for treasury-level yields
More
MeSuTBTCANALiZ
Bitcoin Analysis
The right time for the right transactions... ?
MesutBtcAnaliz

- Reward
- like
- Comment
- Repost
- Share
The live broadcast of the technical analysis chart on Bitcoin is starting soon. Don't miss the live session to discuss markets and analysis. For your questions, leave a comment and you will receive a quick response.
BTC-1.96%

- Reward
- 1
- Comment
- Repost
- Share
The live broadcast of technical chart analysis on Bitcoin is starting shortly. We will share charts for short-term buying and Bitcoin movement range.
If you have questions, send them to us during the live broadcast. If you want, leave comments on the posts; responses will be given promptly.
$BTC $GT $ETH
View OriginalIf you have questions, send them to us during the live broadcast. If you want, leave comments on the posts; responses will be given promptly.
$BTC $GT $ETH
- Reward
- 1
- Comment
- Repost
- Share

Follow the live broadcast time for Bitcoin technical chart analysis. The live broadcast will start in about 1 hour.
There will be sharing of charts about Bitcoin.
If you have questions, write them in the comments. They will be answered during the live broadcast and the necessary responses will be provided here.
$BTC $ETH $GT
View OriginalThere will be sharing of charts about Bitcoin.
If you have questions, write them in the comments. They will be answered during the live broadcast and the necessary responses will be provided here.
$BTC $ETH $GT


- Reward
- like
- Comment
- Repost
- Share
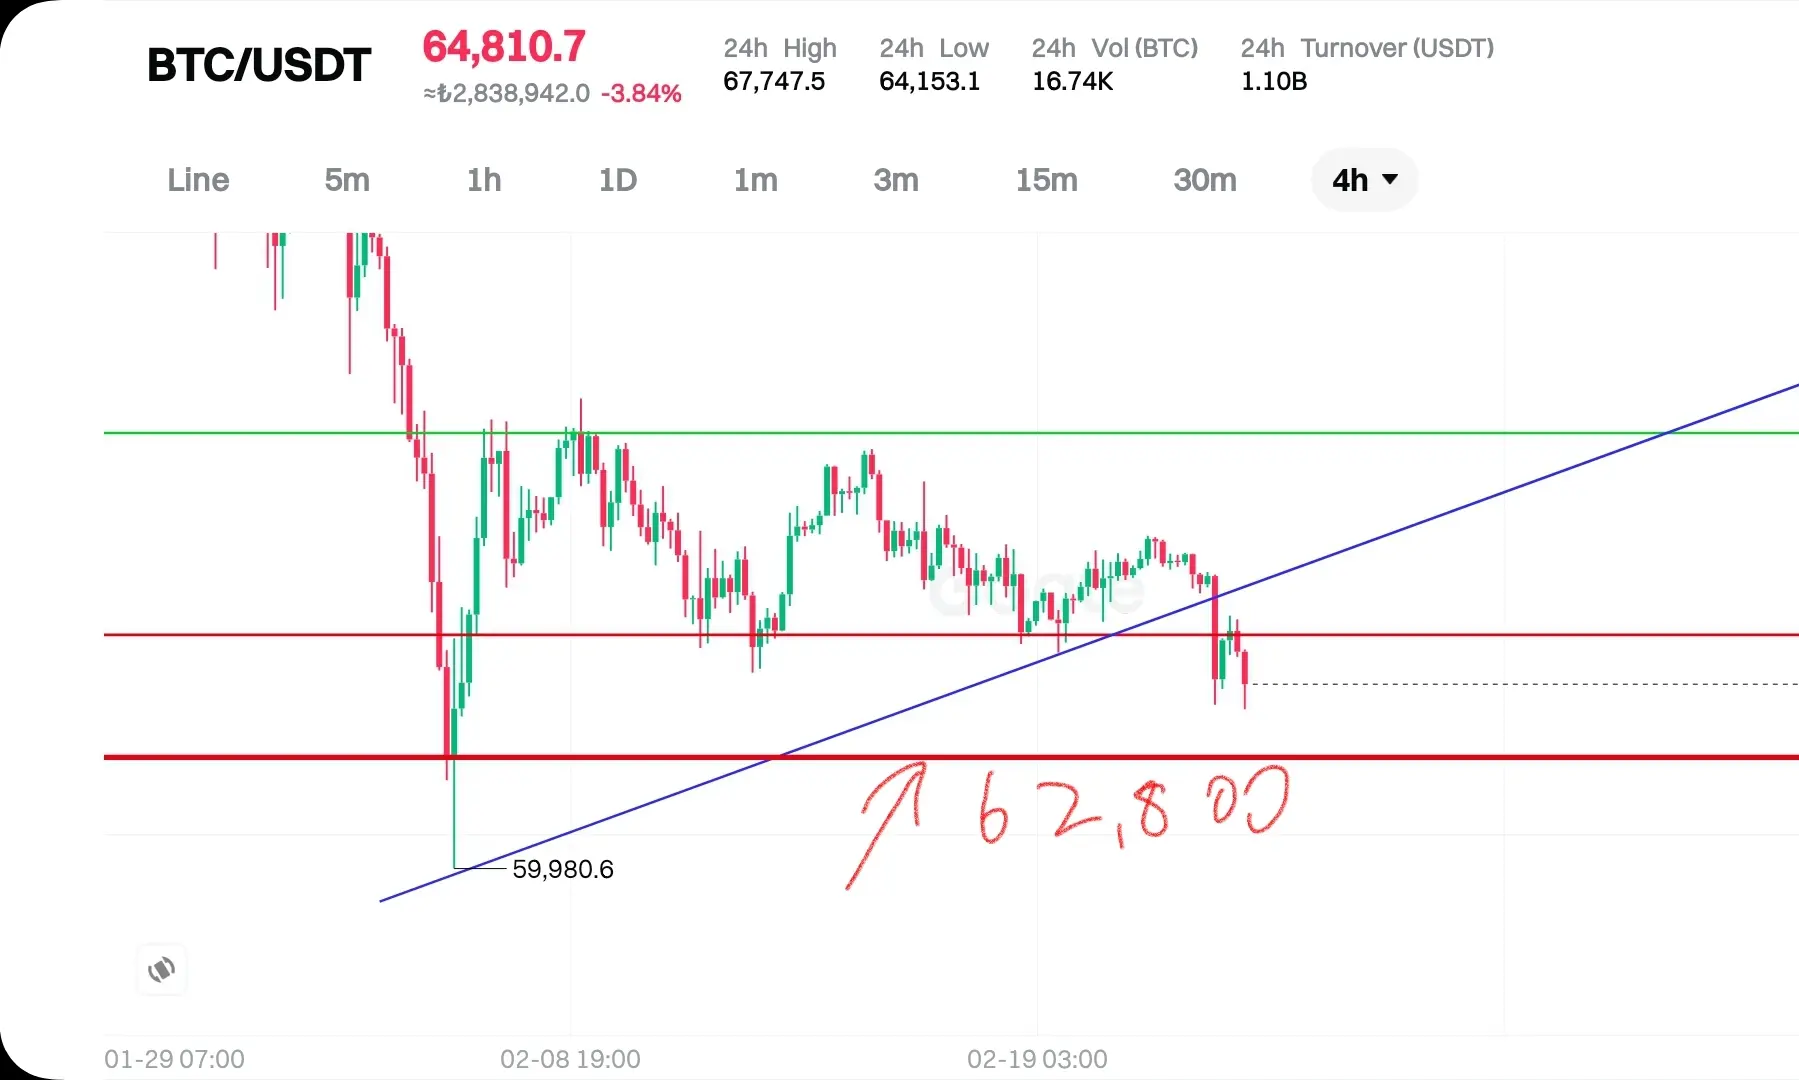
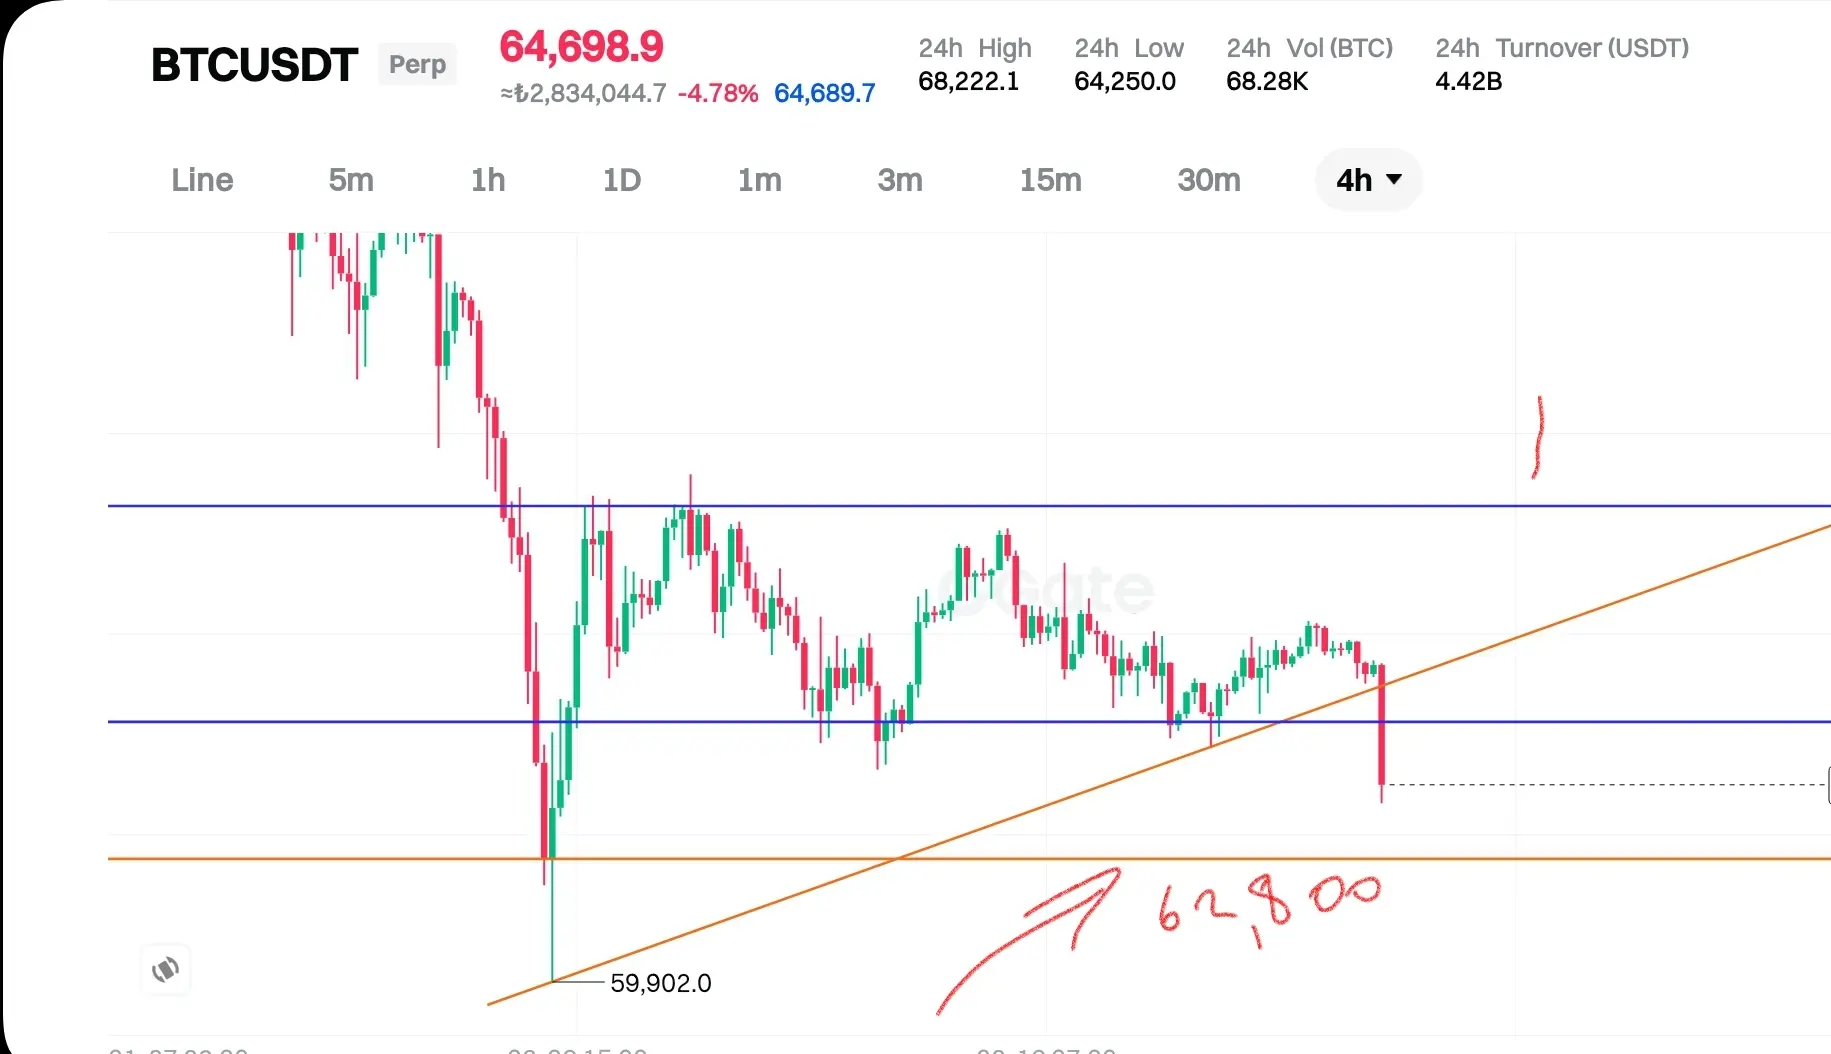
Technical Chart Analysis on Bitcoin:
Bitcoin closed below 66,800, entering a downward correction trend. The resistance level we need to watch is 62,800. Indicators show a support level down to 55,000. We explained this live. How much gold prices will extend is uncertain. For short-term buying, you can follow this level.
For your questions, leave us a comment. We will try to respond as soon as possible.
$BTC $GT $ETH
View OriginalBitcoin closed below 66,800, entering a downward correction trend. The resistance level we need to watch is 62,800. Indicators show a support level down to 55,000. We explained this live. How much gold prices will extend is uncertain. For short-term buying, you can follow this level.
For your questions, leave us a comment. We will try to respond as soon as possible.
$BTC $GT $ETH


- Reward
- like
- Comment
- Repost
- Share
Technical Chart Analysis of Bitcoin:
As explained in the live broadcast, if the closing occurs below 66,800, the correction point will be between 57,000 and 55,000. To take advantage of this decline, short-term spot purchases can be made. Follow the decline and determine your position accordingly. Technical analyses will be conducted again in the live broadcast. Stay tuned. You can share your questions with us in the comments.
$BTC $GT $ETH
View OriginalAs explained in the live broadcast, if the closing occurs below 66,800, the correction point will be between 57,000 and 55,000. To take advantage of this decline, short-term spot purchases can be made. Follow the decline and determine your position accordingly. Technical analyses will be conducted again in the live broadcast. Stay tuned. You can share your questions with us in the comments.
$BTC $GT $ETH
- Reward
- like
- Comment
- Repost
- Share
Technical analysis and chart information about Bitcoin.
In our live broadcast, we analyzed Bitcoin movements and discussed indicators suggesting that Bitcoin will test the $74,000 level.
Otherwise, if it closes below $66,800, we will follow a sharp downward decline. We will consider buying opportunities from the lower levels.
If you have any questions, please let us know in the comments, and we will try to assist you.
$BTC $GT $ETH
View OriginalIn our live broadcast, we analyzed Bitcoin movements and discussed indicators suggesting that Bitcoin will test the $74,000 level.
Otherwise, if it closes below $66,800, we will follow a sharp downward decline. We will consider buying opportunities from the lower levels.
If you have any questions, please let us know in the comments, and we will try to assist you.
$BTC $GT $ETH


- Reward
- like
- Comment
- Repost
- Share
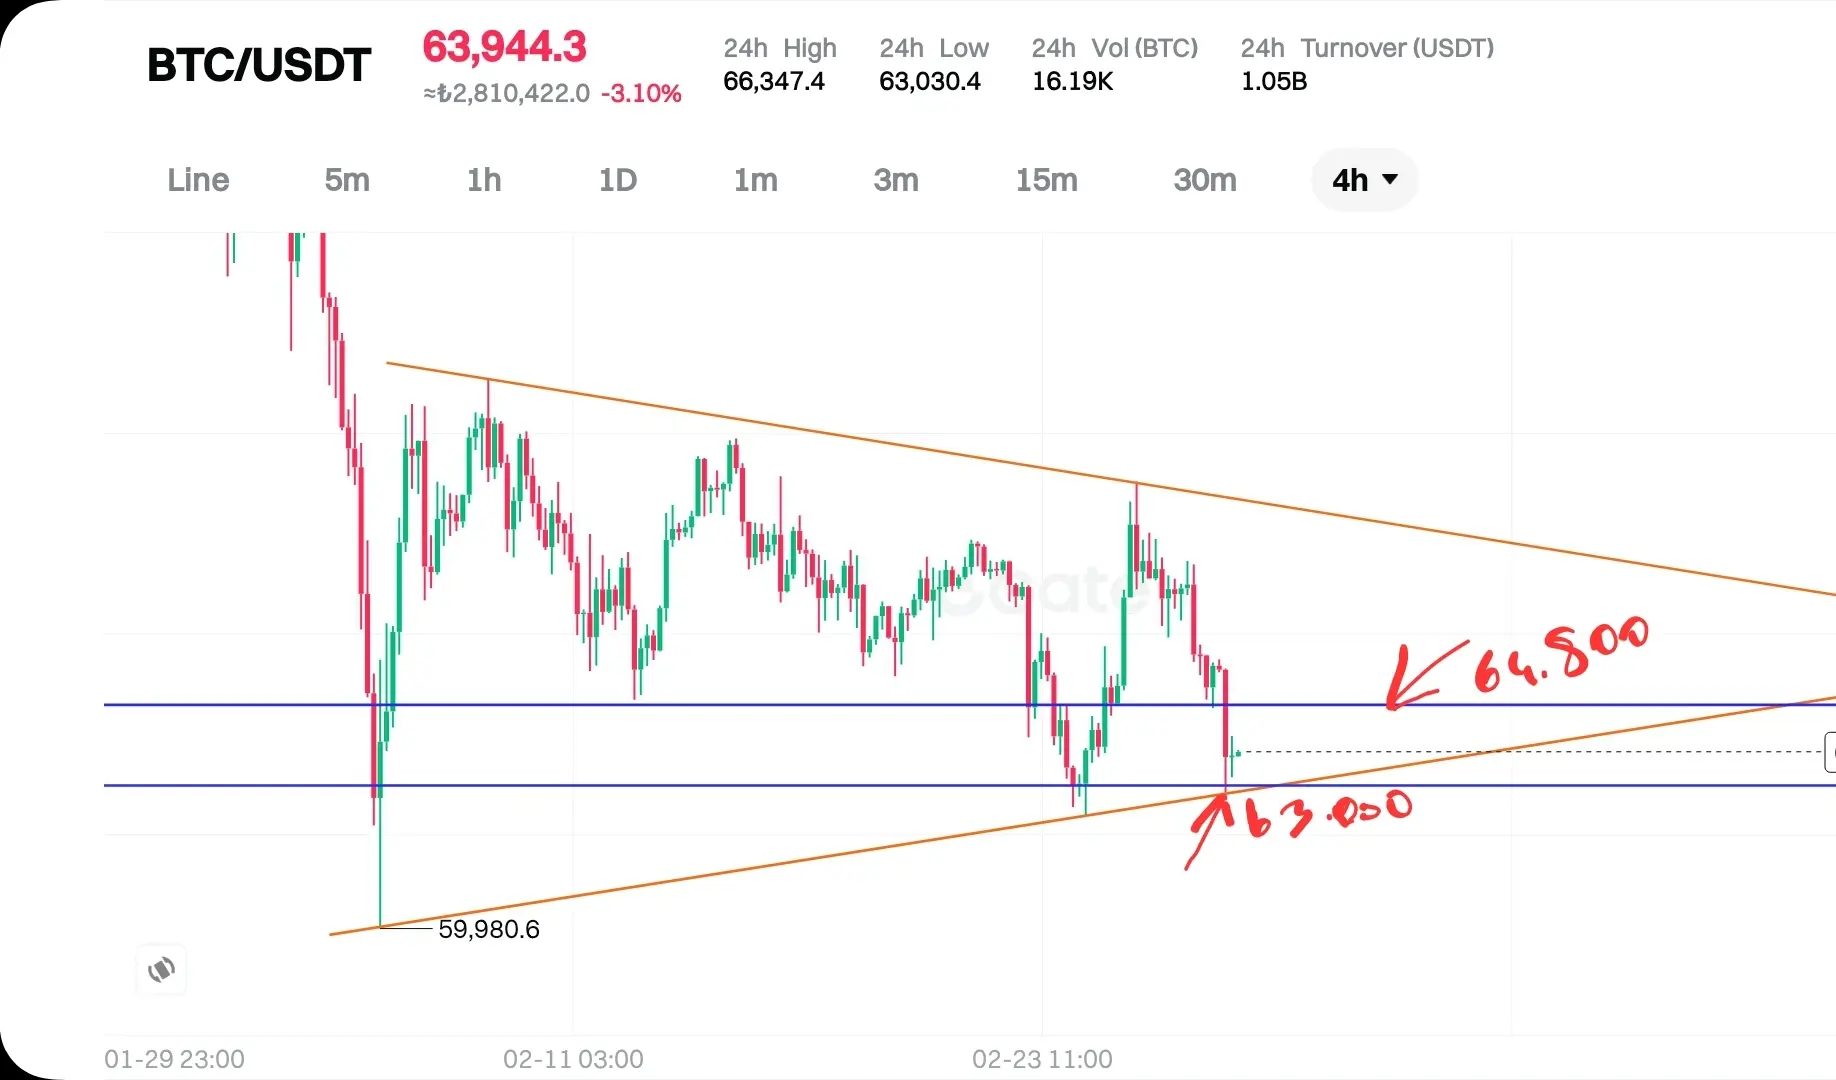
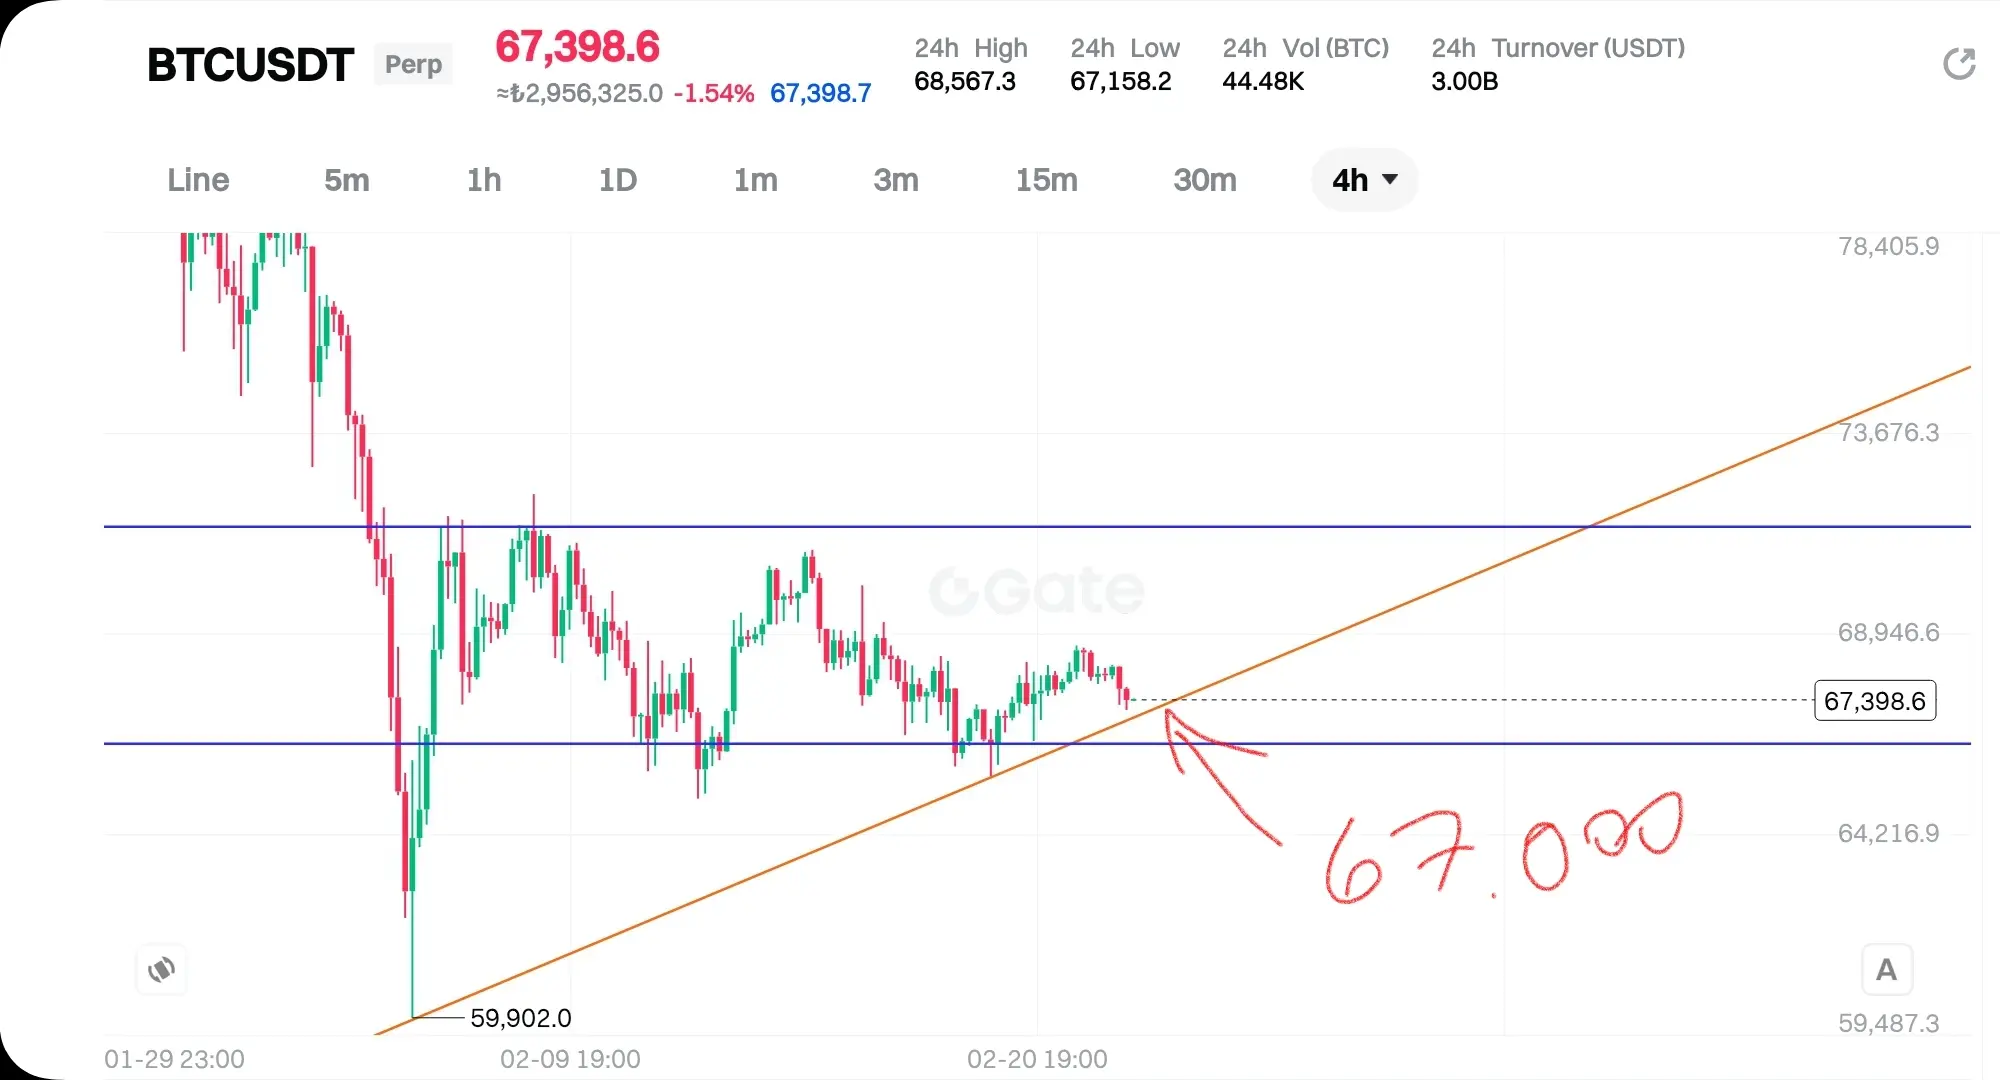
Graph analysis about Bitcoin.
Bitcoin's 67,000 level is a reaction point. If it stays below this and closes below 66,800, we could see sharp declines to $57,000 and $55,000. If it receives a reaction, we will continue to monitor the 71,500 level.
Write your questions in the comments; necessary answers will be provided.
$BTC $GT $ETH
View OriginalBitcoin's 67,000 level is a reaction point. If it stays below this and closes below 66,800, we could see sharp declines to $57,000 and $55,000. If it receives a reaction, we will continue to monitor the 71,500 level.
Write your questions in the comments; necessary answers will be provided.
$BTC $GT $ETH

- Reward
- 2
- Comment
- Repost
- Share

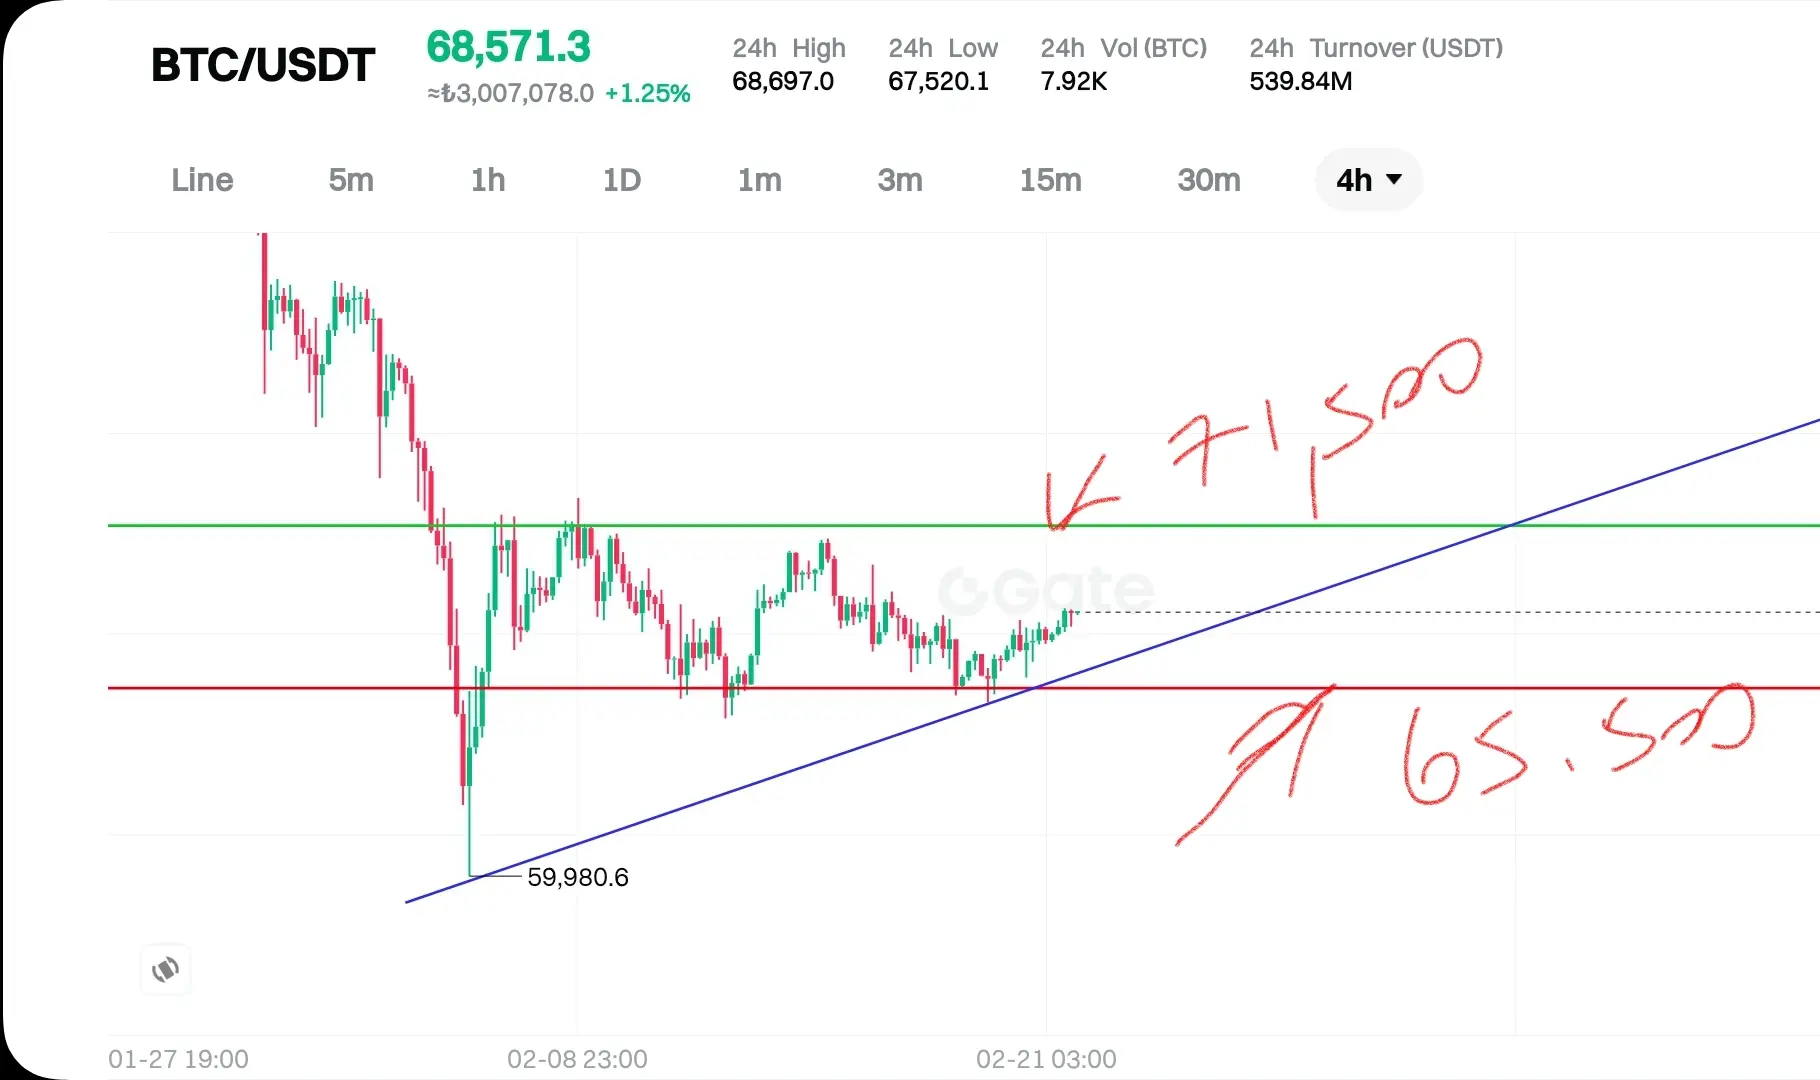
Technical analysis in Bitcoin indicates resistance levels.
If Bitcoin cannot close above 71,500 or break above it, we may see a sharp decline.
A resistance point, whether up or down, if not broken during testing, then the opposite resistance point must be broken. Therefore, if 71,500 is not broken, it is likely that the price will break below 65,500. And if such a decline occurs, short-term buying opportunities may arise. Of course, we will continue to share updates, and you can act accordingly.
Stay tuned.
Let us know in the comments if you have any questions.
$BTC $ETH $SOL
View OriginalIf Bitcoin cannot close above 71,500 or break above it, we may see a sharp decline.
A resistance point, whether up or down, if not broken during testing, then the opposite resistance point must be broken. Therefore, if 71,500 is not broken, it is likely that the price will break below 65,500. And if such a decline occurs, short-term buying opportunities may arise. Of course, we will continue to share updates, and you can act accordingly.
Stay tuned.
Let us know in the comments if you have any questions.
$BTC $ETH $SOL
- Reward
- 2
- Comment
- Repost
- Share
- Reward
- 1
- Comment
- Repost
- Share
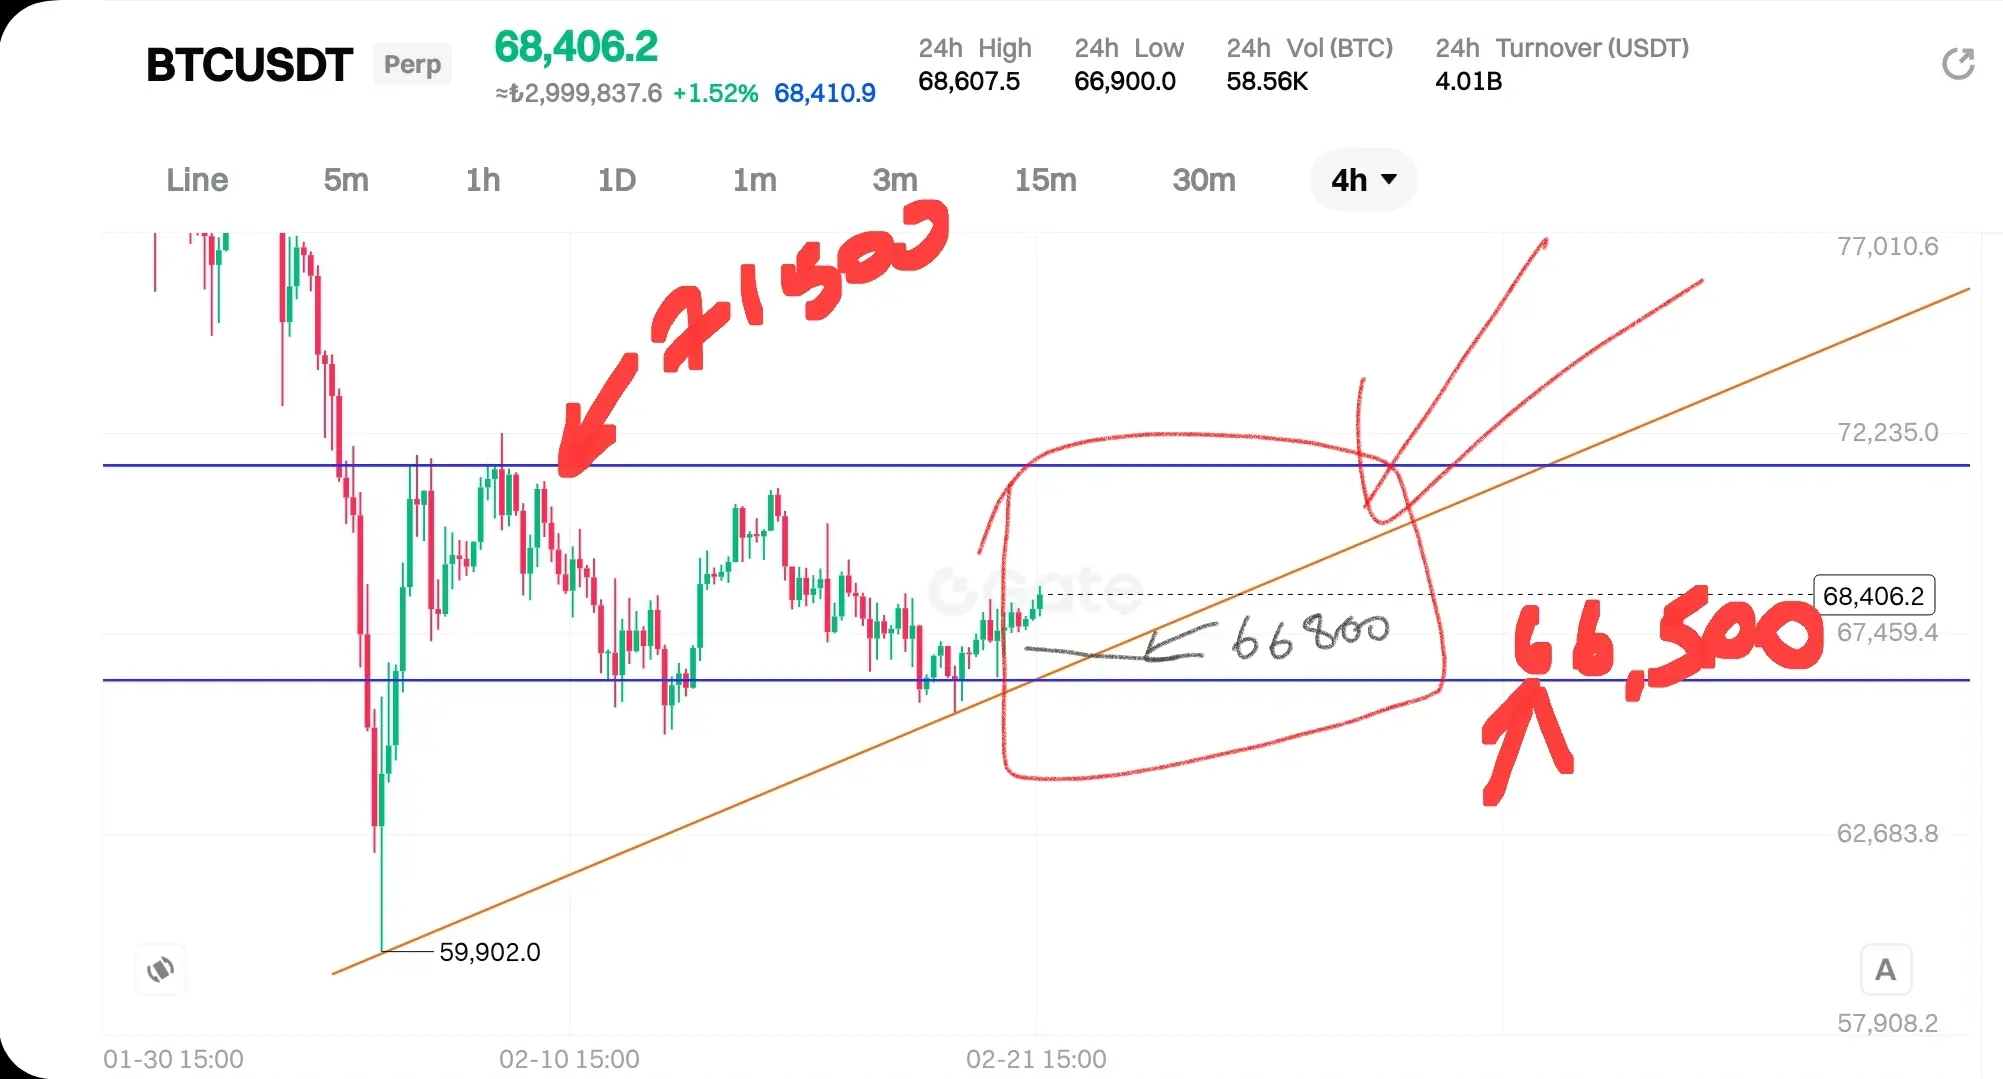
Graphical analysis of Bitcoin:
As seen in the image below, the current positions are as follows, and I have written the support and resistance points for you to remember. You can follow this accordingly. If there is a close below 66,800, a decline will occur; otherwise, the trend will continue upward. If there is a close above 71,500, a rise to 74,000 will begin. Still, it's advisable to be cautious.
$BTC $BTC $GT
View OriginalAs seen in the image below, the current positions are as follows, and I have written the support and resistance points for you to remember. You can follow this accordingly. If there is a close below 66,800, a decline will occur; otherwise, the trend will continue upward. If there is a close above 71,500, a rise to 74,000 will begin. Still, it's advisable to be cautious.
$BTC $BTC $GT

- Reward
- like
- Comment
- Repost
- Share
Gate Live 2026 Lunar New Year On-Chain Gala · Non-Stop Market Insights https://www.gate.com/campaigns/3937?ref=U1lDBAhX&ref_type=132

- Reward
- 2
- Comment
- Repost
- Share
Regarding Bitcoin: If we see a close above 68,800, the next reaction point could be 71,500, and if we close above that, we might attempt 74,000. Of course, the upward movement won't be continuous; sharp pullbacks will continue. You can follow the shared insights for short-term trading.
If you want to ask questions, write in the comments; we will respond.
Think carefully before making a decision. And always be patient, don't forget.
$BTC $GT $ETH
View OriginalIf you want to ask questions, write in the comments; we will respond.
Think carefully before making a decision. And always be patient, don't forget.
$BTC $GT $ETH

- Reward
- like
- Comment
- Repost
- Share
ABOUT BTC
In our technical analysis of Bitcoin chart, the upward trend continues as before. Currently at 68,500, this is the resistance point, and when a decline occurs, we will monitor 66,800. If it stays below this level, sharp declines may happen; if it remains in sideways movement above, the rise to 71,500 and 74,000 will continue accordingly.
If you have any analyses about altcoins you want to learn about, write in the comments and we will try to help you. If you have any questions, write in the comments and they will be answered.
$BTC $GT $ETH
View OriginalIn our technical analysis of Bitcoin chart, the upward trend continues as before. Currently at 68,500, this is the resistance point, and when a decline occurs, we will monitor 66,800. If it stays below this level, sharp declines may happen; if it remains in sideways movement above, the rise to 71,500 and 74,000 will continue accordingly.
If you have any analyses about altcoins you want to learn about, write in the comments and we will try to help you. If you have any questions, write in the comments and they will be answered.
$BTC $GT $ETH

- Reward
- 2
- Comment
- Repost
- Share
Hello friends, a long time ago we shared gate updates with you, provided information about charts, and explained many useful analyses to many people. We shared information about charts with many individuals. We held live broadcasts for a long time and shared what to expect on BTC analysis and charts. And now, after a long time, we will help you again by sharing new updates to assist you once more. We will hold live broadcasts from time to time; if you have time, join us. For those who cannot find time, we will also share posts on our page. On our page, we will provide information about Bitcoin
View Original

- Reward
- 1
- Comment
- Repost
- Share
Hello friends, it's been a long time since we shared updates on gate. We provided information about charts, shared useful analyses with many people, and explained details about charts to numerous individuals. We have done live broadcasts for a long time, sharing what to expect on the charts regarding BTC analysis. And now, after a long time, we will help you again by sharing new updates to assist you. We will occasionally do live broadcasts; if you have time, join us. For those who can't find time, we will also share posts on our page. On our page, we will provide information about Bitcoin's r
View Original
- Reward
- 1
- Comment
- Repost
- Share
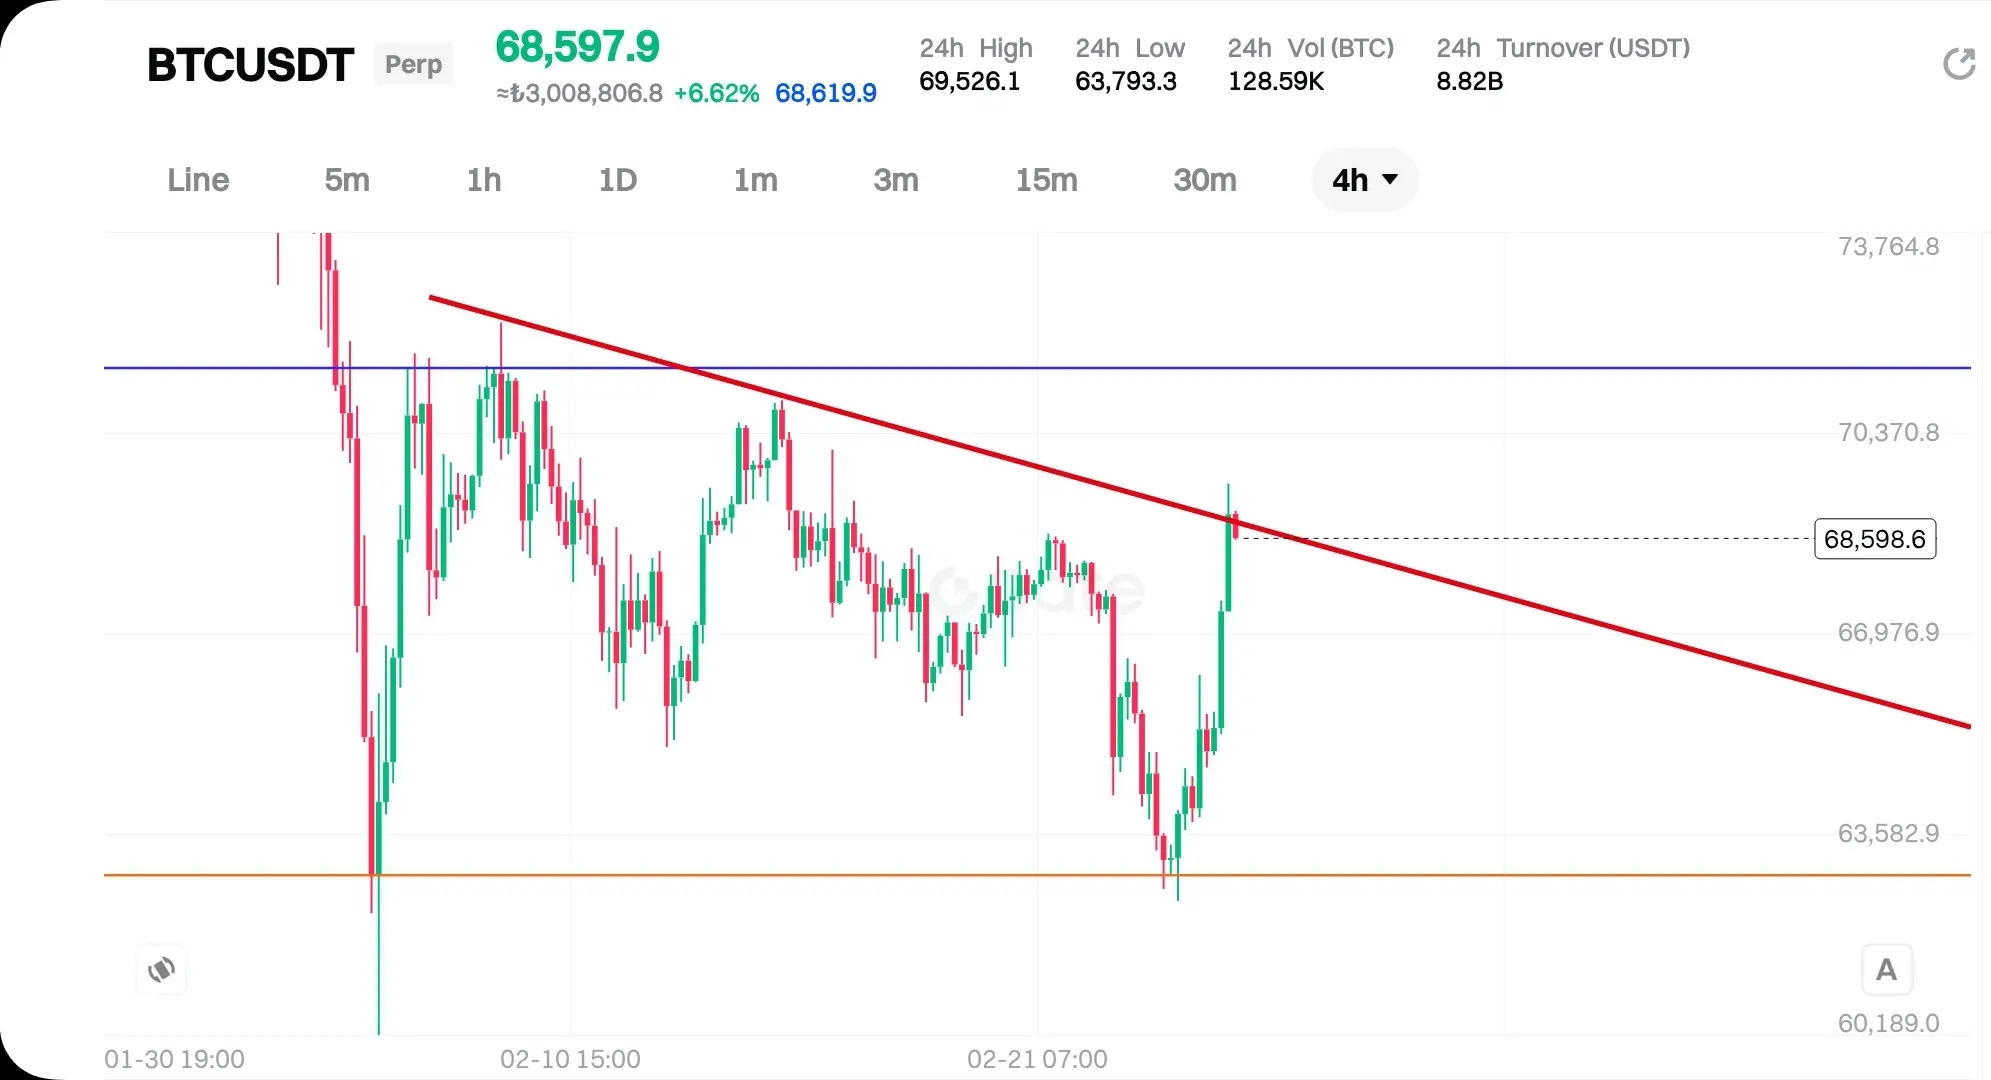
Current Graph Analysis of Bitcoin
There are no issues with Bitcoin's current upward trend. The first resistance point is 68,800, and the next resistance point is 71,400. If it stays above this level, the rise will continue up to 74,000.
The first support point in case of a decline is 66,800. If it falls below this level, we will share new analyses. If it moves sideways above this level, the upward trend will continue in any scenario.
Stay tuned.
$BTC $GT $ETH
View OriginalThere are no issues with Bitcoin's current upward trend. The first resistance point is 68,800, and the next resistance point is 71,400. If it stays above this level, the rise will continue up to 74,000.
The first support point in case of a decline is 66,800. If it falls below this level, we will share new analyses. If it moves sideways above this level, the upward trend will continue in any scenario.
Stay tuned.
$BTC $GT $ETH

- Reward
- 1
- Comment
- Repost
- Share
