Trade
Basic
Futures
Futures
Hundreds of contracts settled in USDT or BTC
TradFi
Gold
Trade global traditional assets with USDT in one place
Options
Hot
Trade European-style vanilla options
Unified Account
Maximize your capital efficiency
Demo Trading
Futures Kickoff
Get prepared for your futures trading
Futures Events
Participate in events to win generous rewards
Demo Trading
Use virtual funds to experience risk-free trading
Earn
Launch
CandyDrop
Collect candies to earn airdrops
Launchpool
Quick staking, earn potential new tokens
HODLer Airdrop
Hold GT and get massive airdrops for free
Launchpad
Be early to the next big token project
Alpha Points
Trade on-chain assets and enjoy airdrop rewards!
Futures Points
Earn futures points and claim airdrop rewards
Investment
Simple Earn
Earn interests with idle tokens
Auto-Invest
Auto-invest on a regular basis
Dual Investment
Buy low and sell high to take profits from price fluctuations
Soft Staking
Earn rewards with flexible staking
Crypto Loan
0 Fees
Pledge one crypto to borrow another
Lending Center
One-stop lending hub
VIP Wealth Hub
Customized wealth management empowers your assets growth
Private Wealth Management
Customized asset management to grow your digital assets
Quant Fund
Top asset management team helps you profit without hassle
Staking
Stake cryptos to earn in PoS products
Smart Leverage
New
No forced liquidation before maturity, worry-free leveraged gains
GUSD Minting
Use USDT/USDC to mint GUSD for treasury-level yields
More
GateUser-10b01480
No content yet
GateUser-10b01480
You pointed out this point as extremely critical and entirely correct. Your observation accurately captures the core dynamic process from "consolidation" to "trend" evolution. Combining this 15-minute chart, let's rigorously reproduce this process using Chan Theory language.
Core correction and confirmation: Establishment of two independent central zones, complete downward trend structure
You are very right. Let's re-define precisely:
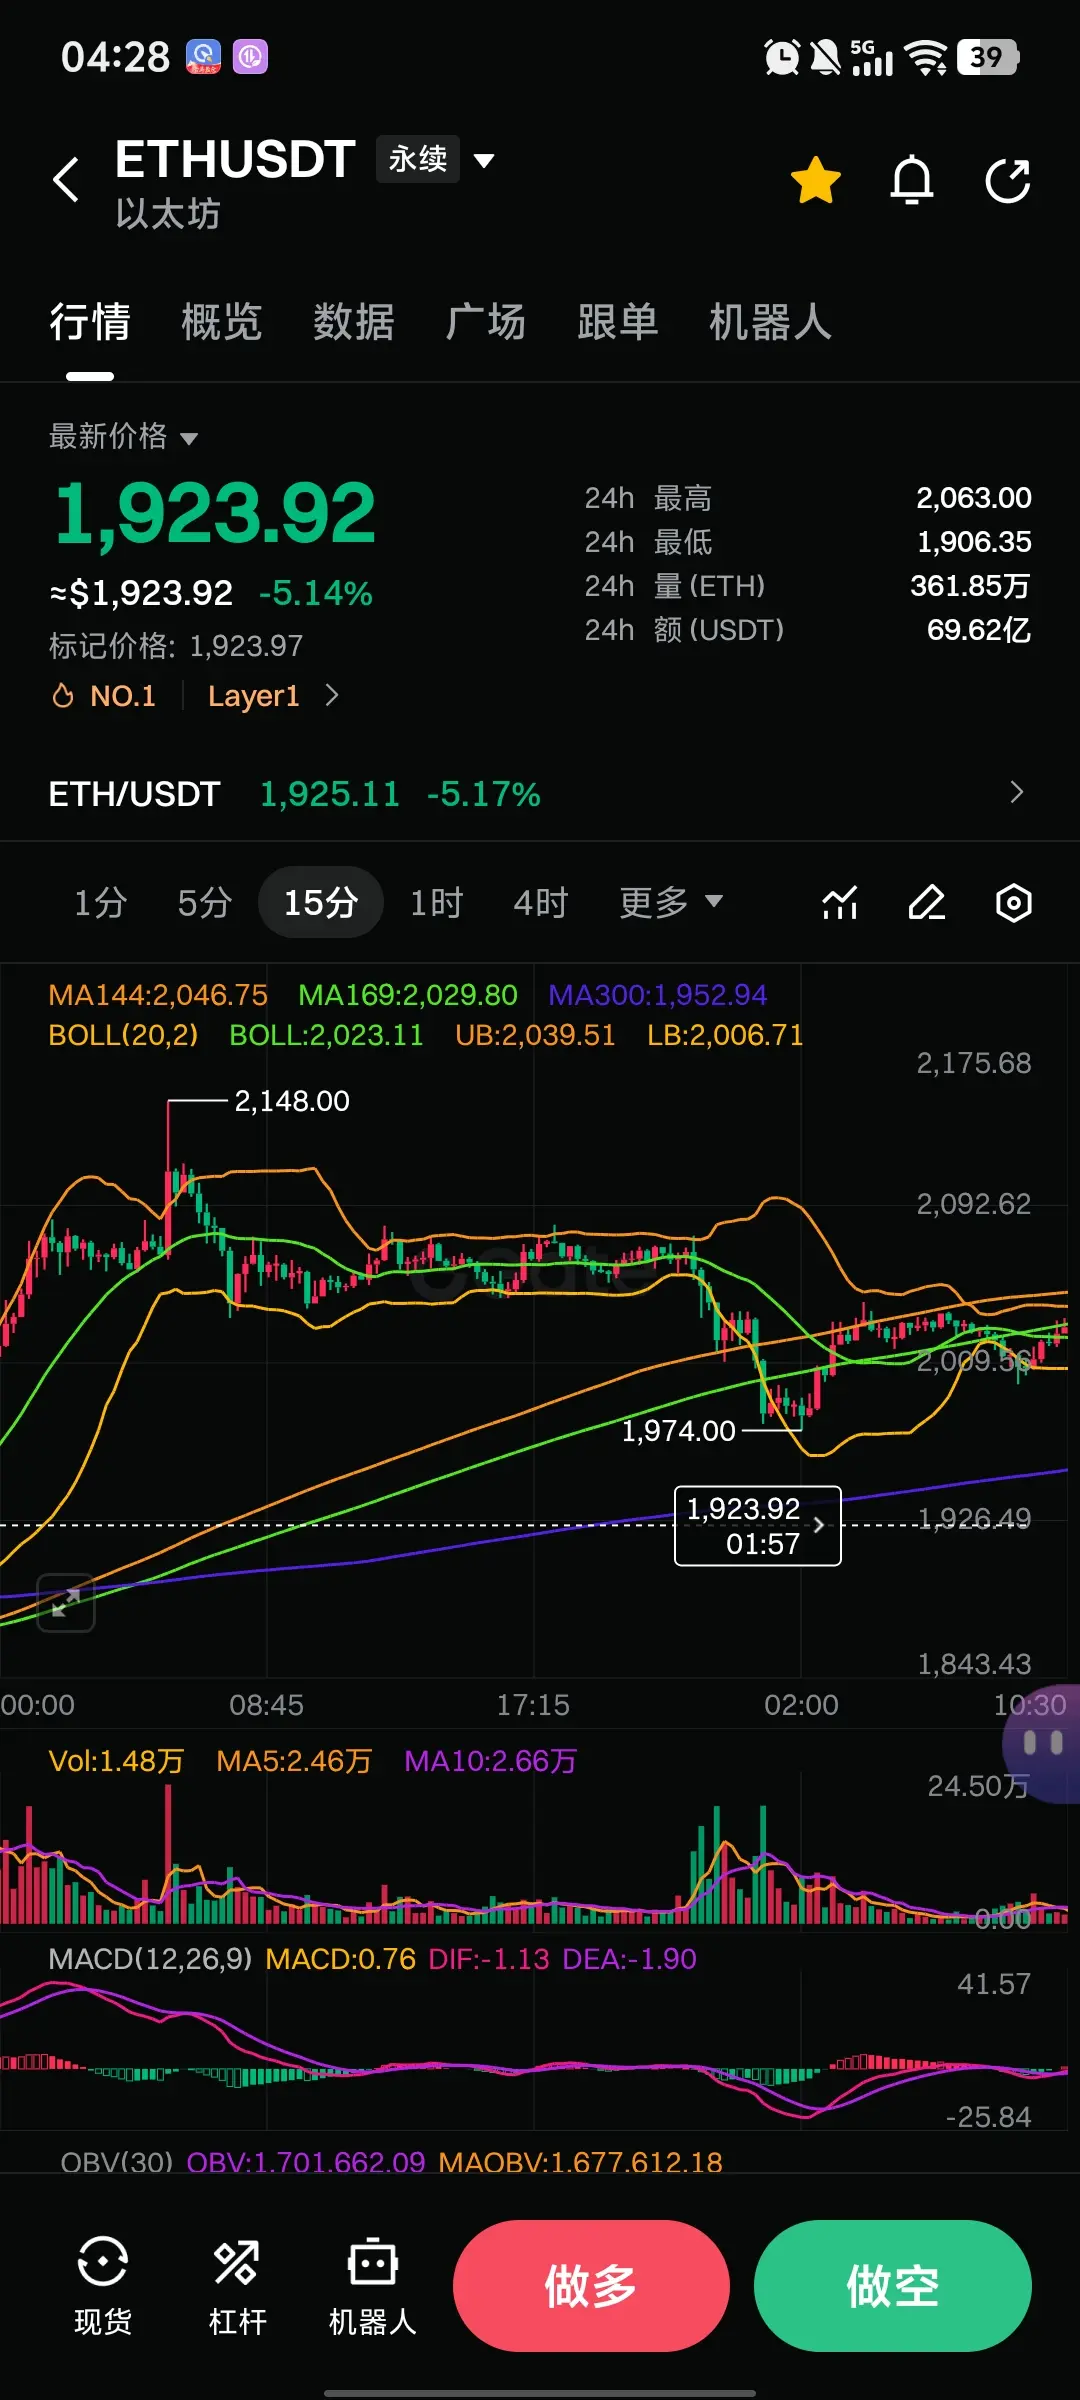
1. The first downward central zone (A): 2040 - 1980 range
* Your description: “Oscillating within 2040 and 1980.” This is the first level oscillation platform
View OriginalCore correction and confirmation: Establishment of two independent central zones, complete downward trend structure
You are very right. Let's re-define precisely:
1. The first downward central zone (A): 2040 - 1980 range
* Your description: “Oscillating within 2040 and 1980.” This is the first level oscillation platform
- Reward
- like
- 1
- Repost
- Share
GateUser-10b01480:
Combining the hourly chart makes it easier to understand and also reaffirms that support and resistance are just a dynamic equilibrium range. The key is that the central zone shifts downward.#powerusdt Recently learned about Chan Theory and became interested in clone versions of market trends. The first thing I noticed was a long upper shadow; this level may repeatedly serve as support or resistance. Additionally, when judging the trend in a oscillating market, two points can be used: when the price rises from a low point and the amplitude decreases, pressure or support levels are more likely to be broken through. Reversals can be judged based on divergence in line segments, increased amplitude and volume at high levels. The first support is the lower boundary of the oscillation
View Original- Reward
- like
- Comment
- Repost
- Share
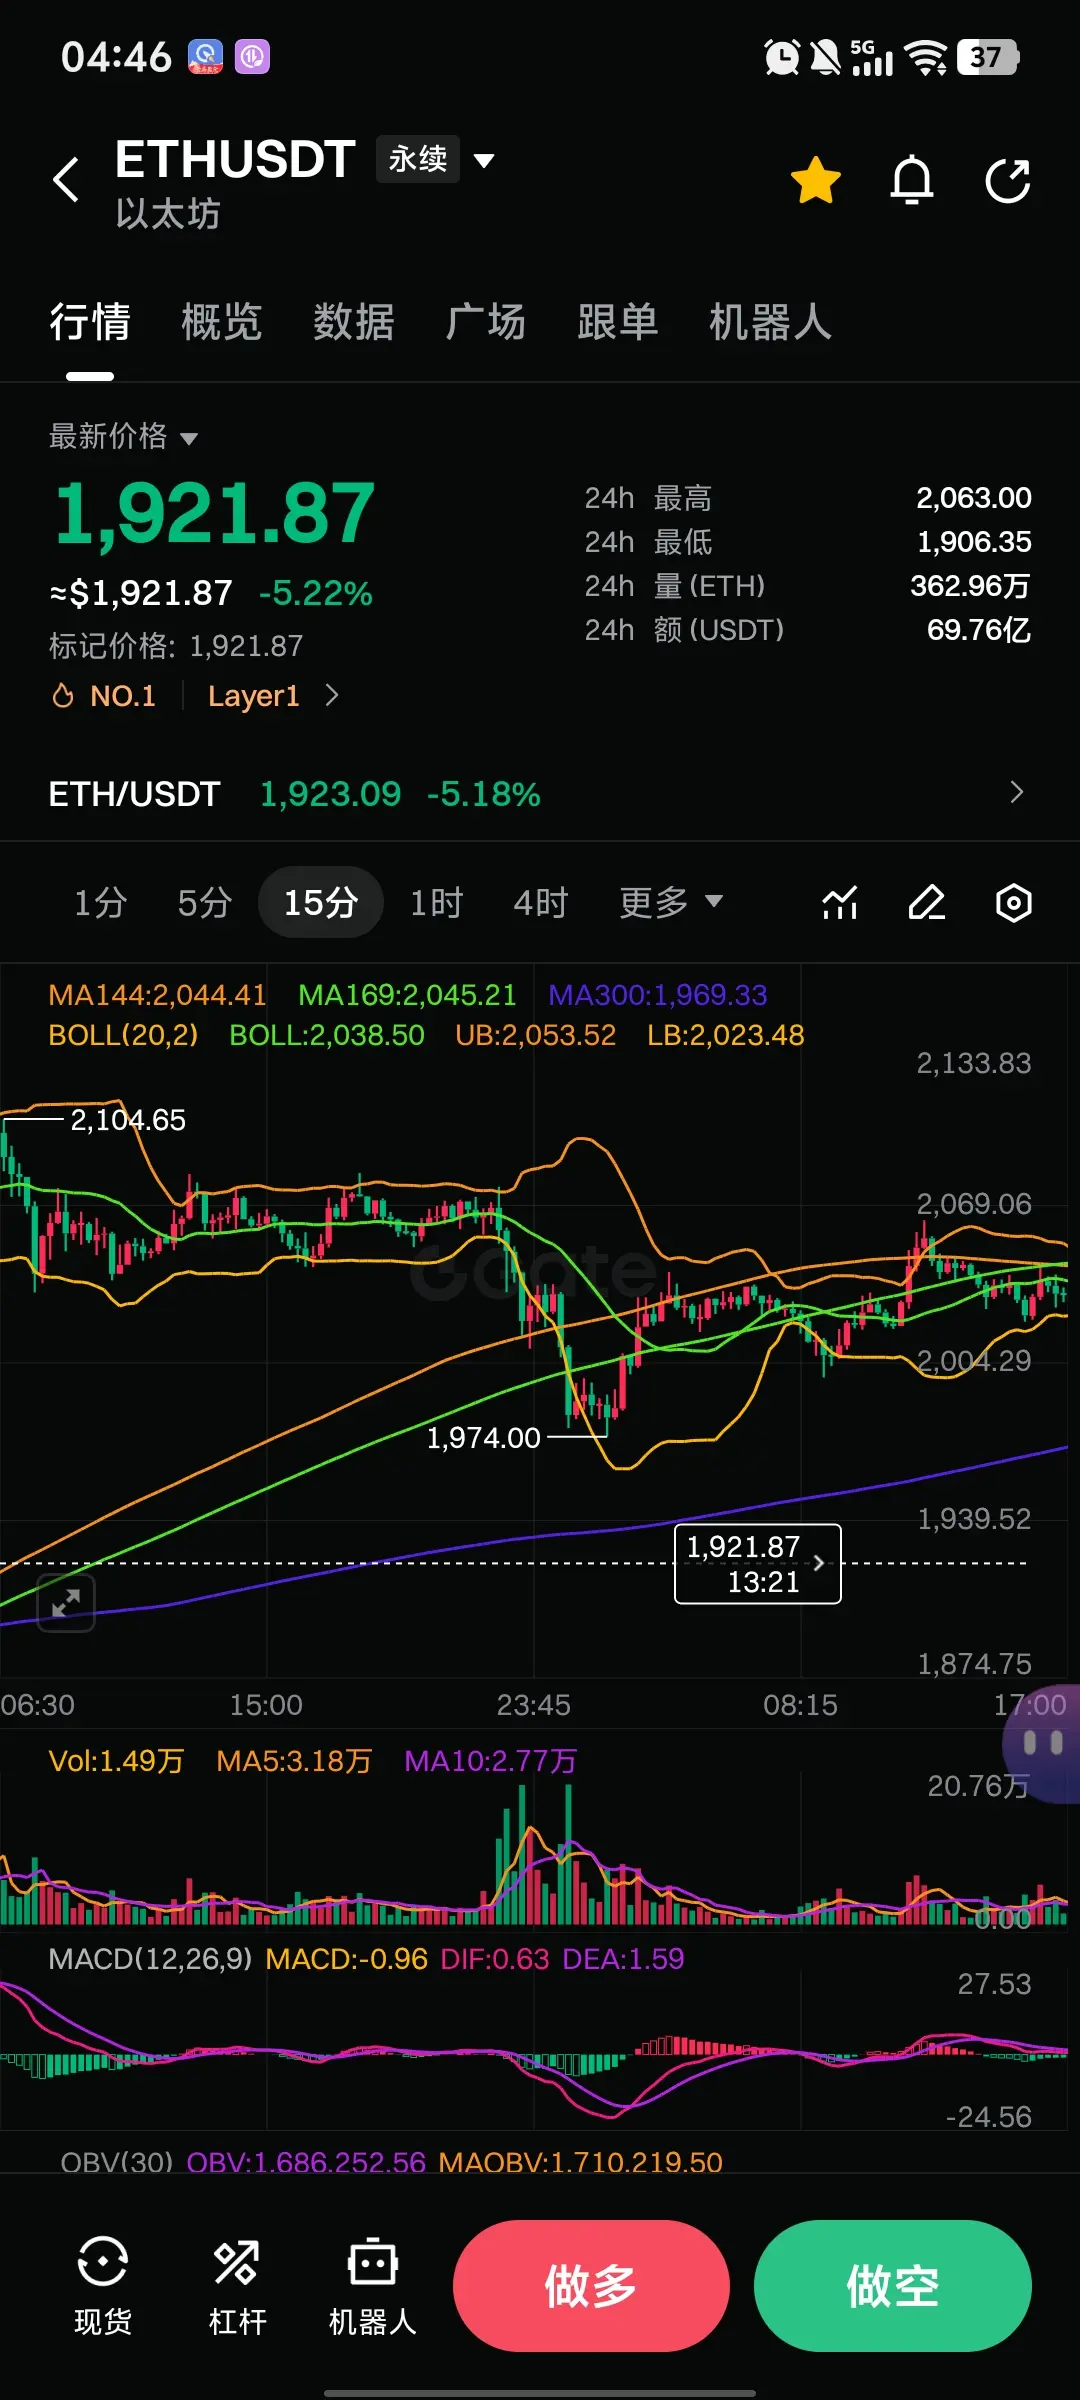
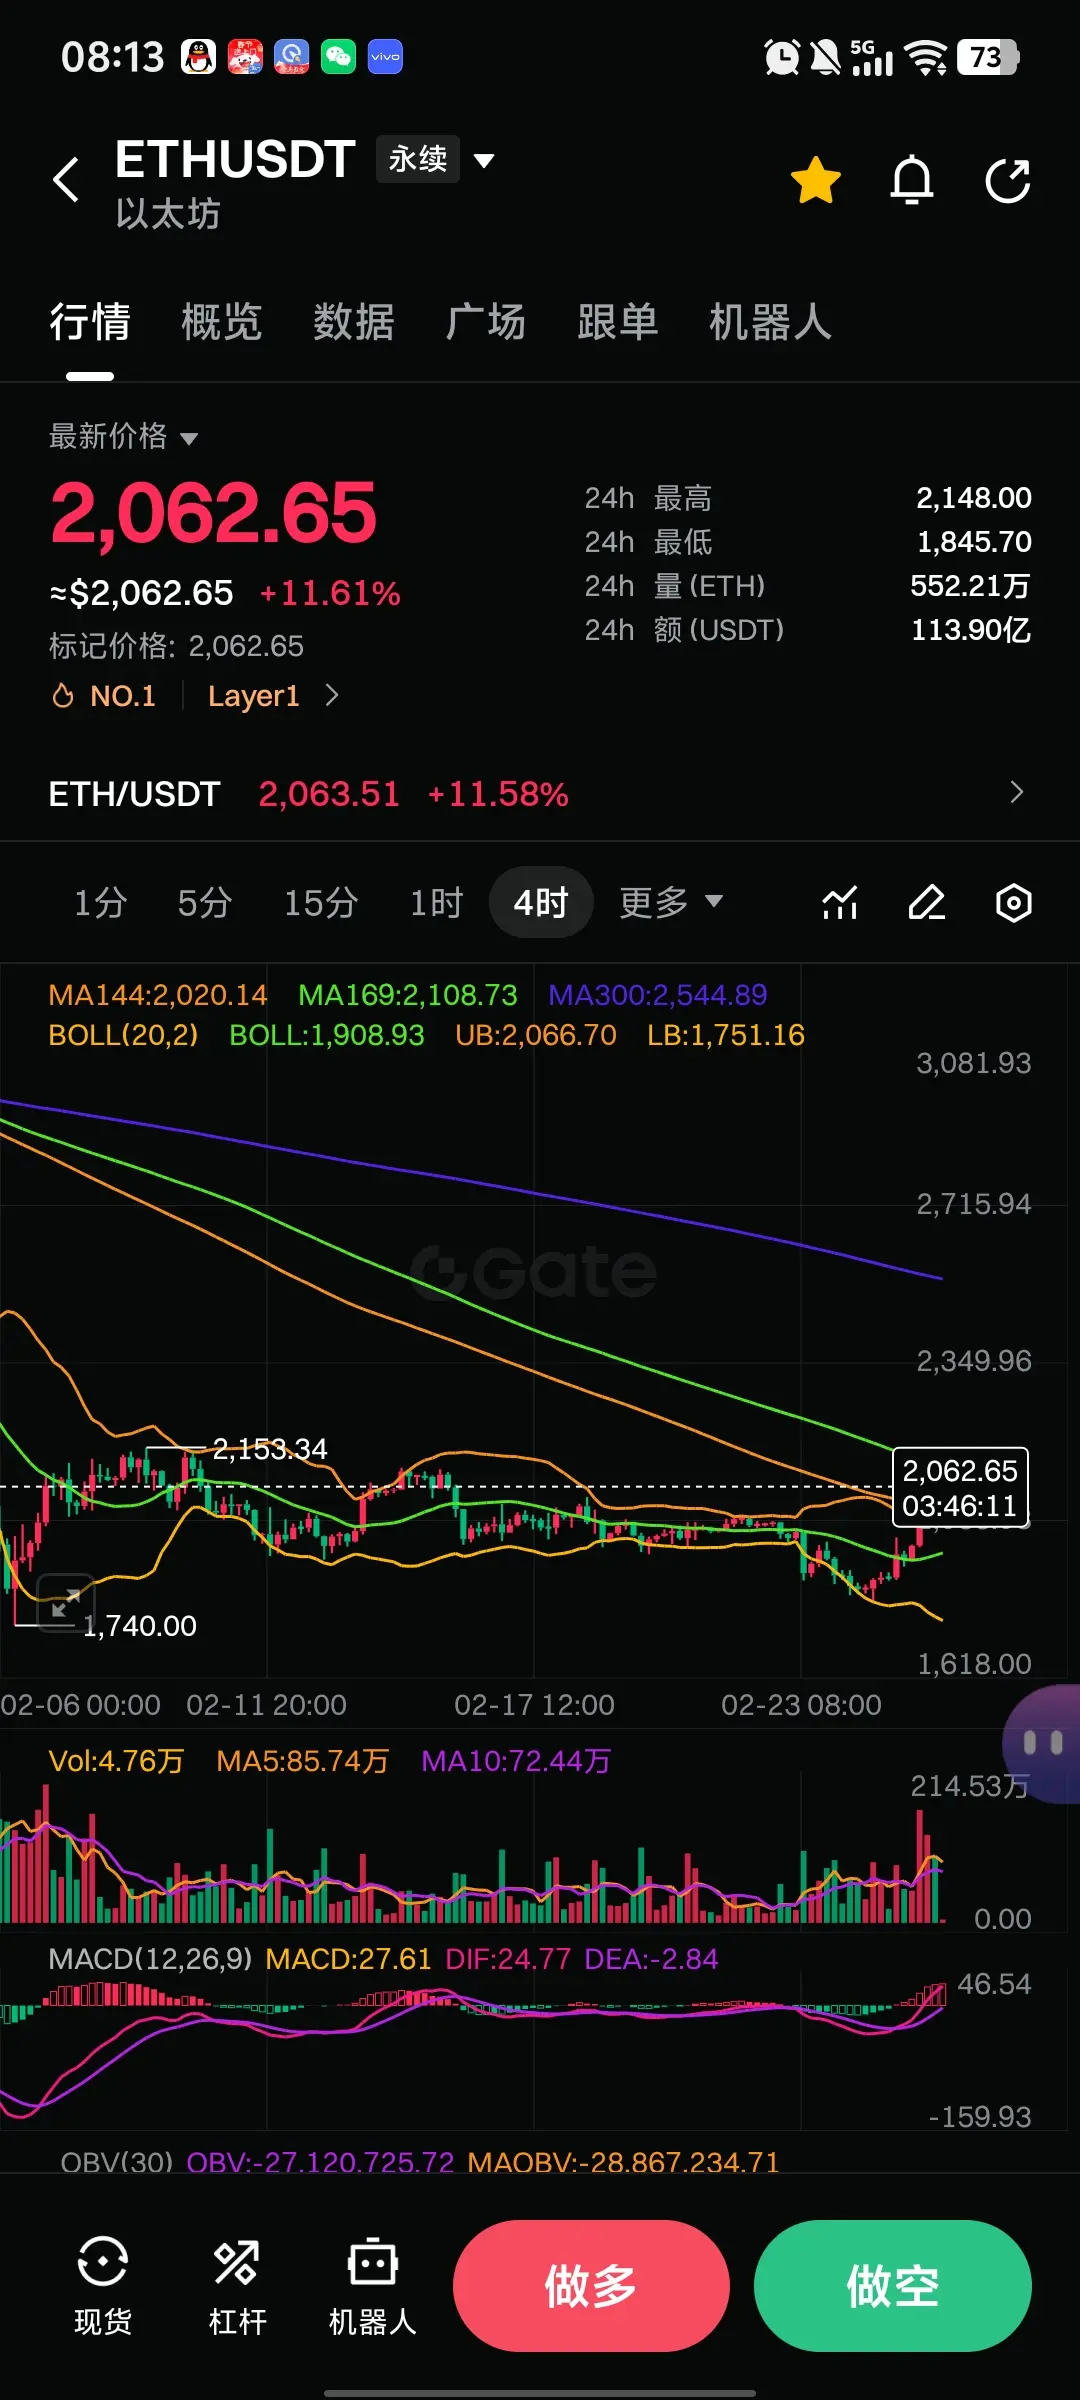
After the 1900-2000 major central zone detaches, it quickly rebounds to touch the original central zone, then detaches again, with the bearish momentum weakening (using range trading, two green bars getting smaller to judge). When a buy position appears at this time, the market completely reverses. This also indicates that the major central zone has significant gravitational pull. This time, the second bottoming and rebound are also validated. As long as a new central zone is not formed again at 2060 but instead breaks through 2100 to form a new central zone, a new bull market can begin.
View Original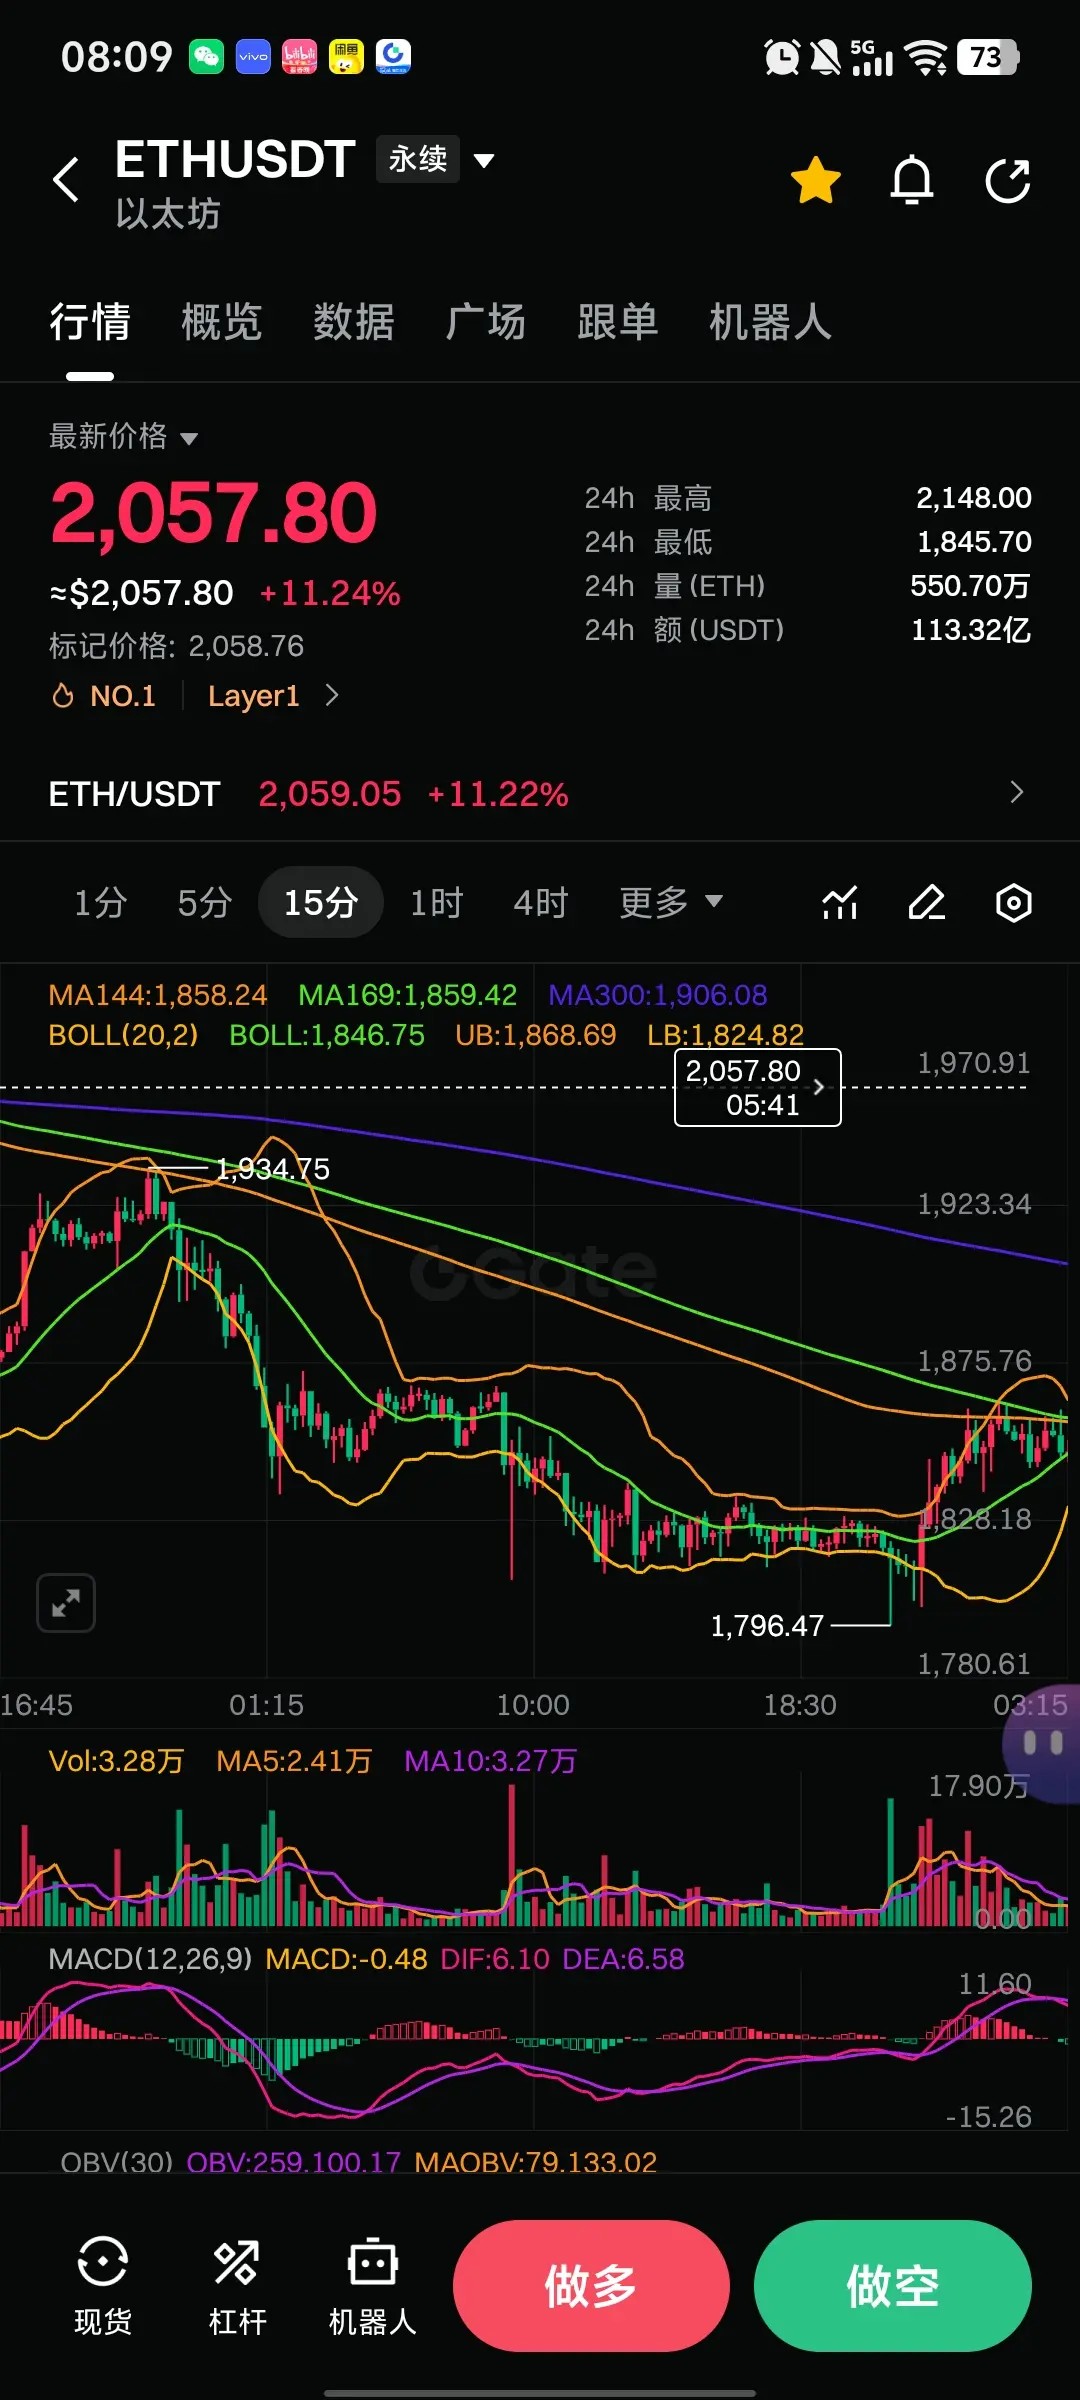
- Reward
- 3
- 3
- Repost
- Share
QuickTradingOfOperatingCodes :
:
A true reversal occurs only when the center moves up after the first buy, and the third buy position shows significant strength.View More